Download to read offline
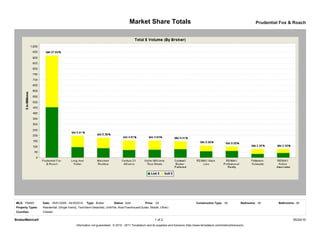
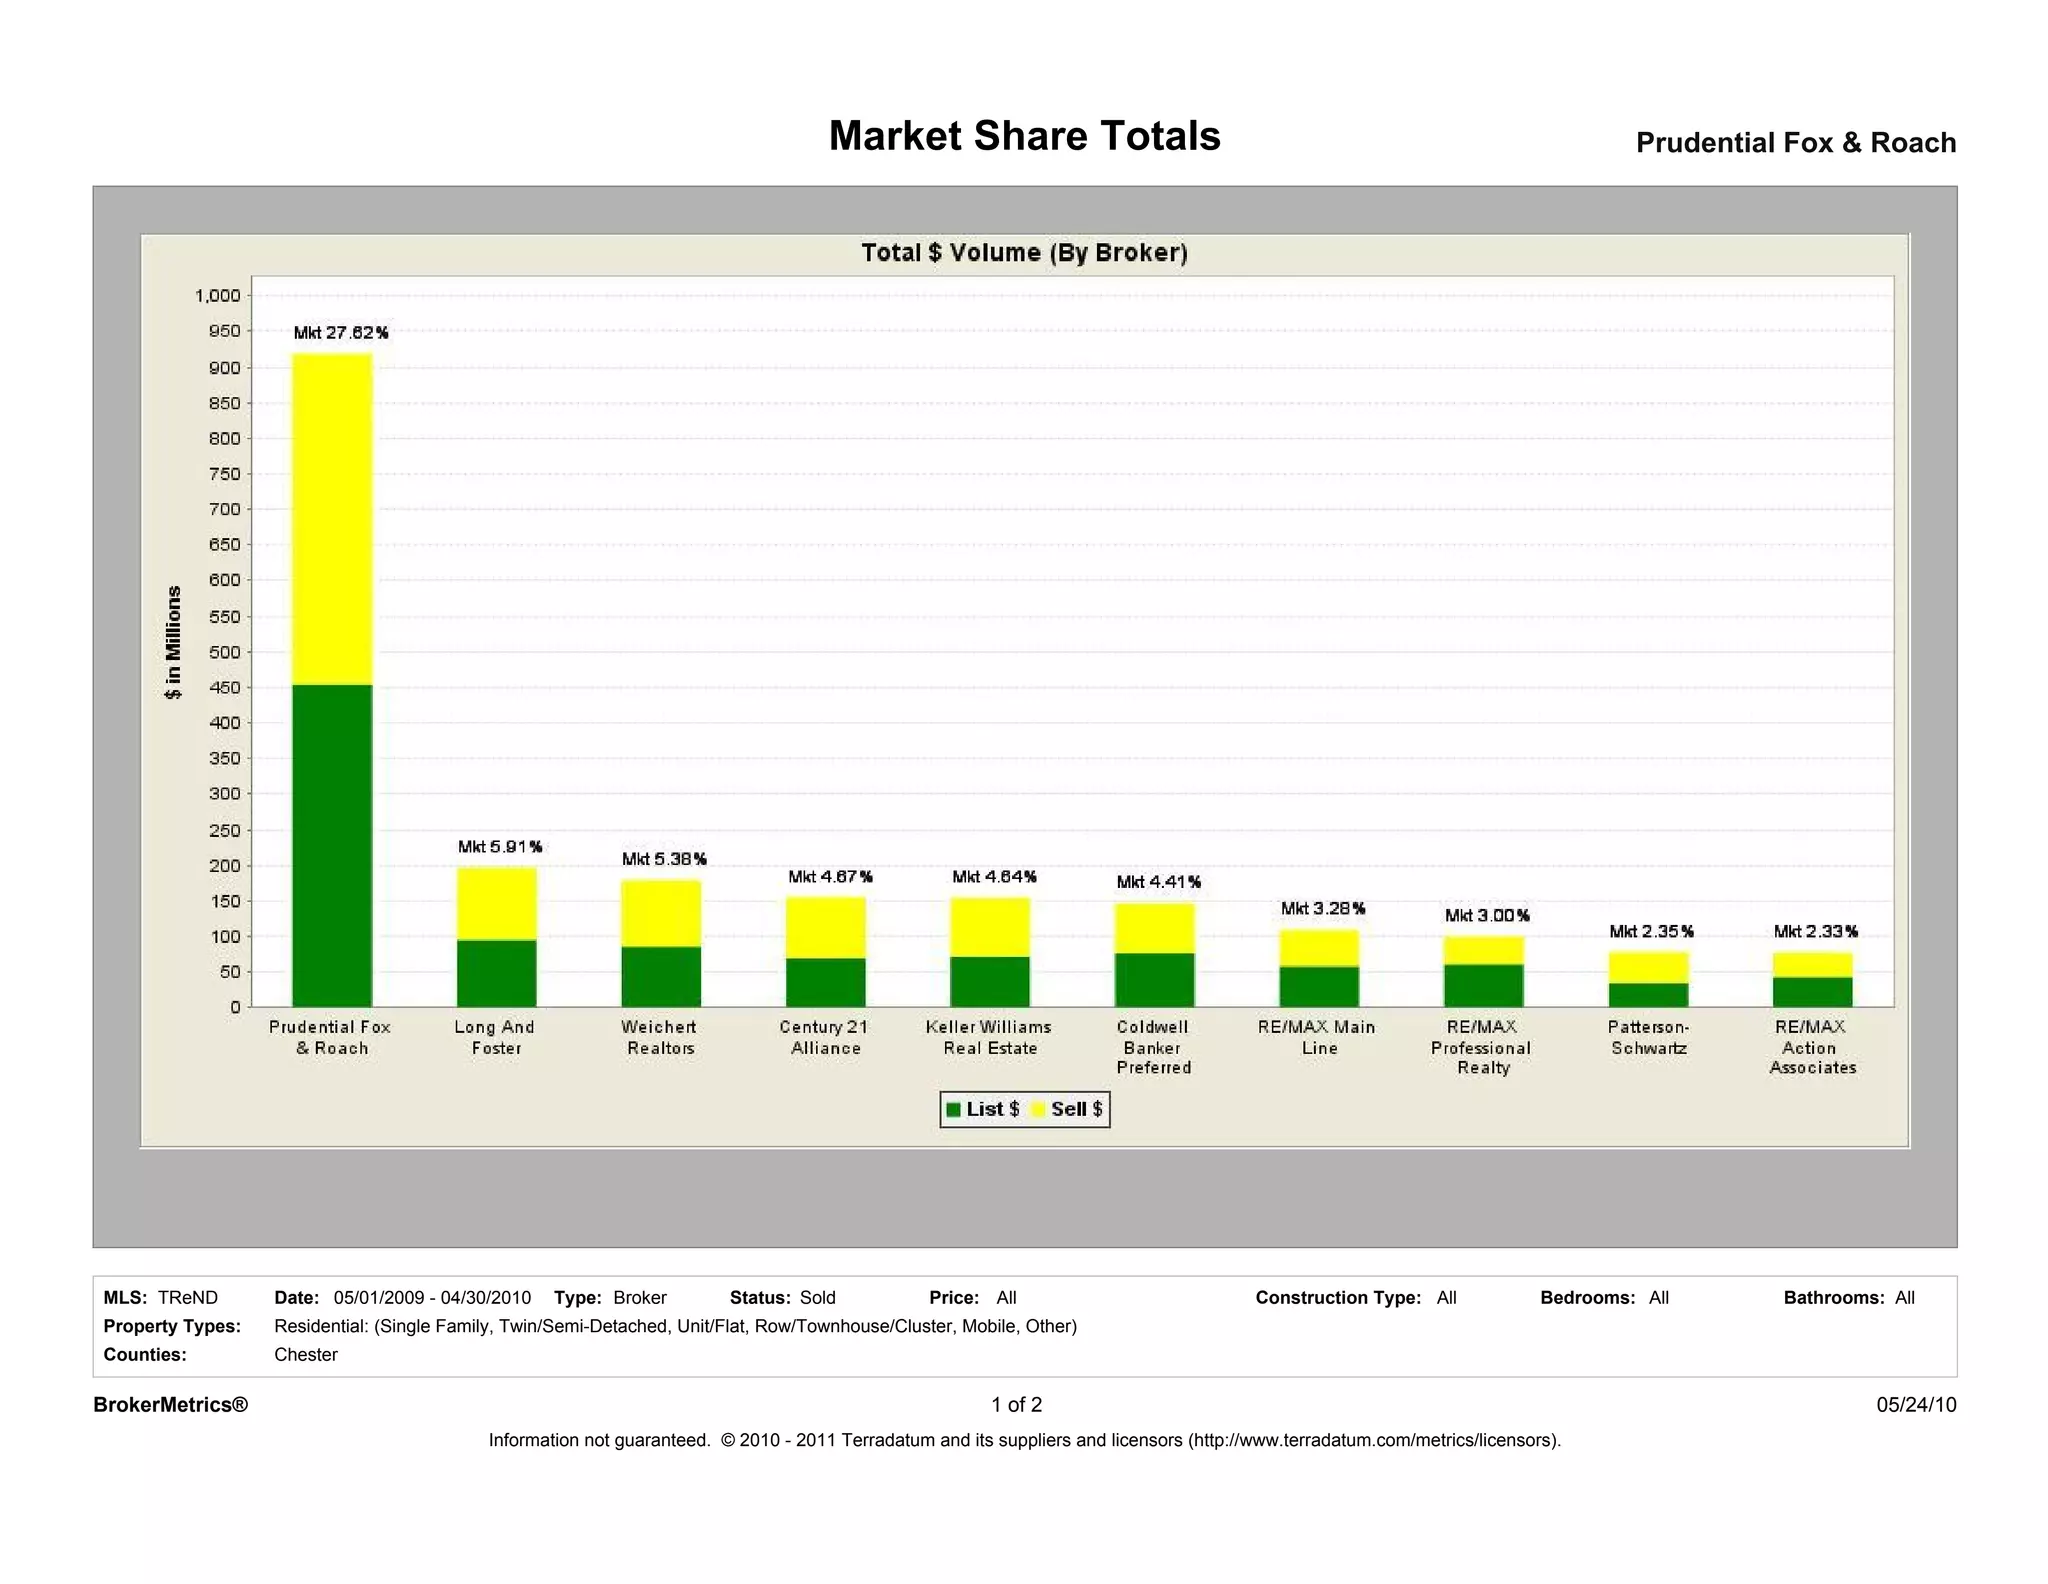


Prudential Fox & Roach had the largest market share of residential real estate sales in Chester County from May 2009 to April 2010, with 27.62% of the total sales volume. They sold 1,149 homes for a total of $464,043,220. Prudential Fox & Roach had 1,735 agents working across their 32 offices.


