1. Characterization of Osteoclast Precursors in the Mouse Periosteum
Monique Viet Mai1, Bhavita Walia2, and Archana Sanjay2
1UConn School of Medicine, Department of Health Career Opportunity Program
2Department of Orthopaedic Surgery, UConn Health, Farmington, CT
Introduction
Methods
Results
Cbl
Cbl
P p85 p110
p110p85
Acknowledgements
Cbl-PI3K Interaction
Objectives
Csf1rEGFP
DAPIMerge
Conclusion
WT-Csf1rEGFP YF-Csf1rEGFP
Future Directions
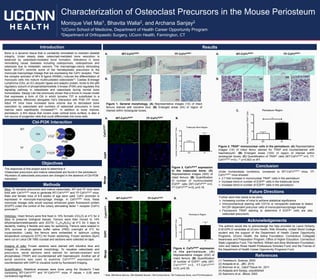
Figure 1. General morphology. (A) Representative images (1X) of intact
femurs stained with toluidine blue. (B) Enlarged areas (4X) of region of
interest within rectangular boxes.
WT-Csf1rEGFP YF-Csf1rEGFP WT-Csf1rEGFP YF-Csf1rEGFP
References
Figure 3. Csf1rEGFP expression
in the trabecular bone. (A)
Representative images (20X) of
intact femurs. (B) Quantification
of number of multinucleated
EGFP+ cells (WT-Csf1rEGFP n=3,
YT-Csf1rEGFP n=3); p=0.18.
Figure 4. Csf1rEGFP expression
i n t h e p e r i o s t e u m . ( A )
Representative images (20X) of
intact femurs. (B) Quantification
of number of EGFP+ cells (WT-
Csf1rEGFP n=3, YT-Csf1rEGFP
n=3); p=0.35.
Under homeostasis conditions, compared to WT-Csf1rEGFP+ mice, YF-
Csf1rEGFP+ mice showed:
Ø 2.7 fold increase in mononuclear TRAP+ cells in the periosteum
Ø Increase trend in number of EGFP+ cells in the trabecular bone
Ø Increase trend in number of EGFP+ cells in the periosteum
The authors would like to acknowledge the help provided by Laura Doherty,
D.M.D/Ph.D candidate at UConn Health; Ritik Shrestha, United World College
student and the support of the Department of Health Career Opportunity
Programs, UConn Health; the Aetna Foundation, Connecticut Collegiate
Awareness and Preparation Program, Office of Higher Education; Connecticut
State Legislative Fund; The Hartford; William and Alice Mortensen Foundation;
John and Valerie Rowe Health Professions Scholars Fund; and the Friends of
the Department of Health Career Opportunity Programs Fund.
(1) Tietelbaum, Science, 2000
(2) Adapala et al., JBC, 2010.
(3) Brennan et al., Calcif Tissue Int., 2011
(4) Adapala and Sanjay, unpublished
(5) Sasmono et al., Blood, 2003
WT-Csf1rEGFP YF-Csf1rEGFP
Csf1rEGFPDAPIMerge
Further work that needs to be done:
Ø Increasing number of mice to achieve statistical significance
Ø Immunochemical staining with CD11b or nonspecific esterase to detect
M-CSF-dependent precursor cells of monocyte/macrophage lineage
Ø Fluorescent TRAP staining to determine if EGFP+ cells are also
osteoclast precursors
Bone is a dynamic tissue that is constantly remodeled to maintain skeletal
integrity. Under steady state, osteoclast-mediated bone resorption is
balanced by osteoblast-mediated bone formation. Alterations in bone
remodeling cause diseases including osteoporosis, osteopetrosis and
osteolysis due to metastatic cancers. The macrophage-colony stimulating
factor (M-CSF) commits some of the hematopoietic precursors to the
monocyte-macrophage lineage that are expressing the Csf1r receptor. Then
the receptor activator of NFκ B ligand (RANKL) induces the differentiation of
monocytic cells into mature multinucleated osteoclasts(1). Casitas B-lineage
Lymphoma (Cbl), an E3 ubiquitin ligase and adaptor protein, binds to the p85
regulatory subunit of phosphatidylinositide 3-kinase (PI3K) and regulates this
signaling pathway in osteoblasts and osteoclasts during normal bone
homeostasis. Sanjay Lab has previously shown that a knock-in mouse model
that expresses a form of Cbl in which tyrosine 737 is substituted to a
phenylalanine, effectively abrogates Cbl’s interaction with PI3K (YF mice).
Adult YF mice have increased bone volume due to decreased bone
resorption by osteoclasts and numbers of osteoclast precursors in bone
marrow were significantly increased(2-4). In addition to bone marrow,
periosteum, a thin tissue that covers outer cortical bone surface, is also a
rich source of progenitor cells that could differentiate into bone cells.
The objectives of this project were to determine if:
• Osteoclast precursors and mature osteoclasts are found in the periosteum
• Numbers of osteoclasts precursors are changed in the absence of Cbl-PI3K
interaction
Mice: To visualize precursors and mature osteoclasts, WT and YF mice were
bred with Csf1rEGFP+ mice to generate WT-Csf1rEGFP and YF-Csf1rEGFP mice.
Male and female mice of 6-9 weeks of age were used. Csf1r promoter is
expressed in monocyte-macrophage lineage. In Csf1rEGFP mice, these
monocyte lineage cells would express enhanced green fluorescent protein
(EGFP) under the control of the colony stimulating factor 1 receptor (Csf1r)
promoter(5).
Histology: Intact femurs were first fixed in 10% formalin (CH2O) at 4°C for 4
days to preserve biological tissues. Femurs were then moved to 14%
ethylenediaminetetraacetic acid (EDTA, C10H16N2O8) at 4°C for 3 days to
decalcify, making it flexible and easy for sectioning. Femurs were soaked in
30% sucrose in phosphate buffer saline (PBS) overnight at 4°C for
cryoprotection. Lastly, the femurs were embedded in optimum cutting
temperature compound (OTC) for frozen sectioning. Frozen sections (9µm)
were cut on Leica CM 1950 cryostat and sections were collected on tape.
Imaging of cells: Frozen sections were stained with toluidine blue and
imaged to visualize general morphology. To visualize osteoclasts and
precursors, serial sections were stained for tartrate-resistant acid
phosphatase (TRAP) and counterstained with haematoxylin. Another set of
serial sections was used to examine Csf1rEGFP expression and
counterstained with DAPI to visualize nuclei by fluorescent imaging.
Quantification: Statistical analyses were done using the Student’s T-test
comparing WT-Csf1rEGFP and YF-Csf1rEGFP mice. P values < 0.05 were
considered significant.
WT
YF
Y737
Y737F
PI3K
PI3K
A. B.
A. B.
A. A.
C.
Figure 2. TRAP+ mononuclear cells in the periosteum. (A) Representative
images (1X) of intact femur stained for TRAP and counterstained with
haematoxylin. (B) Enlarged areas (10X) of region of interest within
rectangular boxes. (C) Quantification of TRAP+ cells (WT-Csf1rEGFP n=3, YT-
Csf1rEGFP n=3) ; ** p<0.003 vs WT.
TB TB
BM BM
BM BMSM SM
PO PO
CBCB
B. B.
* Note: BM=Bone Marrow, SM=Skeletal Muscle, CB=Cortical Bone, TB=Trabecular Bone, and PO=Periosteum
NumberofMultinucleatedEGFP+Cells
NumberofmononuclearTRAP+Cells