2. phases of ethanol near their respective glass transitions. We
find that the dielectric relaxation in both the supercooled-
liquid ͑SCL͒ and RP crystal is nonexponential, and that pa-
rameters characterizing the relaxation ͑e.g., degree of non-
Debyeness and average relaxation time͒ can be approximated
using a Cole-Davison9
fitting function. For a given tempera-
ture, comparison of the dielectric response in each phase
indicates a steeper temperature dependence of the average
relaxation time in the SCL relative to that of the RP crystal,
and the relaxation times of both phases are nearly equal at
Tϭ96 K.
Preparing ethanol in the supercooled-liquid and rotator-
crystal phase follows an established protocol.6
Rapid cooling
of the liquid at a rate greater than 6 K/min bypasses crystal-
lization at TMϭ159 K,10
and allows entry into the
supercooled-liquid regime. Continuing to cool at the pre-
scribed rate leads to the structural-glass transition at Tg
ϭ97 K. The RP crystal ͑body-centered-cubic, lattice con-
stant aϭ5.37 Å͒ is then formed by warming and annealing
in the temperature range 102–110 K. The exact temperature
and annealing time required for conversion to the RP crystal
depends on the warming rate, as well as the initial cooling
rate into the glassy state.5
Measurement of the frequency- and temperature-
dependent complex dielectric susceptibility was carried out
using a sealed coaxial capacitor identical in design to that
used in our previous work.3
Two different measurement
schemes were employed depending on the frequency range
under consideration. In the range 1 mHz to 10 kHz, the in-
phase and out-of-phase currents through the capacitor were
measured using a Stanford SR850 Dual Phase Lock-in Am-
plifier in conjunction with a Stanford SR570 Current-to-
Voltage Amplifier. For frequencies of 1 kHz to 10 MHz, a
Hewlett-Packard 4192A Impedance Analyzer was used in a
standard four-terminal pair configuration to measure the ca-
pacitance and conductance of the sample. Data obtained
from the two methods are in excellent agreement where they
overlap.
Sample material consisted of 200-proof, dehydrated ethyl
alcohol ͑ethanol͒ obtained from Quantum Chemical Com-
pany of Tuscola, Illinois. To avoid contamination with water
vapor, filling of the capacitor was carried out at room tem-
perature in a dry-nitrogen atmosphere. The sample cell was
then frozen, evacuated of remaining nitrogen gas, and sealed.
The sample cell was then mounted inside a nested cryocan
arrangement described elsewhere.3
Finally, the entire cryo-
can assembly was immersed in a double-walled glass Dewar.
This design provided control of the sample temperature to
within 0.05 K over the range 4–300 K, and minimized the
occurrence of temperature gradients across the sample.
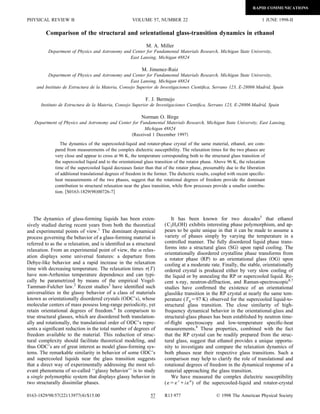
Figures 1͑a͒ and 1͑b͒ show our data for the real (Ј) and
imaginary (Љ) parts of the dielectric susceptibility for the
supercooled liquid as a function of frequency for tempera-
tures of 96, 98, and 100 K. Figures 2͑a͒ and 2͑b͒ show the
corresponding data taken in the RP crystal at temperatures of
96, 98, 100, 102, 104, 106, 108, and 110 K. Although the
glass-transition temperature is usually quoted as Tgϭ97 K,
we emphasize that all our data are taken in the metastable
equilibrium SCL and RP, respectively. The data at 96 K, in
particular, were observed not to change over more than 1 h,
indicating that no structural relaxation was taking place. Ob-
taining data over a broad temperature range in the SCL phase
was hindered by the fact that time-dependent transitions to
the RP crystal occur above 102 K. Thus, in order to broaden
the range of liquid-phase data, additional measurements were
FIG. 1. ͑a͒ Ј and ͑b͒ Љ vs frequency for temperatures of 96
͑᭹͒, 98 ͑᭡͒, and 100 K ͑͒ in the supercooled-liquid phase of
ethanol. Solid lines are fits to the Cole-Davidson function.
FIG. 2. ͑a͒ Ј and ͑b͒ Љ vs frequency for temperatures of 96
͑᭹͒, 98 ͑͒, 100 ͑᭢͒, 102 ͑᭝͒, 104 ͑छ͒, 106 ͑᭡͒, 108 ͑ᮀ͒, and
110 K ͑ࡗ͒ in the rotator-crystal phase of ethanol. Solid lines are fits
to the Cole-Davidson function.
RAPID COMMUNICATIONS
R13 978 57MILLER, JIMENEZ-RUIZ, BERMEJO, AND BIRGE
3. made in the temperature range 164–181 K. Figures 3͑a͒ and
3͑b͒ show the high-temperature liquid-phase data, where the
contribution of dc conductivity to the response at low fre-
quencies is readily apparent.
The solid lines passing through the data in Figs. 1–3 are
fits to the Cole-Davidson fitting form9
given by
͑͒ϭϱϩ͑0Ϫϱ͒/͑1Ϫi/p
CD
͒␣
, ͑1͒
where ϭ2f. It is well known that fitting relaxation data
with empirical forms such as the Cole-Davidson or
Kohlraush-Williams-Watts function11
does not accurately
describe the relaxation at all frequencies. In particular, at
frequencies higher than two decades or so above the peak,
the data typically obey a shallow power-law dependence ex-
tending to very high frequency.12,13
Nevertheless, the Cole-
Davidson form can be used in the main peak region to pro-
vide estimates of parameters characterizing the dynamical
response such as the mean relaxation time (Ϸ1/p
CD
), and
␣, the degree of departure from a Debye-governed relaxation
process (␣ϭ1).
Figure 4 shows the temperature dependence of the width
parameter ␣ for both the SCL and RP crystal. Both phases
display a characteristic feature common to many glass-
forming materials, namely, a decrease of ␣ with temperature
indicating deviation from idealized Debye behavior.1
Figures
1 and 2 show that the rotational contribution to the static
susceptibility, 0Ϫϱ , is similar in the two phases, indicat-
ing that the molecules undergo complete rotation in the SCL
as they do in the RP crystal. A surprising feature of the data
in Figs. 1 and 2 is the decrease in 0Ϫϱ at low temperature.
This cannot be due to partial crystallization of the sample
during the measurement because the data in Fig. 1 were
taken on warming from the SG, and the data in Fig. 2 were
verified to be reproducible on warming from the OG.
Figure 5 shows the temperature dependence of the mean
relaxation time in both the RP crystal and SCL phases. The
solid lines are fits to the Vogel-Tamman-Fulcher ͑VTF͒
equation2
given by
ϭ0 exp͓A/͑TϪT0͔͒. ͑2͒
Here, 0 is an attempt time and T0 is the Vogel temperature
at which the relaxation time diverges. Results of the VTF
FIG. 3. ͑a͒ Ј and ͑b͒ Љ vs frequency for temperatures of 164
͑छ͒, 173 ͑᭹͒, and 181 K ͑᭡͒ in the liquid phase of ethanol. Solid
lines are fits to the Cole-Davidson function plus a term of the form
dc / in Љ due to dc conductivity.
FIG. 4. Plot of the Cole-Davidson exponent ␣ vs temperature
for both the supercooled-liquid ͑᭡͒ and rotator-crystal ͑᭹͒ phases.
Both phases exhibit increasingly non-Debye behavior as the glass
transition is approached, a common characteristic of many glass-
forming materials.
FIG. 5. The mean relaxation time vs inverse temperature for
the liquid and supercooled-liquid ͑᭡͒ and rotator-crystal ͑᭹͒ phases
of ethanol. The relaxation times cross at 96 K, near the glass-
transition temperature.
RAPID COMMUNICATIONS
57 R13 979COMPARISON OF THE STRUCTURAL AND . . .
4. fitting for each phase are listed in Table I. The mean relax-
ation times in the two phases are nearly equal at Tϭ96 K,
and display a temperature-dependent shift toward a longer
average relaxation time in the RP crystal phase relative to the
SCL with increasing temperature. This manifests itself ex-
perimentally as a pronounced shift of the RP crystal relax-
ation peak toward lower frequency relative to the relaxation
peak in the SCL at the same temperature. This behavior can
be explained by considering the degrees of freedom available
to the material in passing through the glass transition in each
phase. The OG→RP transition involves the liberation of
purely rotational degrees of freedom, while the SG→SCL
transition involves liberation of both rotational and transla-
tional degrees of freedom. As the temperature increases
above 96 K, the additional translational freedom present in
the SCL provides the constituent molecules with a less re-
strictive local environment, leading to increasingly shorter
relaxation times in the SCL relative to the RP crystal for a
given temperature. Recent specific-heat measurements5,14
performed on both the SCL and RP crystal near their respec-
tive glass transitions support this argument: the OG→RP
crystal transition involves an increase of about
22 J molϪ1
KϪ1
and the SG→SCL transition involves an in-
crease in the specific heat of approximately 31 J molϪ1
KϪ1
.
Presumably the extra 9 J molϪ1
KϪ1
in the SCL specific heat
not present in the RP crystal corresponds to translational
degrees of freedom. These results suggest that the rotational
degrees of freedom are the dominant contributor to structural
relaxation processes near the glass transition in both the RP
crystal and SCL, and that flow processes such as mass dif-
fusion associated with translational degrees of freedom in the
SCL contribute to a lesser extent.
In conclusion, we have used dielectric spectroscopy to
compare the dynamical response of the SCL and RP crystal
phases of ethanol. We find that the orientational-glass tran-
sition in RP crystal exhibits all the characteristics observed
in the structural-glass transition: an increasingly non-Debye
relaxation and faster-than-Arrhenius behavior in the relax-
ation time as the glass transition is approached. Comparison
of the relaxation time behavior above 96 K displays the ef-
fect of the additional translational freedom available to the
liquid resulting in faster molecular reorientation in the SCL
relative to the RP crystal for a given temperature. The dielec-
tric data indicate that rotational motion is the dominant dy-
namical process governing the glass transition in both SCL
and RP crystal ethanol. Thus, the construction of a minimal
model utilizing restricted degrees of freedom now appears
relevant to the behavior of real materials. A model such as
that explored by Renner, Lowen, and Barrat15
involving hard
needles on an fcc lattice, should be simple enough to allow a
detailed numerical and analytical treatment.
We are grateful to S. R. Nagel and D. L. Price for their
role in establishing this collaboration. F.J.B. and M.J.R. ac-
knowledge support from DGICYT Grant ͑Spain͒ No. PB95-
0075-C03-01.
1
M. D. Ediger, C. A. Angell, and S. R. Nagel, J. Phys. Chem. 100,
13 200 ͑1996͒.
2
H. Vogel, Z. Phys. 22, 645 ͑1921͒; G. S. Fulcher, J. Am. Ceram.
Soc. 8, 339 ͑1925͒; G. Tamman and W. Hesse, Z. Anorg. Allg.
Chem. 156, 245 ͑1926͒.
3
D. L. Leslie-Pelecky and N. O. Birge, Phys. Rev. Lett. 72, 1232
͑1994͒; Phys. Rev. B 50, 13 250 ͑1994͒.
4
J. N. Sherwoord, The Plastically Crystalline State
(Orientationally-Disordered Crystals) ͑Wiley, New York,
1979͒.
5
O. Haida, H. Suga, and S. Seki, J. Chem. Thermodyn. 9, 1133
͑1977͒.
6
A. Srinivasan, F. J. Bermejo, A. de Andres, J. Dawidowski, J.
Zuniga, and A. Criado, Phys. Rev. B 53, 8172 ͑1996͒.
7
R. Fayos, F. J. Bermejo, J. Dawidowski, H. E. Fischer, and M. A.
Gonzalez, Phys. Rev. Lett. 77, 3823 ͑1996͒.
8
M. A. Ramos, S. Vieira, F. J. Bermejo, J. Dawidowski, H. E.
Fischer, H. Schober, M. A. Gonzalez, C. K. Loong, and D. L.
Price, Phys. Rev. Lett. 78, 82 ͑1997͒.
9
D. W. Davidson and R. H. Cole, J. Chem. Phys. 18, 1417 ͑1951͒.
10
A typographical error in Ref. 5 giving Tm as 169 K has been
propagated in some papers, e.g., Refs. 6 and 7.
11
G. Williams and D. C. Watts, Trans. Faraday Soc. 66, 80 ͑1970͒.
12
P. K. Dixon, L. Wu, S. R. Nagel, B. D. Williams, and J. P. Carini,
Phys. Rev. Lett. 65, 1108 ͑1990͒.
13
R. Brand, P. Lunkenheimer, and A. Loidl, Phys. Rev. B 56, 5713
͑1997͒.
14
F. J. Bermejo, A. Criado, R. Fayos, R. Fernandez-Perea, H. E.
Fischer, E. Suard, A. Guelylah, and J. Zuniga, Phys. Rev. B 56,
11 536 ͑1997͒; F. J. Bermejo, H. E. Fischer, M. A. Ramos, A. de
Andres, J. Davidowski, and R. Fayos, in Complex Behaviour of
Glassy Systems, edited by M. Rubi et al., Springer Lecture
Notes in Physics Vol. 492 ͑Springer-Verlag, Berlin, 1997͒, p.
44.
15
C. Renner, H. Lowen, and J. L. Barrat, Phys. Rev. E 52, 5091
͑1995͒.
TABLE I. VTF fit parameters of the mean relaxation time in the
RP crystal and SCL phases of ethanol.
Parameter A T0 0
SCL 596 75.6 6.8ϫ10Ϫ11
RP crystal 529 73.5 2.6ϫ 10Ϫ8
RAPID COMMUNICATIONS
R13 980 57MILLER, JIMENEZ-RUIZ, BERMEJO, AND BIRGE