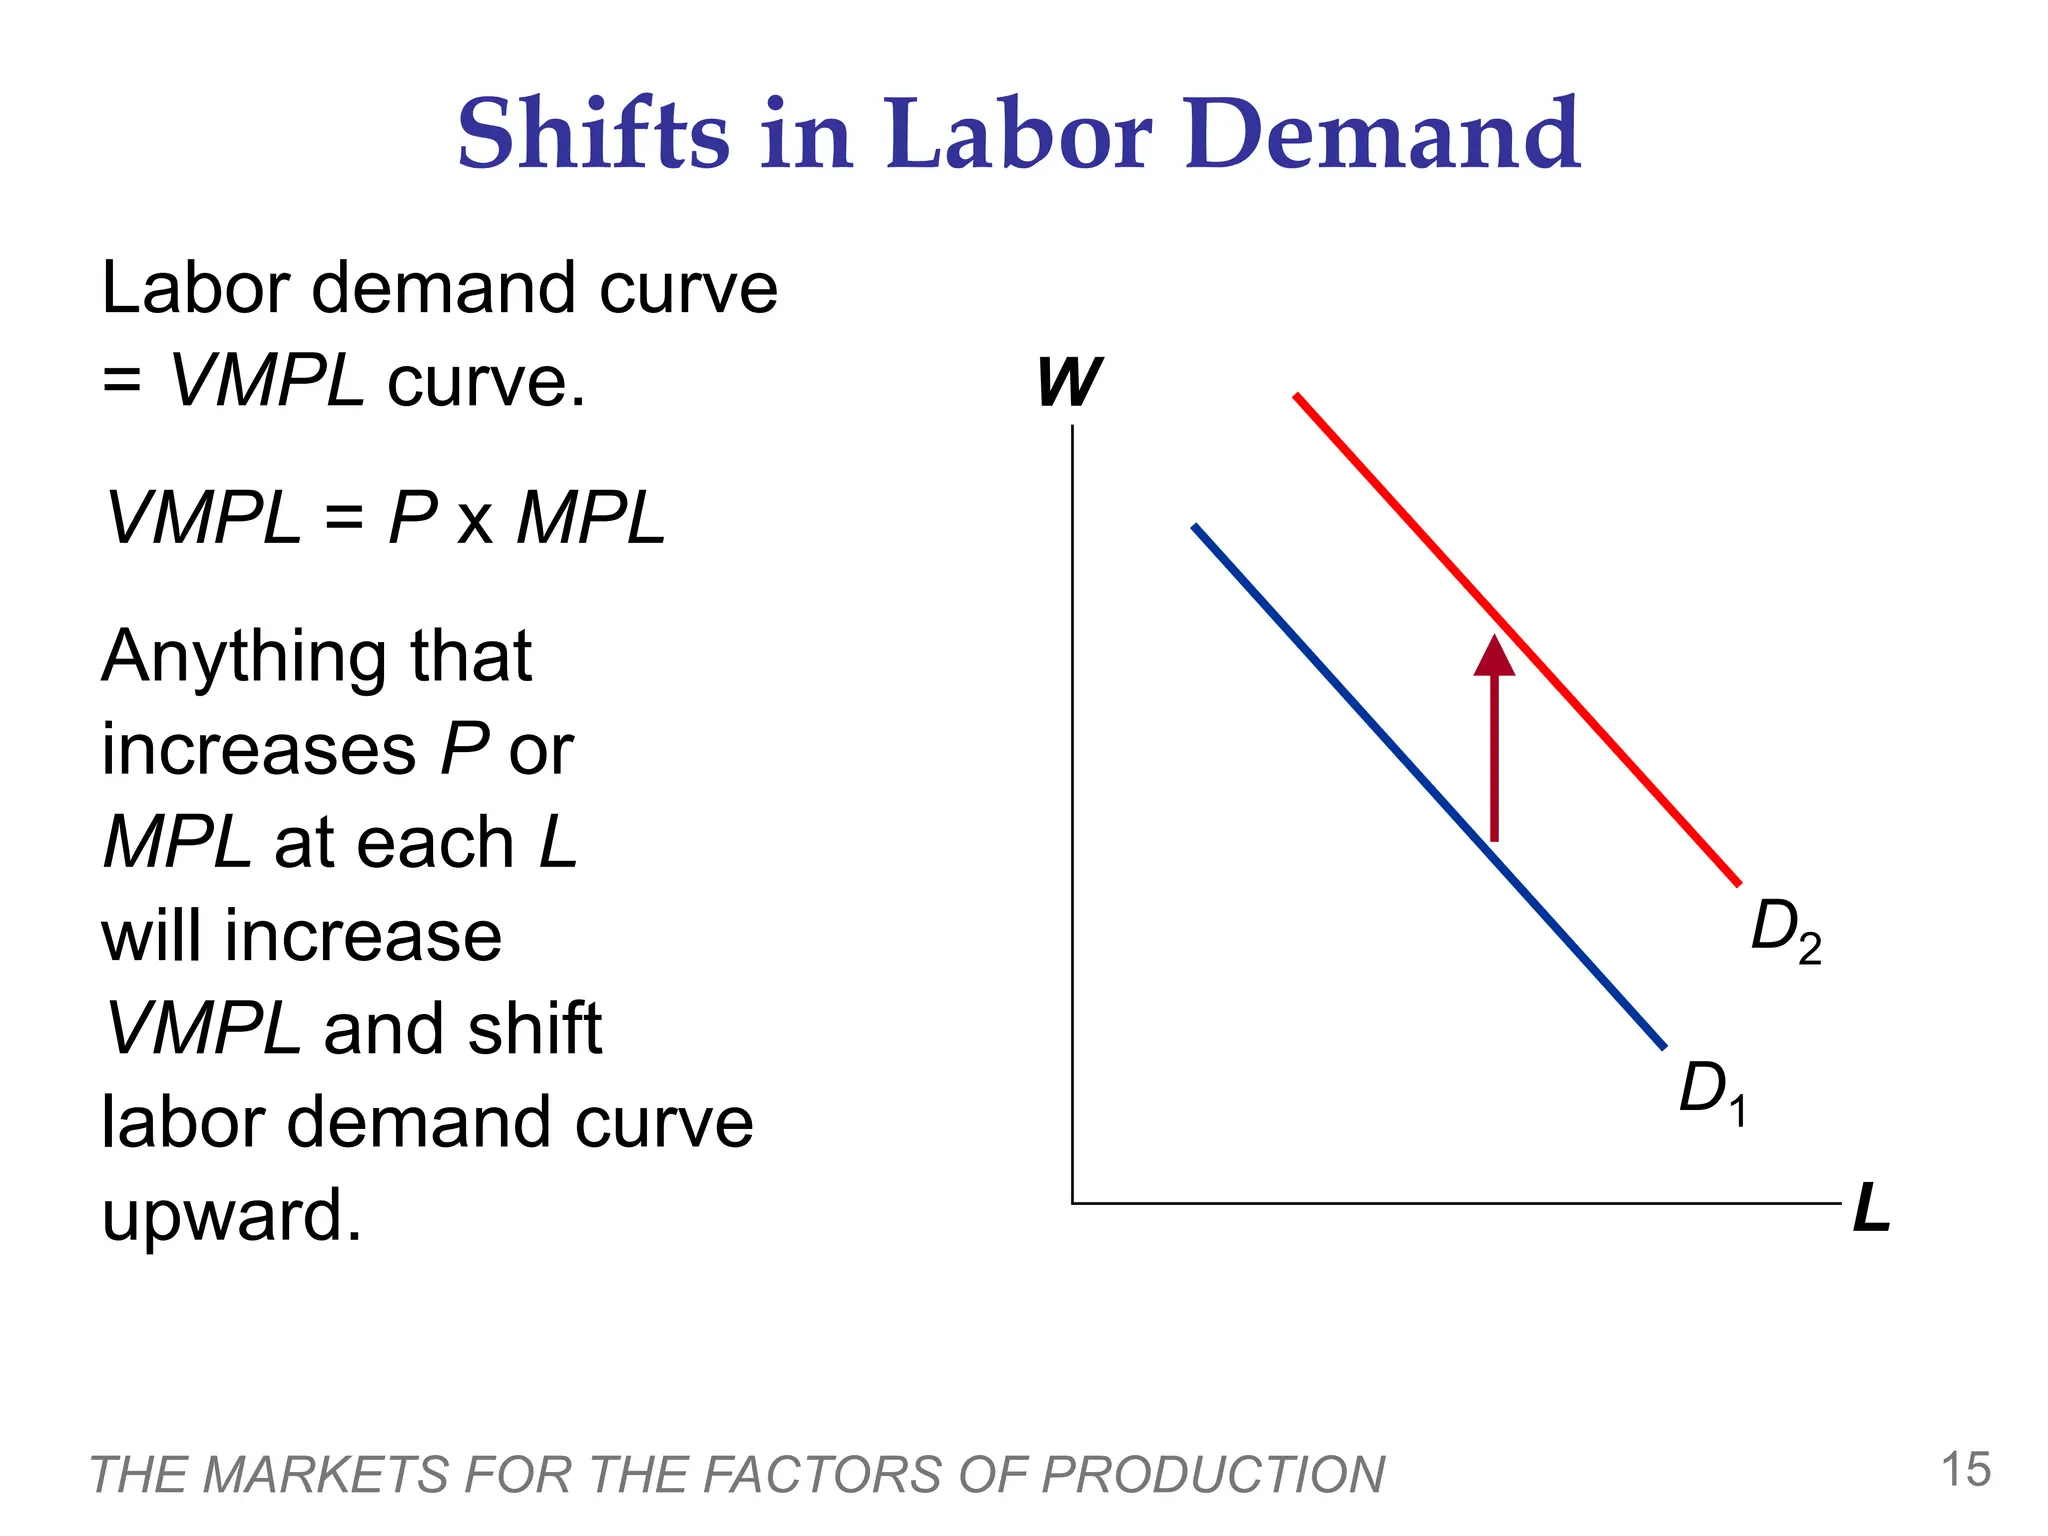
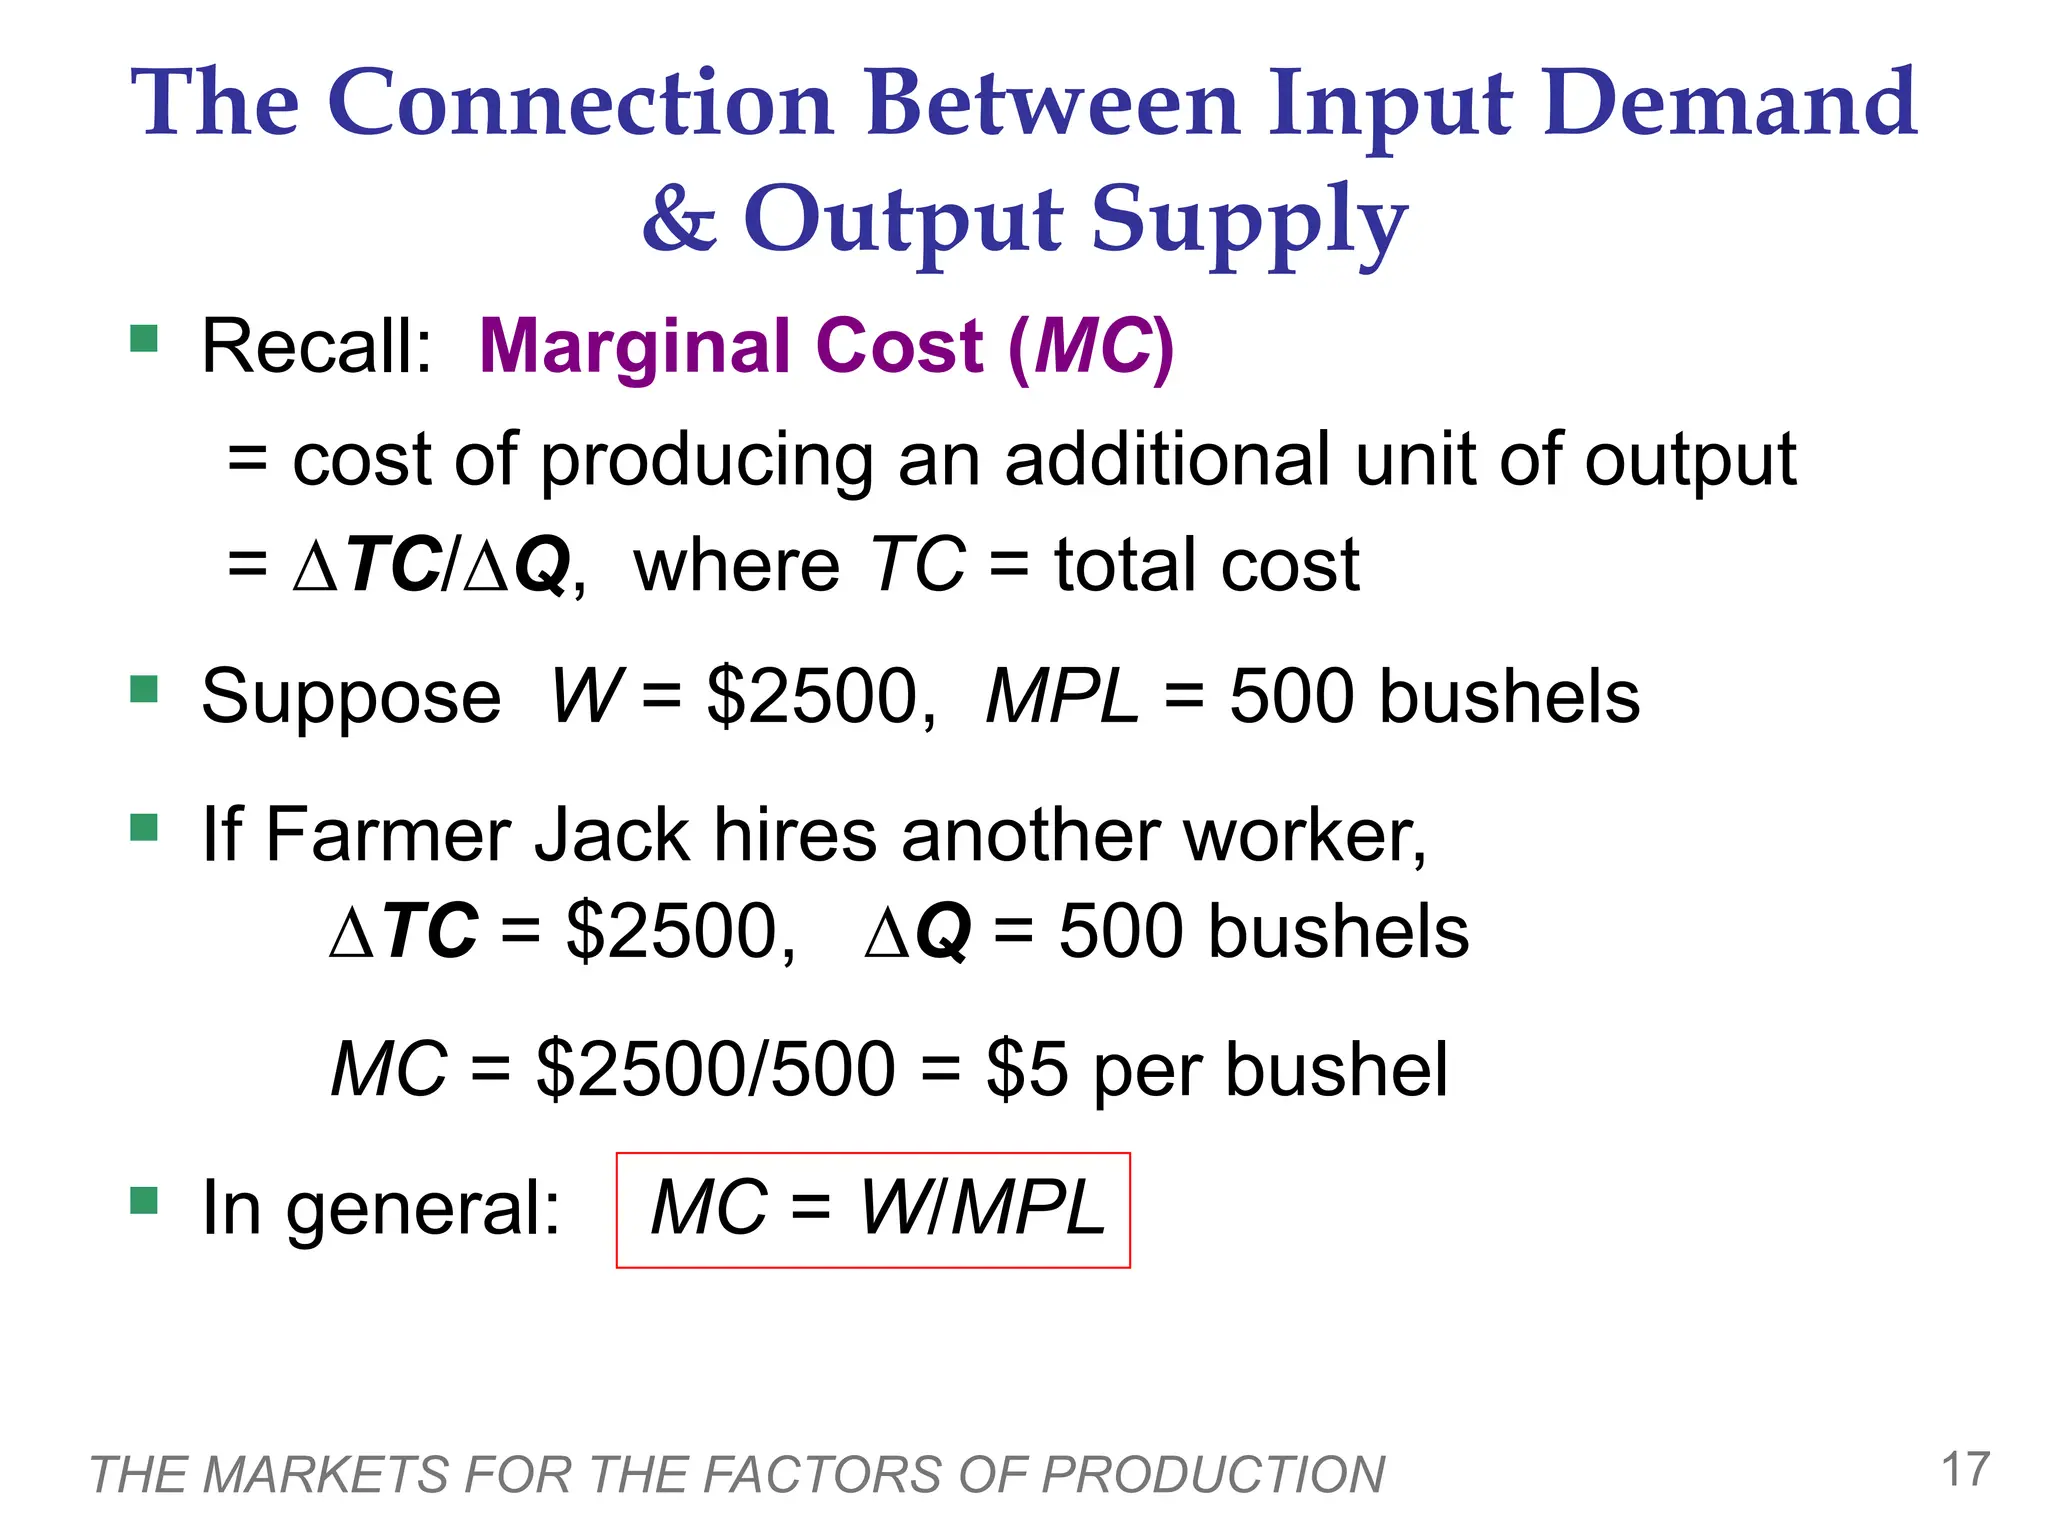
© 2009 South-Western, a part of Cengage Learning, all rights reserved
C H A P T E R
The Markets for the
Factors of Production
Economics
P R I N C I P L E S O F
N. Gregory Mankiw
Premium PowerPoint Slides
by Ron Cronovich
18
In this chapter,
look for the answers to these questions:
 What determines a competitive firm’s demand for
labor?
 How does labor supply depend on the wage?
What other factors affect labor supply?
 How do various events affect the equilibrium wage
and employment of labor?
 How are the equilibrium prices and quantities of
other inputs determined?
1
THE MARKETS FOR THE FACTORS OF PRODUCTION 2
Factors of Production and Factor Markets
 Factors of production: the inputs used to
produce goods and services.
 Labor
 Land
 Capital: the equipment and structures used
to produce goods and services.
 Prices and quantities of these inputs are
determined by supply & demand in factor
markets.
THE MARKETS FOR THE FACTORS OF PRODUCTION 3
Derived Demand
 Markets for the factors of production are like
markets for goods & services, except:
 Demand for a factor of production is a derived
demand – derived from a firm’s decision to
supply a good in another market.
THE MARKETS FOR THE FACTORS OF PRODUCTION 4
Two Assumptions
1. We assume all markets are competitive.
The typical firm is a price taker
 in the market for the product it produces
 in the labor market
2. We assume that firms care only about
maximizing profits.
 Each firm’s supply of output and demand for
inputs are derived from this goal.
THE MARKETS FOR THE FACTORS OF PRODUCTION 5
Our Example: Farmer Jack
 Farmer Jack sells wheat in a perfectly
competitive market.
 He hires workers in a perfectly competitive labor
market.
 When deciding how many workers to hire,
Farmer Jack maximizes profits by
thinking at the margin:
 If the benefit from hiring another worker exceeds
the cost, Jack will hire that worker.
THE MARKETS FOR THE FACTORS OF PRODUCTION 6
Our Example: Farmer Jack
 Cost of hiring another worker:
the wage – the price of labor
 Benefit of hiring another worker:
Jack can produce more wheat to sell,
increasing his revenue.
 The size of this benefit depends on Jack’s
production function: the relationship between
the quantity of inputs used to make a good and
the quantity of output of that good.
THE MARKETS FOR THE FACTORS OF PRODUCTION 7
0
500
1,000
1,500
2,000
2,500
3,000
0 1 2 3 4 5
No. of workers
Quantity
of
output
Farmer Jack’s Production Function
3000
5
2800
4
2400
3
1800
2
1000
1
0
0
Q
(bushels
of wheat
per week)
L
(no. of
workers)
THE MARKETS FOR THE FACTORS OF PRODUCTION 8
Marginal Product of Labor (MPL)
 Marginal product of labor: the increase in the
amount of output from an additional unit of labor
where
∆Q = change in output
∆L = change in labor
∆Q
∆L
MPL =
THE MARKETS FOR THE FACTORS OF PRODUCTION 9
The Value of the Marginal Product
 Problem:
 Cost of hiring another worker (wage) is
measured in dollars
 Benefit of hiring another worker (MPL) is
measured in units of output
 Solution: convert MPL to dollars
 Value of the marginal product: the marginal
product of an input times the price of the output
VMPL = value of the marginal product of labor
= P x MPL
A C T I V E L E A R N I N G 1
Computing MPL and VMPL
10
P = $5/bushel.
Find MPL
and VMPL,
fill them in the
blank spaces
of the table.
Then graph
a curve with
VMPL on the
vertical axis,
L on horiz axis.
3000
5
2800
4
2400
3
1800
2
1000
1
0
0
VMPL
MPL
Q
(bushels
of wheat)
L
(no. of
workers)
A C T I V E L E A R N I N G 1
Answers
11
Farmer Jack’s
production
function
exhibits
diminishing
marginal
product:
MPL falls as
L increases.
This property is
very common.
3000
5
2800
4
2400
3
1800
2
1000
1
0
0
VMPL =
P x MPL
MPL =
∆Q/∆L
Q
(bushels
of wheat)
L
(no. of
workers)
1,000
200
2,000
400
3,000
600
4,000
800
$5,000
1000
A C T I V E L E A R N I N G 1
Answers
12
Farmer Jack’s
VMPL curve is
downward
sloping
due to
diminishing
marginal
product.
L (number of workers)
The VMPL curve
0
1,000
2,000
3,000
4,000
5,000
$6,000
0 1 2 3 4 5
THE MARKETS FOR THE FACTORS OF PRODUCTION 13
At any larger L,
can increase profit
by hiring one
fewer worker.
Farmer Jack’s Labor Demand
Suppose wage
W = $2500/week.
How many
workers should
Jack hire?
Answer: L = 3
L (number of workers)
The VMPL curve
0
1,000
2,000
3,000
4,000
5,000
$6,000
0 1 2 3 4 5
$2,500
At any smaller L,
can increase profit
by hiring another
worker.
THE MARKETS FOR THE FACTORS OF PRODUCTION 14
VMPL and Labor Demand
For any competitive,
profit-maximizing firm:
 To maximize profits,
hire workers up to
the point where
VMPL = W.
 The VMPL curve is
the labor demand
curve.
W
L
VMPL
W1
L1
THE MARKETS FOR THE FACTORS OF PRODUCTION 15
Shifts in Labor Demand
Labor demand curve
= VMPL curve.
VMPL = P x MPL
Anything that
increases P or
MPL at each L
will increase
VMPL and shift
labor demand curve
upward.
W
L
D1
D2
THE MARKETS FOR THE FACTORS OF PRODUCTION 16
Things that Shift the Labor Demand Curve
 Changes in the output price, P
 Technological change (affects MPL)
 The supply of other factors (affects MPL)
 Example:
If firm gets more equipment (capital),
then workers will be more productive;
MPL and VMPL rise, labor demand shifts
upward.
THE MARKETS FOR THE FACTORS OF PRODUCTION 17
The Connection Between Input Demand
& Output Supply
 Recall: Marginal Cost (MC)
= cost of producing an additional unit of output
= ∆TC/∆Q, where TC = total cost
 Suppose W = $2500, MPL = 500 bushels
 If Farmer Jack hires another worker,
∆TC = $2500, ∆Q = 500 bushels
MC = $2500/500 = $5 per bushel
 In general: MC = W/MPL
THE MARKETS FOR THE FACTORS OF PRODUCTION 18
The Connection Between Input Demand
& Output Supply
 In general: MC = W/MPL
 Notice:
 To produce additional output, hire more labor.
 As L rises, MPL falls…
 causing W/MPL to rise…
 causing MC to rise.
 Hence, diminishing marginal product and
increasing marginal cost are two sides
of the same coin.
THE MARKETS FOR THE FACTORS OF PRODUCTION 19
The Connection Between Input Demand
& Output Supply
 The competitive firm’s rule for demanding labor:
P x MPL = W
 Divide both sides by MPL:
P = W/MPL
 Substitute MC = W/MPL from previous slide:
P = MC
 This is the competitive firm’s rule for supplying
output.
 Hence, input demand and output supply are two
sides of the same coin.
THE MARKETS FOR THE FACTORS OF PRODUCTION 20
Labor Supply
 Trade-off between work and leisure:
The more time you spend working,
the less time you have for leisure.
 The opportunity cost of leisure is the wage.
THE MARKETS FOR THE FACTORS OF PRODUCTION 21
The Labor Supply Curve
An increase in W
is an increase in the
opp. cost of leisure.
People respond by
taking less leisure
and by working more.
W
L
S1
W1
L1
W2
L2
THE MARKETS FOR THE FACTORS OF PRODUCTION 22
Things that Shift the Labor Supply Curve
 Changes in tastes or attitudes regarding the
labor-leisure trade-off
 Opportunities for workers in other labor markets
 Immigration
THE MARKETS FOR THE FACTORS OF PRODUCTION 23
Equilibrium in the Labor Market
The wage adjusts to
balance supply and
demand for labor.
The wage always
equals VMPL.
W
L
D
S
W1
L1
In each of the following scenarios, use a diagram of
the market for (domestic) auto workers to find the
effects on their wage and employment.
A. Baby Boomers who worked in the auto industry
retire.
B. Car buyers’ preferences shift toward imported
autos.
C. Technological progress boosts productivity
in the auto manufacturing industry.
A C T I V E L E A R N I N G 2
Changes in labor-market equilibrium
24
A C T I V E L E A R N I N G 2
Answers to A
25
The retirement of
Baby Boomer auto
workers shifts
supply leftward.
W rises, L falls.
W
L
D1
S1
W1
L1
S2
W2
L2
The market for
autoworkers
A C T I V E L E A R N I N G 2
Answers to B
26
A fall in the demand
for U.S. autos
reduces P.
At each L,
VMPL falls.
Labor demand
curve shifts down.
W and L both fall.
W
L
D1
S1
W1
L1
D2
W2
L2
The market for
autoworkers
A C T I V E L E A R N I N G 2
Answers to C
27
At each L,
MPL rises due to
tech. progress.
VMPL rises and
labor demand curve
shifts upward.
W and L increase.
W
L
D1
S1
W1
L1
D2
W2
L2
The market for
autoworkers
THE MARKETS FOR THE FACTORS OF PRODUCTION 28
Productivity and Wage Growth in the U.S.
Recall one of the
Ten Principles:
A country’s
standard of living
depends on its
ability to produce g&s.
Our theory implies wages
tied to labor productivity
(W = VMPL).
We see this in the data.
2.5
2.6
1995-2006
1.2
1.4
1973-1995
2.8
2.8
1959-1973
2.0%
2.1%
1959-2006
growth
rate
of real
wages
growth
rate of
produc-
tivity
time
period
THE MARKETS FOR THE FACTORS OF PRODUCTION 29
The Other Factors of Production
 With land and capital, must distinguish between:
 purchase price – the price a person pays to
own that factor indefinitely
 rental price – the price a person pays to use
that factor for a limited period of time
 The wage is the rental price of labor.
 The determination of the rental prices of
capital and land is analogous to the
determination of wages…
THE MARKETS FOR THE FACTORS OF PRODUCTION 30
How the Rental Price of Land Is Determined
Firms decide how
much land to rent
by comparing the
price with the
value of the
marginal product
(VMP) of land.
The rental price of
land adjusts to
balance supply and
demand for land.
P
Q
D = VMP
S
P
Q
The market
for land
THE MARKETS FOR THE FACTORS OF PRODUCTION 31
How the Rental Price of Capital Is Determined
Firms decide how
much capital to rent
by comparing the
price with the
value of the
marginal product
(VMP) of capital.
The rental price of
capital adjusts to
balance supply and
demand for capital.
P
Q
D = VMP
S
P
Q
The market
for capital
THE MARKETS FOR THE FACTORS OF PRODUCTION 32
Rental and Purchase Prices
 Buying a unit of capital or land yields a stream of
rental income.
 The rental income in any period equals the value
of the marginal product (VMP).
 Hence, the equilibrium purchase price of a factor
depends on both the current VMP and the VMP
expected to prevail in future periods.
THE MARKETS FOR THE FACTORS OF PRODUCTION 33
Linkages Among the Factors of Production
 In most cases, factors of production are used
together in a way that makes each factor’s
productivity dependent on the quantities of the
other factors.
 Example: an increase in the quantity of capital
 The marginal product and rental price of capital
fall.
 Having more capital makes workers more
productive, MPL and W rise.
THE MARKETS FOR THE FACTORS OF PRODUCTION 34
CONCLUSION
 The theory in this chapter is called the
neoclassical theory of income distribution.
 It states that
 factor prices determined by supply and demand
 each factor is paid the value of its marginal
product
 Most economists use this theory a starting point
for understanding the distribution of income.
 The next two chapters explore this topic further.
CHAPTER SUMMARY
 The economy’s income distribution is determined
in the markets for the factors of production. The
three most important factors of production are
labor, land, and capital.
 A firm’s demand for a factor is derived from its
supply of output.
 Competitive firms maximize profit by hiring each
factor up to the point where the value of its
marginal product equals its rental price.
35
CHAPTER SUMMARY
 The supply of labor arises from the trade-off
between work and leisure, and yields an upward-
sloping labor supply curve.
 The price paid to each factor adjusts to balance
supply and demand for that factor. In equilibrium,
each factor is compensated according to its
marginal contribution to production.
 Factors of production are used together. A change
in the quantity of one factor affects the marginal
products and equilibrium earnings of all factors.
36

microeconomics - princ -ch18-presentation.ppt

  • 1.
    © 2009 South-Western,a part of Cengage Learning, all rights reserved C H A P T E R The Markets for the Factors of Production Economics P R I N C I P L E S O F N. Gregory Mankiw Premium PowerPoint Slides by Ron Cronovich 18
  • 2.
    In this chapter, lookfor the answers to these questions:  What determines a competitive firm’s demand for labor?  How does labor supply depend on the wage? What other factors affect labor supply?  How do various events affect the equilibrium wage and employment of labor?  How are the equilibrium prices and quantities of other inputs determined? 1
  • 3.
    THE MARKETS FORTHE FACTORS OF PRODUCTION 2 Factors of Production and Factor Markets  Factors of production: the inputs used to produce goods and services.  Labor  Land  Capital: the equipment and structures used to produce goods and services.  Prices and quantities of these inputs are determined by supply & demand in factor markets.
  • 4.
    THE MARKETS FORTHE FACTORS OF PRODUCTION 3 Derived Demand  Markets for the factors of production are like markets for goods & services, except:  Demand for a factor of production is a derived demand – derived from a firm’s decision to supply a good in another market.
  • 5.
    THE MARKETS FORTHE FACTORS OF PRODUCTION 4 Two Assumptions 1. We assume all markets are competitive. The typical firm is a price taker  in the market for the product it produces  in the labor market 2. We assume that firms care only about maximizing profits.  Each firm’s supply of output and demand for inputs are derived from this goal.
  • 6.
    THE MARKETS FORTHE FACTORS OF PRODUCTION 5 Our Example: Farmer Jack  Farmer Jack sells wheat in a perfectly competitive market.  He hires workers in a perfectly competitive labor market.  When deciding how many workers to hire, Farmer Jack maximizes profits by thinking at the margin:  If the benefit from hiring another worker exceeds the cost, Jack will hire that worker.
  • 7.
    THE MARKETS FORTHE FACTORS OF PRODUCTION 6 Our Example: Farmer Jack  Cost of hiring another worker: the wage – the price of labor  Benefit of hiring another worker: Jack can produce more wheat to sell, increasing his revenue.  The size of this benefit depends on Jack’s production function: the relationship between the quantity of inputs used to make a good and the quantity of output of that good.
  • 8.
    THE MARKETS FORTHE FACTORS OF PRODUCTION 7 0 500 1,000 1,500 2,000 2,500 3,000 0 1 2 3 4 5 No. of workers Quantity of output Farmer Jack’s Production Function 3000 5 2800 4 2400 3 1800 2 1000 1 0 0 Q (bushels of wheat per week) L (no. of workers)
  • 9.
    THE MARKETS FORTHE FACTORS OF PRODUCTION 8 Marginal Product of Labor (MPL)  Marginal product of labor: the increase in the amount of output from an additional unit of labor where ∆Q = change in output ∆L = change in labor ∆Q ∆L MPL =
  • 10.
    THE MARKETS FORTHE FACTORS OF PRODUCTION 9 The Value of the Marginal Product  Problem:  Cost of hiring another worker (wage) is measured in dollars  Benefit of hiring another worker (MPL) is measured in units of output  Solution: convert MPL to dollars  Value of the marginal product: the marginal product of an input times the price of the output VMPL = value of the marginal product of labor = P x MPL
  • 11.
    A C TI V E L E A R N I N G 1 Computing MPL and VMPL 10 P = $5/bushel. Find MPL and VMPL, fill them in the blank spaces of the table. Then graph a curve with VMPL on the vertical axis, L on horiz axis. 3000 5 2800 4 2400 3 1800 2 1000 1 0 0 VMPL MPL Q (bushels of wheat) L (no. of workers)
  • 12.
    A C TI V E L E A R N I N G 1 Answers 11 Farmer Jack’s production function exhibits diminishing marginal product: MPL falls as L increases. This property is very common. 3000 5 2800 4 2400 3 1800 2 1000 1 0 0 VMPL = P x MPL MPL = ∆Q/∆L Q (bushels of wheat) L (no. of workers) 1,000 200 2,000 400 3,000 600 4,000 800 $5,000 1000
  • 13.
    A C TI V E L E A R N I N G 1 Answers 12 Farmer Jack’s VMPL curve is downward sloping due to diminishing marginal product. L (number of workers) The VMPL curve 0 1,000 2,000 3,000 4,000 5,000 $6,000 0 1 2 3 4 5
  • 14.
    THE MARKETS FORTHE FACTORS OF PRODUCTION 13 At any larger L, can increase profit by hiring one fewer worker. Farmer Jack’s Labor Demand Suppose wage W = $2500/week. How many workers should Jack hire? Answer: L = 3 L (number of workers) The VMPL curve 0 1,000 2,000 3,000 4,000 5,000 $6,000 0 1 2 3 4 5 $2,500 At any smaller L, can increase profit by hiring another worker.
  • 15.
    THE MARKETS FORTHE FACTORS OF PRODUCTION 14 VMPL and Labor Demand For any competitive, profit-maximizing firm:  To maximize profits, hire workers up to the point where VMPL = W.  The VMPL curve is the labor demand curve. W L VMPL W1 L1
  • 16.
    THE MARKETS FORTHE FACTORS OF PRODUCTION 15 Shifts in Labor Demand Labor demand curve = VMPL curve. VMPL = P x MPL Anything that increases P or MPL at each L will increase VMPL and shift labor demand curve upward. W L D1 D2
  • 17.
    THE MARKETS FORTHE FACTORS OF PRODUCTION 16 Things that Shift the Labor Demand Curve  Changes in the output price, P  Technological change (affects MPL)  The supply of other factors (affects MPL)  Example: If firm gets more equipment (capital), then workers will be more productive; MPL and VMPL rise, labor demand shifts upward.
  • 18.
    THE MARKETS FORTHE FACTORS OF PRODUCTION 17 The Connection Between Input Demand & Output Supply  Recall: Marginal Cost (MC) = cost of producing an additional unit of output = ∆TC/∆Q, where TC = total cost  Suppose W = $2500, MPL = 500 bushels  If Farmer Jack hires another worker, ∆TC = $2500, ∆Q = 500 bushels MC = $2500/500 = $5 per bushel  In general: MC = W/MPL
  • 19.
    THE MARKETS FORTHE FACTORS OF PRODUCTION 18 The Connection Between Input Demand & Output Supply  In general: MC = W/MPL  Notice:  To produce additional output, hire more labor.  As L rises, MPL falls…  causing W/MPL to rise…  causing MC to rise.  Hence, diminishing marginal product and increasing marginal cost are two sides of the same coin.
  • 20.
    THE MARKETS FORTHE FACTORS OF PRODUCTION 19 The Connection Between Input Demand & Output Supply  The competitive firm’s rule for demanding labor: P x MPL = W  Divide both sides by MPL: P = W/MPL  Substitute MC = W/MPL from previous slide: P = MC  This is the competitive firm’s rule for supplying output.  Hence, input demand and output supply are two sides of the same coin.
  • 21.
    THE MARKETS FORTHE FACTORS OF PRODUCTION 20 Labor Supply  Trade-off between work and leisure: The more time you spend working, the less time you have for leisure.  The opportunity cost of leisure is the wage.
  • 22.
    THE MARKETS FORTHE FACTORS OF PRODUCTION 21 The Labor Supply Curve An increase in W is an increase in the opp. cost of leisure. People respond by taking less leisure and by working more. W L S1 W1 L1 W2 L2
  • 23.
    THE MARKETS FORTHE FACTORS OF PRODUCTION 22 Things that Shift the Labor Supply Curve  Changes in tastes or attitudes regarding the labor-leisure trade-off  Opportunities for workers in other labor markets  Immigration
  • 24.
    THE MARKETS FORTHE FACTORS OF PRODUCTION 23 Equilibrium in the Labor Market The wage adjusts to balance supply and demand for labor. The wage always equals VMPL. W L D S W1 L1
  • 25.
    In each ofthe following scenarios, use a diagram of the market for (domestic) auto workers to find the effects on their wage and employment. A. Baby Boomers who worked in the auto industry retire. B. Car buyers’ preferences shift toward imported autos. C. Technological progress boosts productivity in the auto manufacturing industry. A C T I V E L E A R N I N G 2 Changes in labor-market equilibrium 24
  • 26.
    A C TI V E L E A R N I N G 2 Answers to A 25 The retirement of Baby Boomer auto workers shifts supply leftward. W rises, L falls. W L D1 S1 W1 L1 S2 W2 L2 The market for autoworkers
  • 27.
    A C TI V E L E A R N I N G 2 Answers to B 26 A fall in the demand for U.S. autos reduces P. At each L, VMPL falls. Labor demand curve shifts down. W and L both fall. W L D1 S1 W1 L1 D2 W2 L2 The market for autoworkers
  • 28.
    A C TI V E L E A R N I N G 2 Answers to C 27 At each L, MPL rises due to tech. progress. VMPL rises and labor demand curve shifts upward. W and L increase. W L D1 S1 W1 L1 D2 W2 L2 The market for autoworkers
  • 29.
    THE MARKETS FORTHE FACTORS OF PRODUCTION 28 Productivity and Wage Growth in the U.S. Recall one of the Ten Principles: A country’s standard of living depends on its ability to produce g&s. Our theory implies wages tied to labor productivity (W = VMPL). We see this in the data. 2.5 2.6 1995-2006 1.2 1.4 1973-1995 2.8 2.8 1959-1973 2.0% 2.1% 1959-2006 growth rate of real wages growth rate of produc- tivity time period
  • 30.
    THE MARKETS FORTHE FACTORS OF PRODUCTION 29 The Other Factors of Production  With land and capital, must distinguish between:  purchase price – the price a person pays to own that factor indefinitely  rental price – the price a person pays to use that factor for a limited period of time  The wage is the rental price of labor.  The determination of the rental prices of capital and land is analogous to the determination of wages…
  • 31.
    THE MARKETS FORTHE FACTORS OF PRODUCTION 30 How the Rental Price of Land Is Determined Firms decide how much land to rent by comparing the price with the value of the marginal product (VMP) of land. The rental price of land adjusts to balance supply and demand for land. P Q D = VMP S P Q The market for land
  • 32.
    THE MARKETS FORTHE FACTORS OF PRODUCTION 31 How the Rental Price of Capital Is Determined Firms decide how much capital to rent by comparing the price with the value of the marginal product (VMP) of capital. The rental price of capital adjusts to balance supply and demand for capital. P Q D = VMP S P Q The market for capital
  • 33.
    THE MARKETS FORTHE FACTORS OF PRODUCTION 32 Rental and Purchase Prices  Buying a unit of capital or land yields a stream of rental income.  The rental income in any period equals the value of the marginal product (VMP).  Hence, the equilibrium purchase price of a factor depends on both the current VMP and the VMP expected to prevail in future periods.
  • 34.
    THE MARKETS FORTHE FACTORS OF PRODUCTION 33 Linkages Among the Factors of Production  In most cases, factors of production are used together in a way that makes each factor’s productivity dependent on the quantities of the other factors.  Example: an increase in the quantity of capital  The marginal product and rental price of capital fall.  Having more capital makes workers more productive, MPL and W rise.
  • 35.
    THE MARKETS FORTHE FACTORS OF PRODUCTION 34 CONCLUSION  The theory in this chapter is called the neoclassical theory of income distribution.  It states that  factor prices determined by supply and demand  each factor is paid the value of its marginal product  Most economists use this theory a starting point for understanding the distribution of income.  The next two chapters explore this topic further.
  • 36.
    CHAPTER SUMMARY  Theeconomy’s income distribution is determined in the markets for the factors of production. The three most important factors of production are labor, land, and capital.  A firm’s demand for a factor is derived from its supply of output.  Competitive firms maximize profit by hiring each factor up to the point where the value of its marginal product equals its rental price. 35
  • 37.
    CHAPTER SUMMARY  Thesupply of labor arises from the trade-off between work and leisure, and yields an upward- sloping labor supply curve.  The price paid to each factor adjusts to balance supply and demand for that factor. In equilibrium, each factor is compensated according to its marginal contribution to production.  Factors of production are used together. A change in the quantity of one factor affects the marginal products and equilibrium earnings of all factors. 36