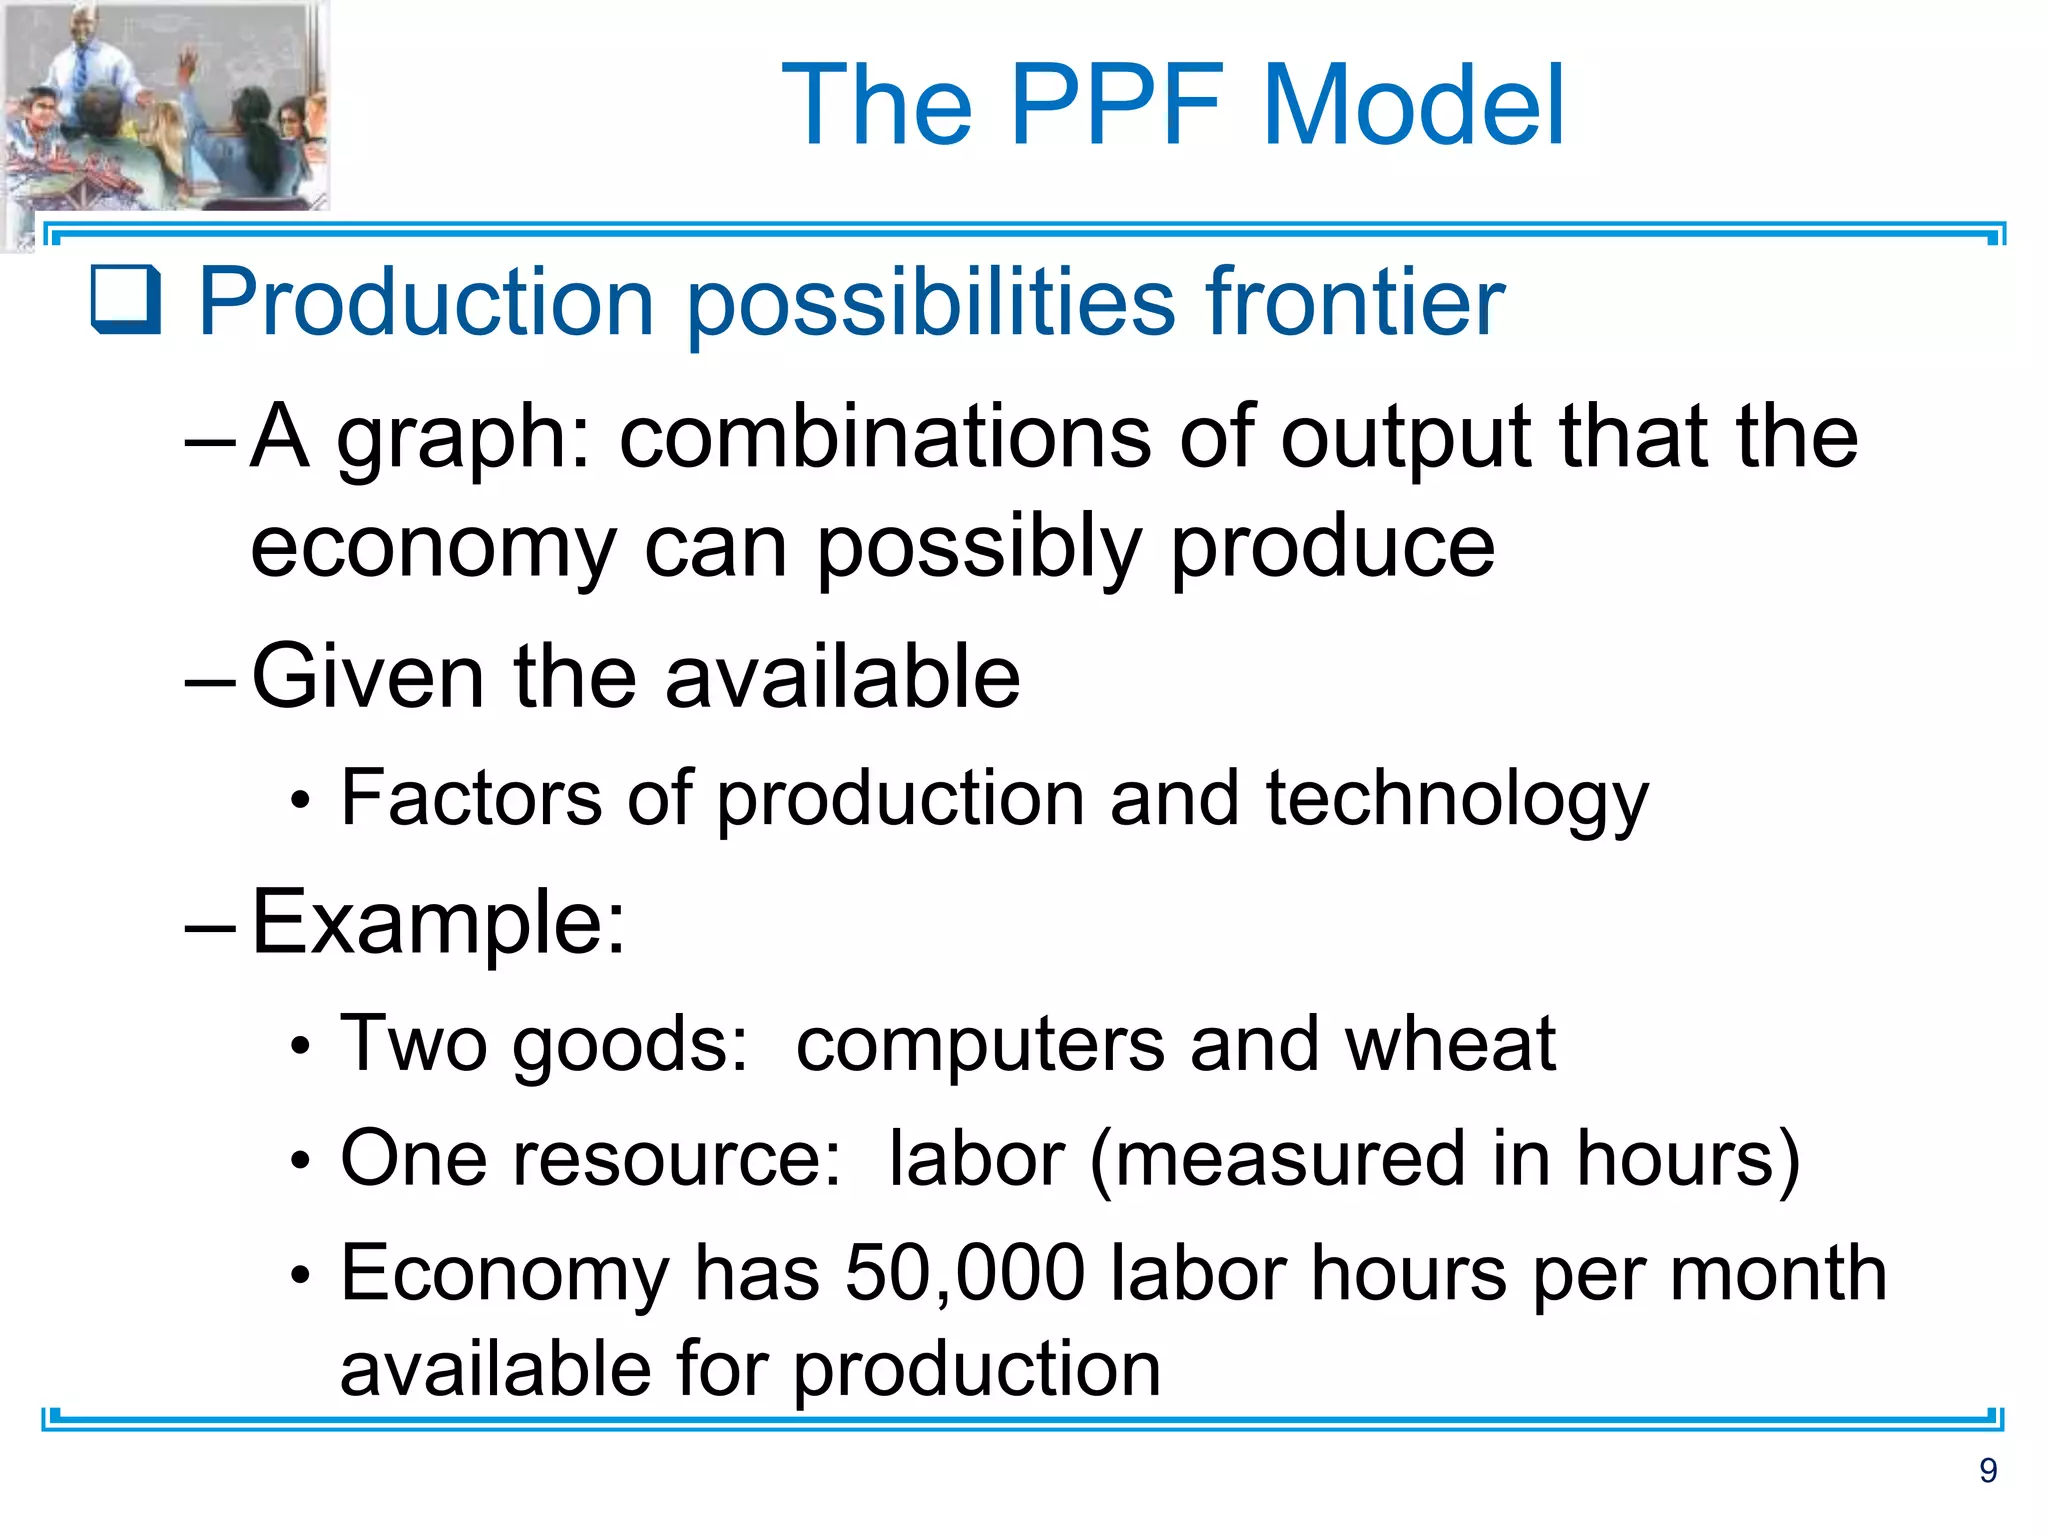
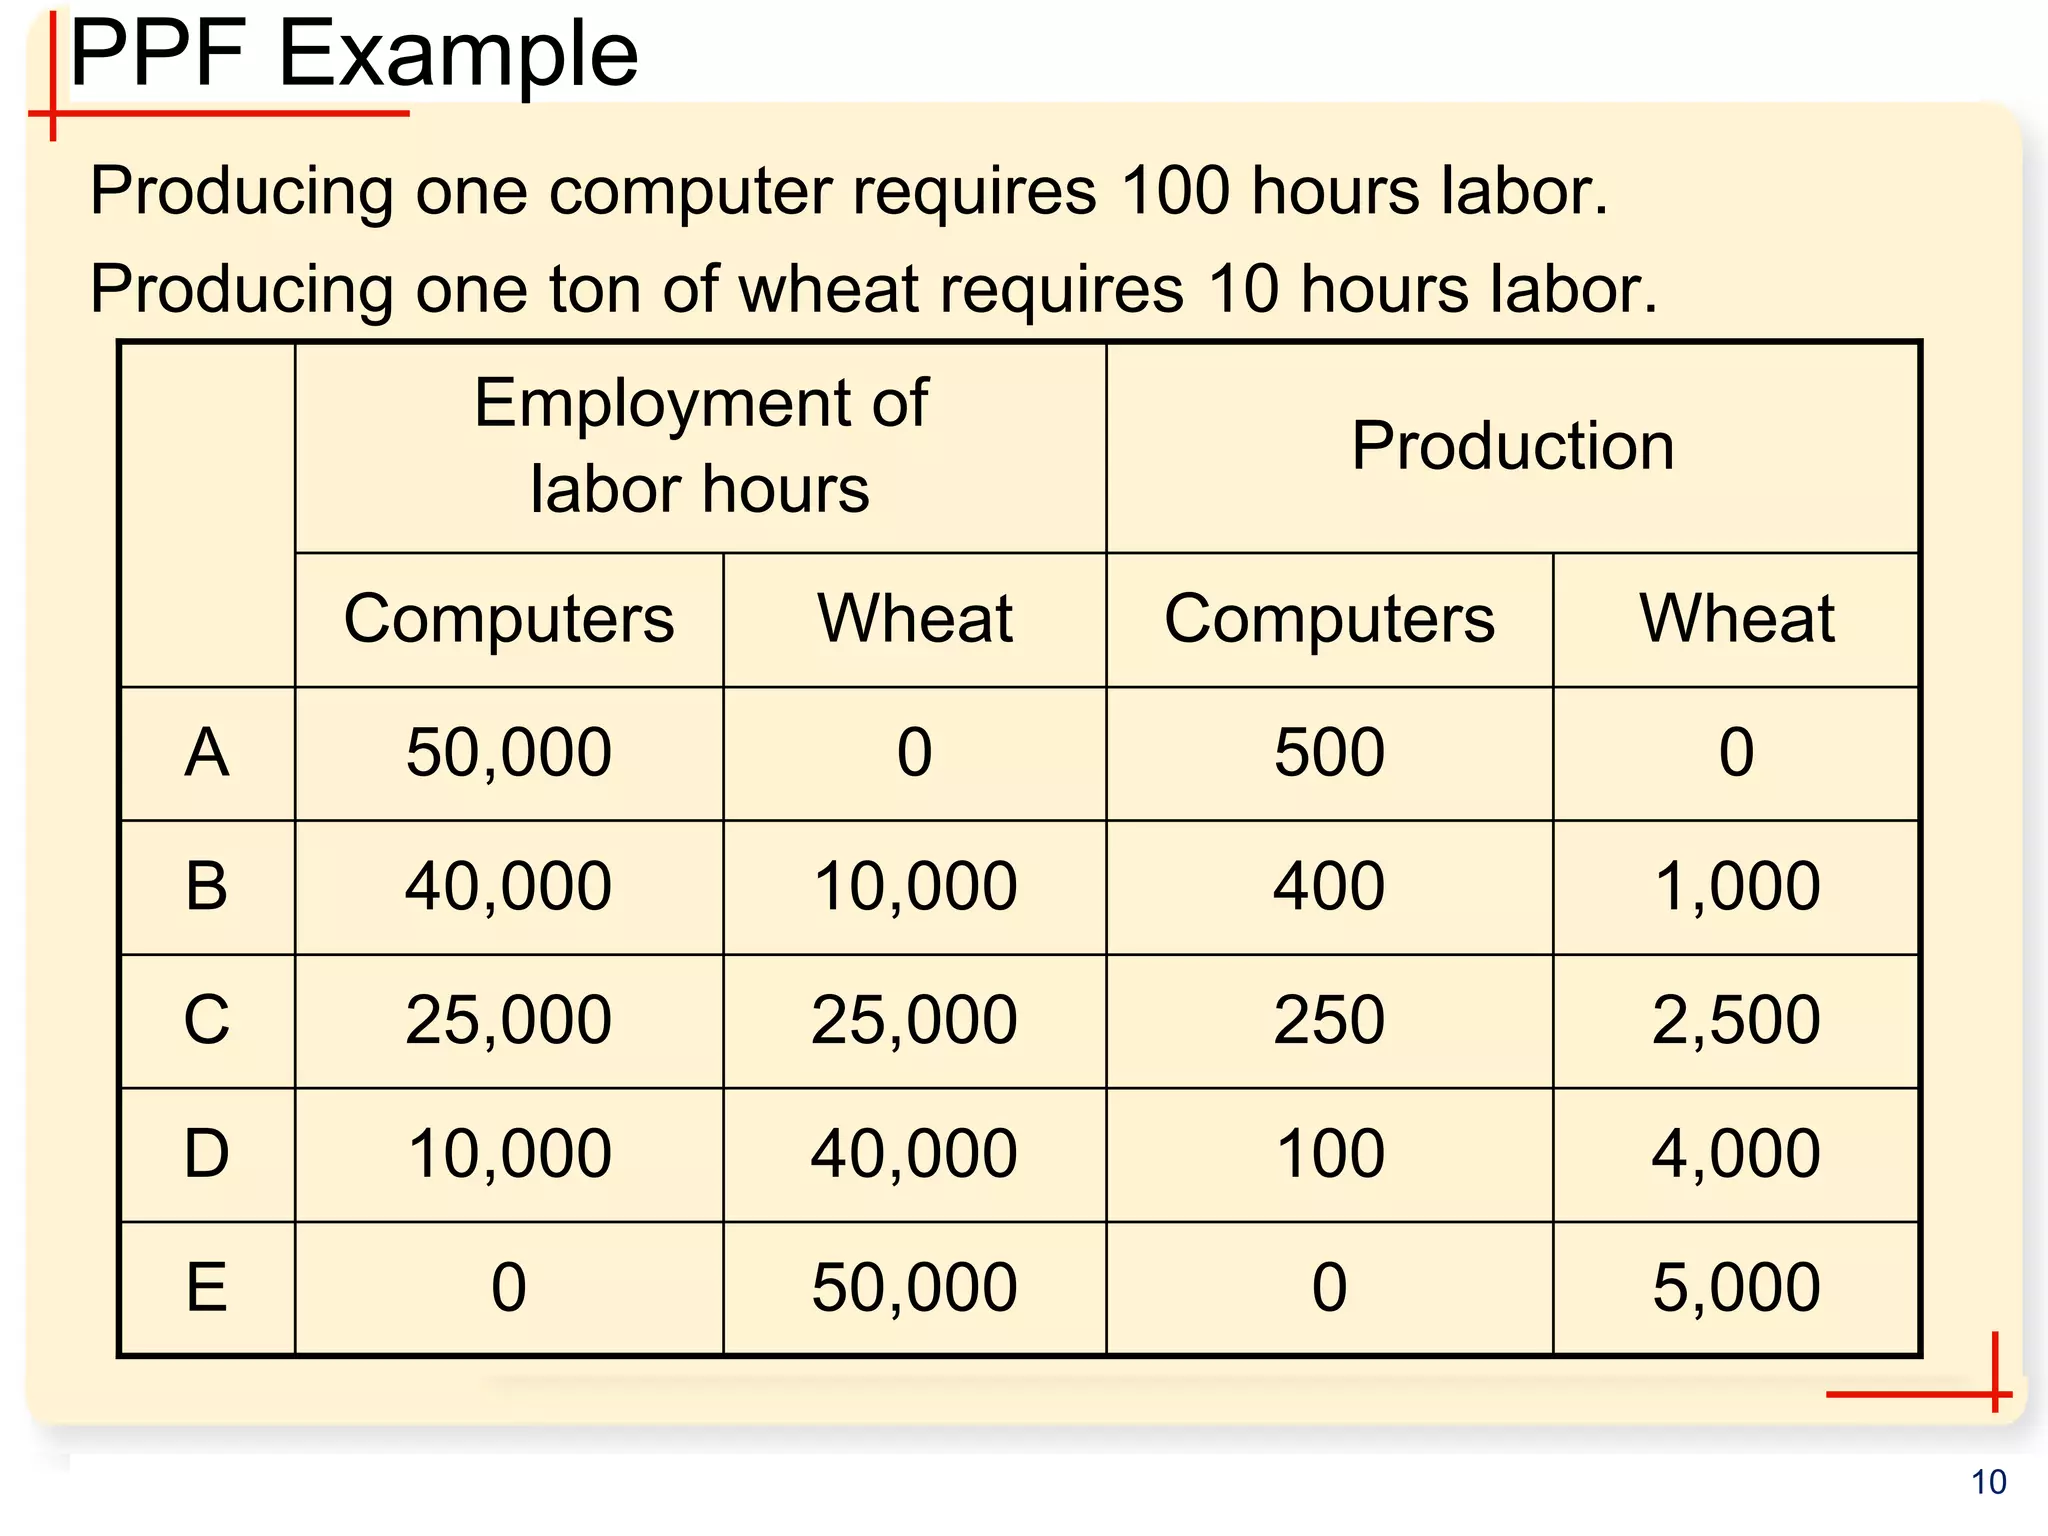
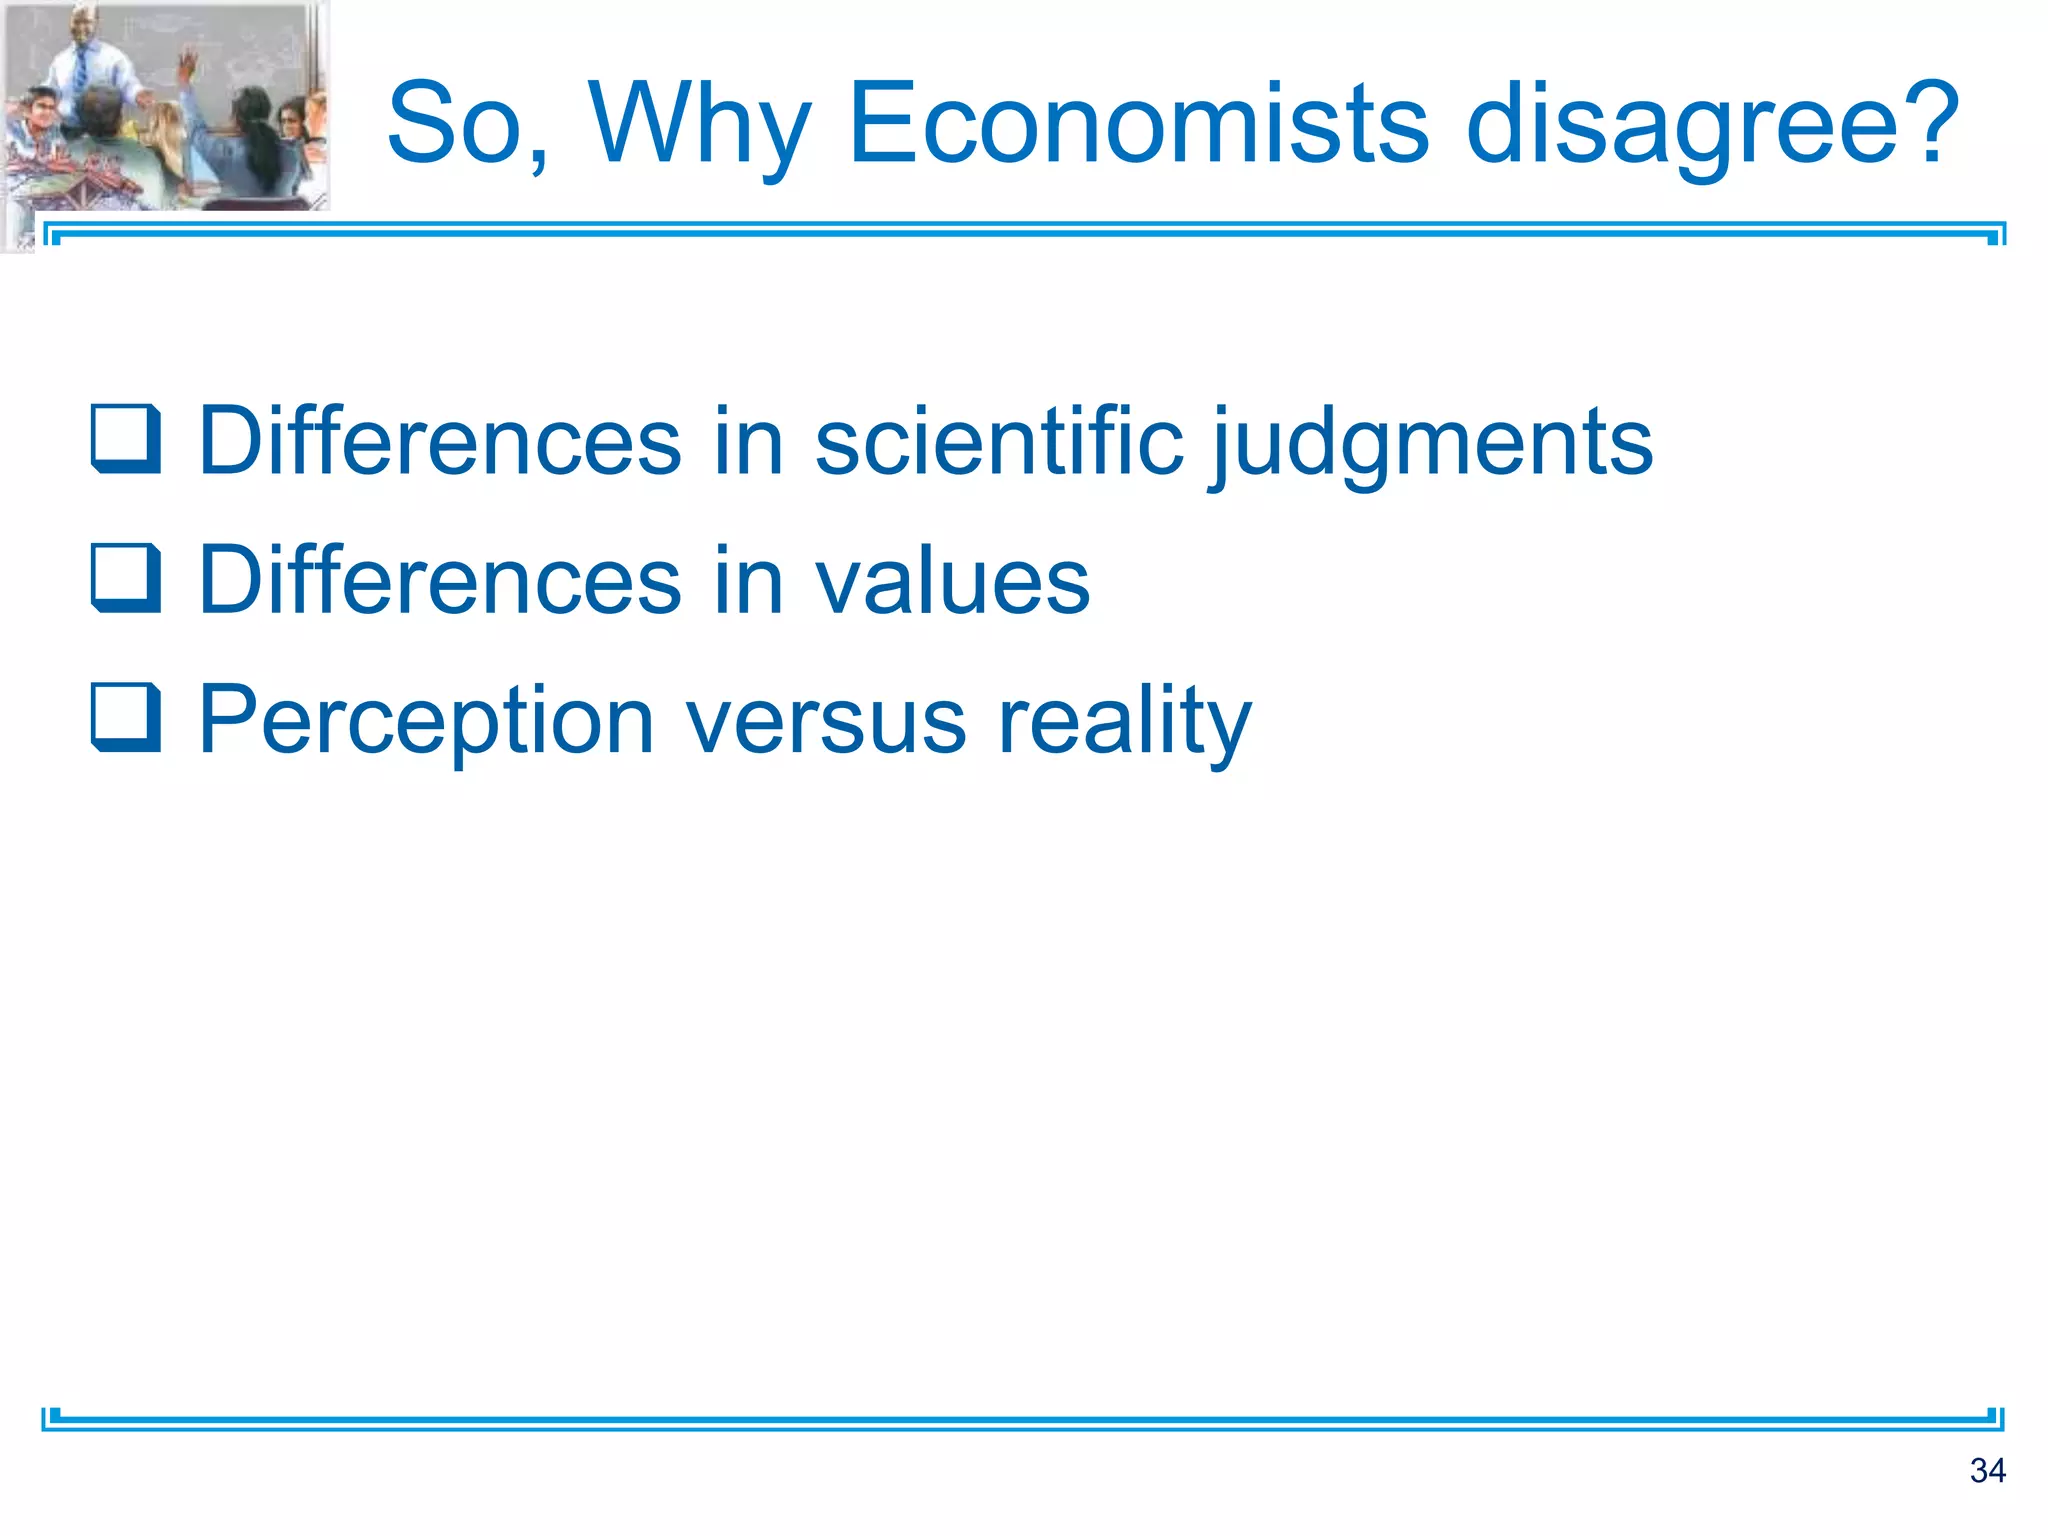
PRINCIPLES OF ECONOMICS
7TH EDITION
N. GREGORY MANKIW
Chapter Two:
Thinking Like an Economist
COURSE ADMINISTRATOR: KAZI SAIFUR RAHMAN
EMAIL: kazisaifur786@gmail.com
1
Look for the answers to these questions:
o What are economists’ two roles? How do they
differ?
o What are models? How do economists use them?
o What are the elements of the Circular-Flow
Diagram? What concepts does the diagram
illustrate?
o How is the Production Possibilities Frontier related
to opportunity cost? What other concepts does it
illustrate?
o What is the difference between microeconomics and
macroeconomics? Between positive and normative?
2
The Economist as a Scientist
 Economists play two roles:
1. Scientists: try to explain the world
2. Policy advisors: try to improve it
 As scientists, economists employ the
scientific method
–The scientific method: Observation, theory
& more observation
–Dispassionate development and testing of
theories about how the world works
3
The Economist as a Scientist
 The Role of Assumptions
–Simplify the complex world and make it
easier to understand
–Example: to study international trade,
assume two countries and two goods
 Economic Models: Economists use
models to study economic issues
–Highly simplified representation of
a more complicated reality
4
The Economist as a Scientist
 Examples of models:
–The model teeth at the dentist’s office
–A model of human anatomy from high
school biology class
–A road map
5
The Economist as a Scientist
 The Circular-flow diagram model
–Visual model of the economy
–Shows how dollars flow through markets
among households and firms
 Two decision makers
–Firms and Households
 Interacting in two markets
–Market for goods and services
–Market for factors of production (inputs)
6
Figure 1 The circular flow
7
Households:
 Own the factors of production,
sell/rent them to firms for income
 Buy and consume goods & services
Households
Firms
Firms:
 Buy/hire factors of production,
use them to produce goods and
services
 Sell goods & services
Figure 1 The circular flow
8
Markets for
Factors of
Production
Households
Firms
Income
Wages, rent,
profit
Factors of
production
Labor, land,
capital
Spending
G & S
bought
G & S
sold
Revenue
Markets for
Goods &
Services
The PPF Model
 Production possibilities frontier
–A graph: combinations of output that the
economy can possibly produce
–Given the available
• Factors of production and technology
–Example:
• Two goods: computers and wheat
• One resource: labor (measured in hours)
• Economy has 50,000 labor hours per month
available for production
9
PPF Example
Producing one computer requires 100 hours labor.
Producing one ton of wheat requires 10 hours labor.
10
5,000
0
4,000
100
2,500
250
1,000
400
50,000
0
40,000
10,000
25,000
25,000
10,000
40,000
0
500
0
50,000
E
D
C
B
A
Wheat
Computers
Wheat
Computers
Production
Employment of
labor hours
PPF Example
11
Point
on
graph
Production
Com-
puters
Wheat
A 500 0
B 400 1,000
C 250 2,500
D 100 4,000
E 0 5,000
0
1,000
2,000
3,000
4,000
5,000
6,000
0 100 200 300 400 500 600
Wheat
(tons)
Computers
A
B
C
D
E
Active Learning 1 Points off the PPF
On the graph above, find the point that
represents (100 computers, 3000 tons of
wheat), label it F.
– Would it be possible for the economy to
produce this combination of the two goods?
Why or why not?
Next, find the point that represents (300
computers, 3500 tons of wheat), label it G.
– Would it be possible for the economy to
produce this combination of the two goods?
12
Active Learning 1 Answers
o Point F: 100
computers, 3000
tons wheat
o Requires 40,000
hours of labor
o Possible but not
efficient: could
get more
of either good
without
sacrificing any of
the other
13
0
1,000
2,000
3,000
4,000
5,000
6,000
0 100 200 300 400 500 600
Wheat
(tons)
Computers
F
Active Learning 1 Answers
o Point G: 300
computers, 3500
tons wheat
o Requires 65,000
hours of labor.
o Not possible
because the
economy only
has 50,000
hours
14
0
1,000
2,000
3,000
4,000
5,000
6,000
0 100 200 300 400 500 600
Wheat
(tons)
Computers
G
The PPF: What We Know So Far
o Points on the PPF (like A – E): possible
–Efficient: all resources are fully utilized
o Points under the PPF (like F): possible
–Not efficient: some resources are
underutilized (e.g., workers unemployed,
factories idle)
o Points above the PPF (like G)
–Not possible
15
The PPF
o Moving along a PPF
–Involves shifting resources from the
production of one good to the other
o Society faces a tradeoff
–Getting more of one good requires
sacrificing some of the other
o The slope of the PPF
–The opportunity cost of one good in terms
of the other
16
The PPF and Opportunity Cost
The slope of a line
equals the “rise
over the run.”
Opportunity cost of
1 computer =
10 tons of wheat.
17
0
1,000
2,000
3,000
4,000
5,000
6,000
0 100 200 300 400 500 600
Wheat
(tons)
Computers
–1000
100
slope = = –10
Active Learning 2 PPF and Opportunity Cost
In which country is the opportunity cost of
cloth lower?
18
0
100
200
300
400
500
600
0 100 200 300 400
Cloth
Wine
ENGLAND
0
100
200
300
400
500
600
0 100 200 300 400
Cloth
Wine
FRANCE
Active Learning 2 Answers
England, because its PPF is not as steep as France’s
19
0
100
200
300
400
500
600
0 100 200 300 400
Cloth
Wine
ENGLAND
0
100
200
300
400
500
600
0 100 200 300 400
Cloth
Wine
FRANCE
Economic Growth and the PPF
With additional
resources or an
improvement in
technology,
the economy can
produce more
computers,
more wheat,
or any combination in
between.
20
0
1,000
2,000
3,000
4,000
5,000
6,000
0 100 200 300 400 500 600
Wheat
(tons)
Computers
Economic
growth shifts
the PPF
outward.
The Shape of the PPF
 Shape of the PPF
–Straight line: constant opportunity cost
• Previous example: the opportunity cost of 1
computer is 10 tons of wheat
– Bowed outward: increasing opportunity
cost
• As more units of a good are produced, we
need to give up increasing amounts of the
other good produced
21
Why the PPF Might Be Bowed Outward
As the economy
shifts resources
from computer to
automated cars:
PPF becomes
steeper
and the opportunity
cost of automated
cars increases.
22
Automated
Cars
Computer
Why the PPF Might Be Bowed Outward
At point A, most
workers are
producing
computers, even
those who are
better suited to
building
automated cars.
So, do not have to
give up much
computers to get
more cars.
23
Automated
Cars
Computer
A
At A, opportunity cost
of automated cars is
low.
Why the PPF Might Be Bowed Outward
At B, most workers
are producing cars.
The few left in
computers
production are the
best.
Producing more cars
would require
shifting some of the
best producers away
from computer
production
causing a big drop in
computer output. 24
Automated
Cars
Computers
A
B
At B, opportunity
cost of automated
car is high.
Why the PPF Might Be Bowed Outward
 The PPF is bowed outward when:
–Different workers have different skills
–Different opportunity costs of producing
one good in terms of the other
–There is some other resource, or mix of
resources with varying opportunity costs
• E.g., different types of land suited for different
uses
25
The Economist as a Scientist
 Microeconomics
–The study of how households and firms
make decisions and how they interact in
markets
 Macroeconomics
–The study of economy-wide phenomena,
including inflation, unemployment, and
economic growth
26
27
The Economist as Policy Adviser
 Positive statements: descriptive
–Attempt to describe the world as it is
–Confirm or refute by examining evidence:
“Minimum-wage laws cause
unemployment”
 Normative statements: prescriptive
–Attempt to prescribe how the world should
be: “The government should raise the
minimum wage”
28
29
Active Learning 3 Positive vs. Normative
Which of these statements are “positive” and
which are “normative”? How can you tell the
difference?
a. Prices rise when the government increases the
quantity of money.
b. The government should print less money.
c. A tax cut is needed to stimulate the economy.
d. An increase in the price of burritos will cause an
increase in consumer demand for music
downloads.
30
Active Learning 3 Answers
a. Prices rise when the government increases
the quantity of money.
Positive – describes a relationship, could use
data to confirm or refute.
b. The government should print less money.
Normative – this is a value judgment, cannot be
confirmed or refuted.
31
Active Learning 3 Answers
c. A tax cut is needed to stimulate the
economy.
Normative – another value judgment.
d. An increase in the price of burritos will cause
an increase in consumer demand for music
downloads
Positive – describes a relationship.
Note that a statement need not be true to be positive.
32
Why Economists Disagree
 Economists often give conflicting policy
advice
– Can disagree about the validity of
alternative positive theories about the world
– May have different values and, therefore,
different normative views about what policy
should try to accomplish
 Yet, there are many propositions about
which most economists agree
33
So, Why Economists disagree?
 Differences in scientific judgments
 Differences in values
 Perception versus reality
34
Summary
• Economists are scientists
– Make appropriate assumptions and build
simplified models
– The circular-flow diagram and the production
possibilities frontier
• Micro economists study decision making by
households and firms and their interactions in
the marketplace
• Macroeconomists study the forces and trends
that affect the economy as a whole
35
Summary
• A positive statement is an assertion about how
the world is
• A normative statement is an assertion about
how the world ought to be
• As policy advisers, economists make normative
statements
• Economists sometimes offer conflicting advice
– Differences in scientific judgments
– Differences in values
36
37

MICROECONOMICS MANKIW CHAPTER 02.pptx

  • 1.
    PRINCIPLES OF ECONOMICS 7THEDITION N. GREGORY MANKIW Chapter Two: Thinking Like an Economist COURSE ADMINISTRATOR: KAZI SAIFUR RAHMAN EMAIL: kazisaifur786@gmail.com 1
  • 2.
    Look for theanswers to these questions: o What are economists’ two roles? How do they differ? o What are models? How do economists use them? o What are the elements of the Circular-Flow Diagram? What concepts does the diagram illustrate? o How is the Production Possibilities Frontier related to opportunity cost? What other concepts does it illustrate? o What is the difference between microeconomics and macroeconomics? Between positive and normative? 2
  • 3.
    The Economist asa Scientist  Economists play two roles: 1. Scientists: try to explain the world 2. Policy advisors: try to improve it  As scientists, economists employ the scientific method –The scientific method: Observation, theory & more observation –Dispassionate development and testing of theories about how the world works 3
  • 4.
    The Economist asa Scientist  The Role of Assumptions –Simplify the complex world and make it easier to understand –Example: to study international trade, assume two countries and two goods  Economic Models: Economists use models to study economic issues –Highly simplified representation of a more complicated reality 4
  • 5.
    The Economist asa Scientist  Examples of models: –The model teeth at the dentist’s office –A model of human anatomy from high school biology class –A road map 5
  • 6.
    The Economist asa Scientist  The Circular-flow diagram model –Visual model of the economy –Shows how dollars flow through markets among households and firms  Two decision makers –Firms and Households  Interacting in two markets –Market for goods and services –Market for factors of production (inputs) 6
  • 7.
    Figure 1 Thecircular flow 7 Households:  Own the factors of production, sell/rent them to firms for income  Buy and consume goods & services Households Firms Firms:  Buy/hire factors of production, use them to produce goods and services  Sell goods & services
  • 8.
    Figure 1 Thecircular flow 8 Markets for Factors of Production Households Firms Income Wages, rent, profit Factors of production Labor, land, capital Spending G & S bought G & S sold Revenue Markets for Goods & Services
  • 9.
    The PPF Model Production possibilities frontier –A graph: combinations of output that the economy can possibly produce –Given the available • Factors of production and technology –Example: • Two goods: computers and wheat • One resource: labor (measured in hours) • Economy has 50,000 labor hours per month available for production 9
  • 10.
    PPF Example Producing onecomputer requires 100 hours labor. Producing one ton of wheat requires 10 hours labor. 10 5,000 0 4,000 100 2,500 250 1,000 400 50,000 0 40,000 10,000 25,000 25,000 10,000 40,000 0 500 0 50,000 E D C B A Wheat Computers Wheat Computers Production Employment of labor hours
  • 11.
    PPF Example 11 Point on graph Production Com- puters Wheat A 5000 B 400 1,000 C 250 2,500 D 100 4,000 E 0 5,000 0 1,000 2,000 3,000 4,000 5,000 6,000 0 100 200 300 400 500 600 Wheat (tons) Computers A B C D E
  • 12.
    Active Learning 1Points off the PPF On the graph above, find the point that represents (100 computers, 3000 tons of wheat), label it F. – Would it be possible for the economy to produce this combination of the two goods? Why or why not? Next, find the point that represents (300 computers, 3500 tons of wheat), label it G. – Would it be possible for the economy to produce this combination of the two goods? 12
  • 13.
    Active Learning 1Answers o Point F: 100 computers, 3000 tons wheat o Requires 40,000 hours of labor o Possible but not efficient: could get more of either good without sacrificing any of the other 13 0 1,000 2,000 3,000 4,000 5,000 6,000 0 100 200 300 400 500 600 Wheat (tons) Computers F
  • 14.
    Active Learning 1Answers o Point G: 300 computers, 3500 tons wheat o Requires 65,000 hours of labor. o Not possible because the economy only has 50,000 hours 14 0 1,000 2,000 3,000 4,000 5,000 6,000 0 100 200 300 400 500 600 Wheat (tons) Computers G
  • 15.
    The PPF: WhatWe Know So Far o Points on the PPF (like A – E): possible –Efficient: all resources are fully utilized o Points under the PPF (like F): possible –Not efficient: some resources are underutilized (e.g., workers unemployed, factories idle) o Points above the PPF (like G) –Not possible 15
  • 16.
    The PPF o Movingalong a PPF –Involves shifting resources from the production of one good to the other o Society faces a tradeoff –Getting more of one good requires sacrificing some of the other o The slope of the PPF –The opportunity cost of one good in terms of the other 16
  • 17.
    The PPF andOpportunity Cost The slope of a line equals the “rise over the run.” Opportunity cost of 1 computer = 10 tons of wheat. 17 0 1,000 2,000 3,000 4,000 5,000 6,000 0 100 200 300 400 500 600 Wheat (tons) Computers –1000 100 slope = = –10
  • 18.
    Active Learning 2PPF and Opportunity Cost In which country is the opportunity cost of cloth lower? 18 0 100 200 300 400 500 600 0 100 200 300 400 Cloth Wine ENGLAND 0 100 200 300 400 500 600 0 100 200 300 400 Cloth Wine FRANCE
  • 19.
    Active Learning 2Answers England, because its PPF is not as steep as France’s 19 0 100 200 300 400 500 600 0 100 200 300 400 Cloth Wine ENGLAND 0 100 200 300 400 500 600 0 100 200 300 400 Cloth Wine FRANCE
  • 20.
    Economic Growth andthe PPF With additional resources or an improvement in technology, the economy can produce more computers, more wheat, or any combination in between. 20 0 1,000 2,000 3,000 4,000 5,000 6,000 0 100 200 300 400 500 600 Wheat (tons) Computers Economic growth shifts the PPF outward.
  • 21.
    The Shape ofthe PPF  Shape of the PPF –Straight line: constant opportunity cost • Previous example: the opportunity cost of 1 computer is 10 tons of wheat – Bowed outward: increasing opportunity cost • As more units of a good are produced, we need to give up increasing amounts of the other good produced 21
  • 22.
    Why the PPFMight Be Bowed Outward As the economy shifts resources from computer to automated cars: PPF becomes steeper and the opportunity cost of automated cars increases. 22 Automated Cars Computer
  • 23.
    Why the PPFMight Be Bowed Outward At point A, most workers are producing computers, even those who are better suited to building automated cars. So, do not have to give up much computers to get more cars. 23 Automated Cars Computer A At A, opportunity cost of automated cars is low.
  • 24.
    Why the PPFMight Be Bowed Outward At B, most workers are producing cars. The few left in computers production are the best. Producing more cars would require shifting some of the best producers away from computer production causing a big drop in computer output. 24 Automated Cars Computers A B At B, opportunity cost of automated car is high.
  • 25.
    Why the PPFMight Be Bowed Outward  The PPF is bowed outward when: –Different workers have different skills –Different opportunity costs of producing one good in terms of the other –There is some other resource, or mix of resources with varying opportunity costs • E.g., different types of land suited for different uses 25
  • 26.
    The Economist asa Scientist  Microeconomics –The study of how households and firms make decisions and how they interact in markets  Macroeconomics –The study of economy-wide phenomena, including inflation, unemployment, and economic growth 26
  • 27.
  • 28.
    The Economist asPolicy Adviser  Positive statements: descriptive –Attempt to describe the world as it is –Confirm or refute by examining evidence: “Minimum-wage laws cause unemployment”  Normative statements: prescriptive –Attempt to prescribe how the world should be: “The government should raise the minimum wage” 28
  • 29.
  • 30.
    Active Learning 3Positive vs. Normative Which of these statements are “positive” and which are “normative”? How can you tell the difference? a. Prices rise when the government increases the quantity of money. b. The government should print less money. c. A tax cut is needed to stimulate the economy. d. An increase in the price of burritos will cause an increase in consumer demand for music downloads. 30
  • 31.
    Active Learning 3Answers a. Prices rise when the government increases the quantity of money. Positive – describes a relationship, could use data to confirm or refute. b. The government should print less money. Normative – this is a value judgment, cannot be confirmed or refuted. 31
  • 32.
    Active Learning 3Answers c. A tax cut is needed to stimulate the economy. Normative – another value judgment. d. An increase in the price of burritos will cause an increase in consumer demand for music downloads Positive – describes a relationship. Note that a statement need not be true to be positive. 32
  • 33.
    Why Economists Disagree Economists often give conflicting policy advice – Can disagree about the validity of alternative positive theories about the world – May have different values and, therefore, different normative views about what policy should try to accomplish  Yet, there are many propositions about which most economists agree 33
  • 34.
    So, Why Economistsdisagree?  Differences in scientific judgments  Differences in values  Perception versus reality 34
  • 35.
    Summary • Economists arescientists – Make appropriate assumptions and build simplified models – The circular-flow diagram and the production possibilities frontier • Micro economists study decision making by households and firms and their interactions in the marketplace • Macroeconomists study the forces and trends that affect the economy as a whole 35
  • 36.
    Summary • A positivestatement is an assertion about how the world is • A normative statement is an assertion about how the world ought to be • As policy advisers, economists make normative statements • Economists sometimes offer conflicting advice – Differences in scientific judgments – Differences in values 36
  • 37.