1. Comparison of tern nesting habitat composition in Southern New England
Mary Grande1, Peter Paton, Ph.D.2, and Kevin Rogers3
1Coastal Fellow, University of Rhode Island, 2 Professor, University of Rhode Island, Natural Resources Science, 3M.S. Candidate, University of Rhode Island
Introduction
Common Terns (Sterna hirundo) and Roseate Terns (Sterna dougallii) are important components of the
New England coastal ecosystem. These two species nest sympatrically on predator-free offshore
islands throughout New England, but differ significantly in their nest site preferences. Common Terns
(COTE) prefer open nest sites, either on sand or gravel, surrounded by sparse vegetation. Conversely,
Roseate Terns (ROST) prefer to nest under dense vegetation, such as seaside goldenrod (Solidago
sempervirens), in nest boxes, or under large boulders which provide greater nest camouflage from
above (Burger and Gochfeld 1988). Approximately 80,000 pairs of Common Terns nest along the
Northeast Atlantic Coast, whereas there are less than 2,500 pairs of the federally-endangered Roseate
Tern. With the spread of many species of invasive plants, managers of tern colonies in the Northeast
face many challenges in maintaining suitable nesting habitat for these two species.
We conducted field work at the following tern colonies:
• Great Gull Island, Southold, NY: Managed by the American Museum of Natural History
• Monomoy National Wildlife Refuge, Chatham, MA: Managed by the U.S. Fish & Wildlife Service
• Bird Island, Marion MA: Managed by the Massachusetts Division of Fisheries & Wildlife
• Ram Island, Marion, MA: Managed by the Massachusetts Division of Fisheries & Wildlife
The purpose of this study was to evaluate and compare the vegetative composition of four tern colonies
in the Northeast (Figure 1). By conducting these habitat surveys, we hope to gain more insight into the
similarities and differences among colonies, as well as identify the distribution of invasive plant
species within the colonies to develop management strategies.
Methods
We placed a 1-m2 PVC quadrat at nest sites and random points (Figure 4) in order to document
vegetation composition at each location. For each quadrat, the following data were collected:
• UTM coordinates, taken and stored with a handheld GPS unit
• Substrate (soil, sand, bare rock, etc.) on which the nest or point was located
• Nest number (if available) as determined by the colony census
• Digital reference photo taken at a fixed height to estimate % vegetation coverage
• Percent cover of each plant species within each quadrant according to the Braun-Blanquet scale
• For Roseate Tern nests only, the presence or absence of a human-established shelter
The number of nest and random sites varied among islands, mostly because of nest availability,
accessibility, and time constraints. For example, Monomoy National Wildlife Refuge only had 8 active
Roseate Tern nests.
Site COTE nests sampled ROST nests sampled Random points
sampled
Bird 20 25 23
Great Gull 40 54 15
Monomoy 35 8 35
Ram 20 16 15
Figure 2. Common Tern
Figure 3. Roseate TernFigure 1. Map of four study sites in Southern New England
M. Grande
M. Grande
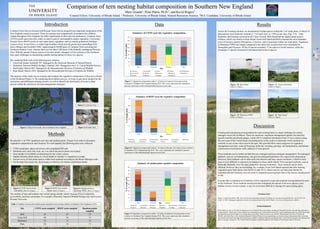
Data Results
Across all 4 nesting colonies, we documented 34 plant species within the 1-m2 study plots, of which 16
plant species were relatively common (> 2 or more sites, or >30% at one sites; Figs. 7-9). Only
Raphanus and Solidago occurred at all 4 sites. Overall, Bird Island had the highest plant species
richness, which was similar to Ram Island. Great Gull Island and Bird contained the most abundant
cover of invasive species (Phragmites, Celastrus, and Cynanchum) within our study plots. Vegetation
at Monomoy NWR was unique compared to the other sites, as plots there were dominated by
Ammophila and Pityopsis. Of the 34 species recorded, 17 are native to North America, while the
remaining 17 species consisted of introduced and invasive species.
Discussion
Creating and maintaining nesting habitat for open-nesting birds is a major challenge for colony
managers across the Northeast. There are numerous vegetation management options, but each has
specific benefits and disadvantages. Lamb (2011) compiled information from 23 tern colonies along
the east coast of the United States (including those in this study) to determine which methods are
currently in use or have been used in the past. She specified three main categories of vegetation
management activities: removal (burning, herbicide, weeding, grazing), soil manipulation, and habitat
construction (weed barrier cloth, addition of stone/gravel).
These methods can be further divided into pre-emergent and post-emergent management. Pre-emergent
methods, such as soil manipulation, can prevent subsequent problems like rapid weed colonization.
However, these methods can be labor and cost intensive and may require machinery, which in most
cases is very difficult or expensive to transport to these small islands. Post-emergent methods, such as
herbicide treatment, were the most commonly reported treatments. These methods can be fairly
efficient; however, they are not lasting. For example, Great Gull Island reported that after burning,
vegetation grew back denser than before (Lamb 2011). Hand removal can help clear habitat for
courtship and nest initiation, but can result in vegetation growing back later in the season, causing nests
to fail.
It seems that a combination of methods will be required to create and maintain nesting habitat for terns
in the Northeast. These methods should prioritize mitigating the spread of invasive species; once
habitat is lost to invasive plants, it may be even more difficult to manage for open nesting space.
Literature Cited
Burger, J. and M. Gochfeld. 1988. Nest-site selection and temporal patterns in habitat use of roseate and common terns. Auk 105:433-438.
Lamb, J.S. 2011. Managing vegetation to restore tern nesting habitat in the Gulf of Maine. University of Massachusetts Amherst.
Acknowledgments
Many thanks are due to Dr. Paton for taking me on as a Coastal Fellow this summer, guiding me through the project, and offering sound advice
on data analysis. Thanks also to Kevin Rogers for welcoming me as a field assistant for his M.S. project, helping me gain lots of bird knowledge,
and taking the best possible photo of a tern perching on my head. Thank you also to the USFWS, Massachusetts Division of Fisheries &
Wildlife, and Helen Hays of the American Museum of Natural History for accommodating our research and providing transportation, housing,
and valuable information throughout the field season. Thanks to Brianne Neptin for coordinating the Coastal Fellows Program and offering great
advice on poster construction. The Coastal Fellows Program is funded through the URI College of Environment and Life Sciences.
Figure 4. COTE nest at Great
Gull Island. (Photo: K. Rogers)
Figure 5. ROST nest at Bird
Island. (Photo: K. Rogers)
Figure 6. Random point at
Monomoy NWR. (Photo: K. Rogers)
Table 1. Number of nests and random points sampled at tern nesting colonies in Southern New England in 2014.
Figure 7. Vegetation composition within 1 m2 plots at Common Tern nests at four
colonies in Southern New England during 2014. The y-axis represents the cumulative
percent occurrence of the indicated plant species at nest sites.
0
20
40
60
80
100
120
140
160
Bird Great Gull Monomoy Ram
%ofsampleplots
Site
Summary of COTE nest site vegetative composition
Ambrosia Ammophila Cakile Celastrus Chenopodium
Convolvulus Lathyrus Persicaria Phragmites Phytolacca
Pityopsis Raphanus Solidago Spergularia
0
20
40
60
80
100
120
140
160
180
200
Bird Great Gull Monomoy Ram
%ofsampleplots
Site
Summary of random point vegetative composition
Ambrosia Ammophila Capsella Celastrus Chenopodium Convolvulus
Lathyrus Persicaria Pityopsis Raphanus Solidago Spergularia
0
50
100
150
200
250
Bird Great Gull Monomoy Ram
%ofsampleplots
Site
Summary of ROST nest site vegetative composition
Ambrosia Ammophila Chenopodium Convolvulus Cynanchum Persicaria
Phragmites Phytolacca Raphanus Rumex Solidago
Figure 8. Vegetation composition within 1 m2 plots at Roseate Tern nests at four colonies
in Southern New England during 2014. The y-axis represents the cumulative percent
occurrence of the indicated plant species at nest sites.
Figure 9. Vegetation composition within 1 m2 plots at randomly located points at four
colonies in Southern New England during 2014. The y-axis represents the cumulative
percent occurrence of the indicated plant species at nest sites.
Figure 10. Bird Island
(Photo: K. Rogers)
Figure 11. Great Gull Island
(Photo: K. Rogers)
Figure 12. Monomoy NWR
(Photo: K. Rogers)
Figure 13: Ram Island
(Photo: K. Rogers)