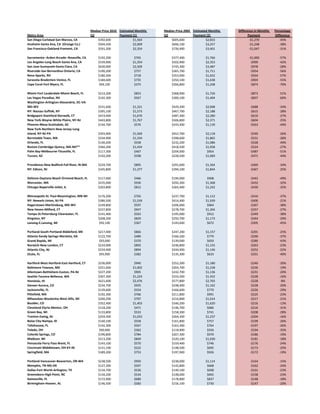
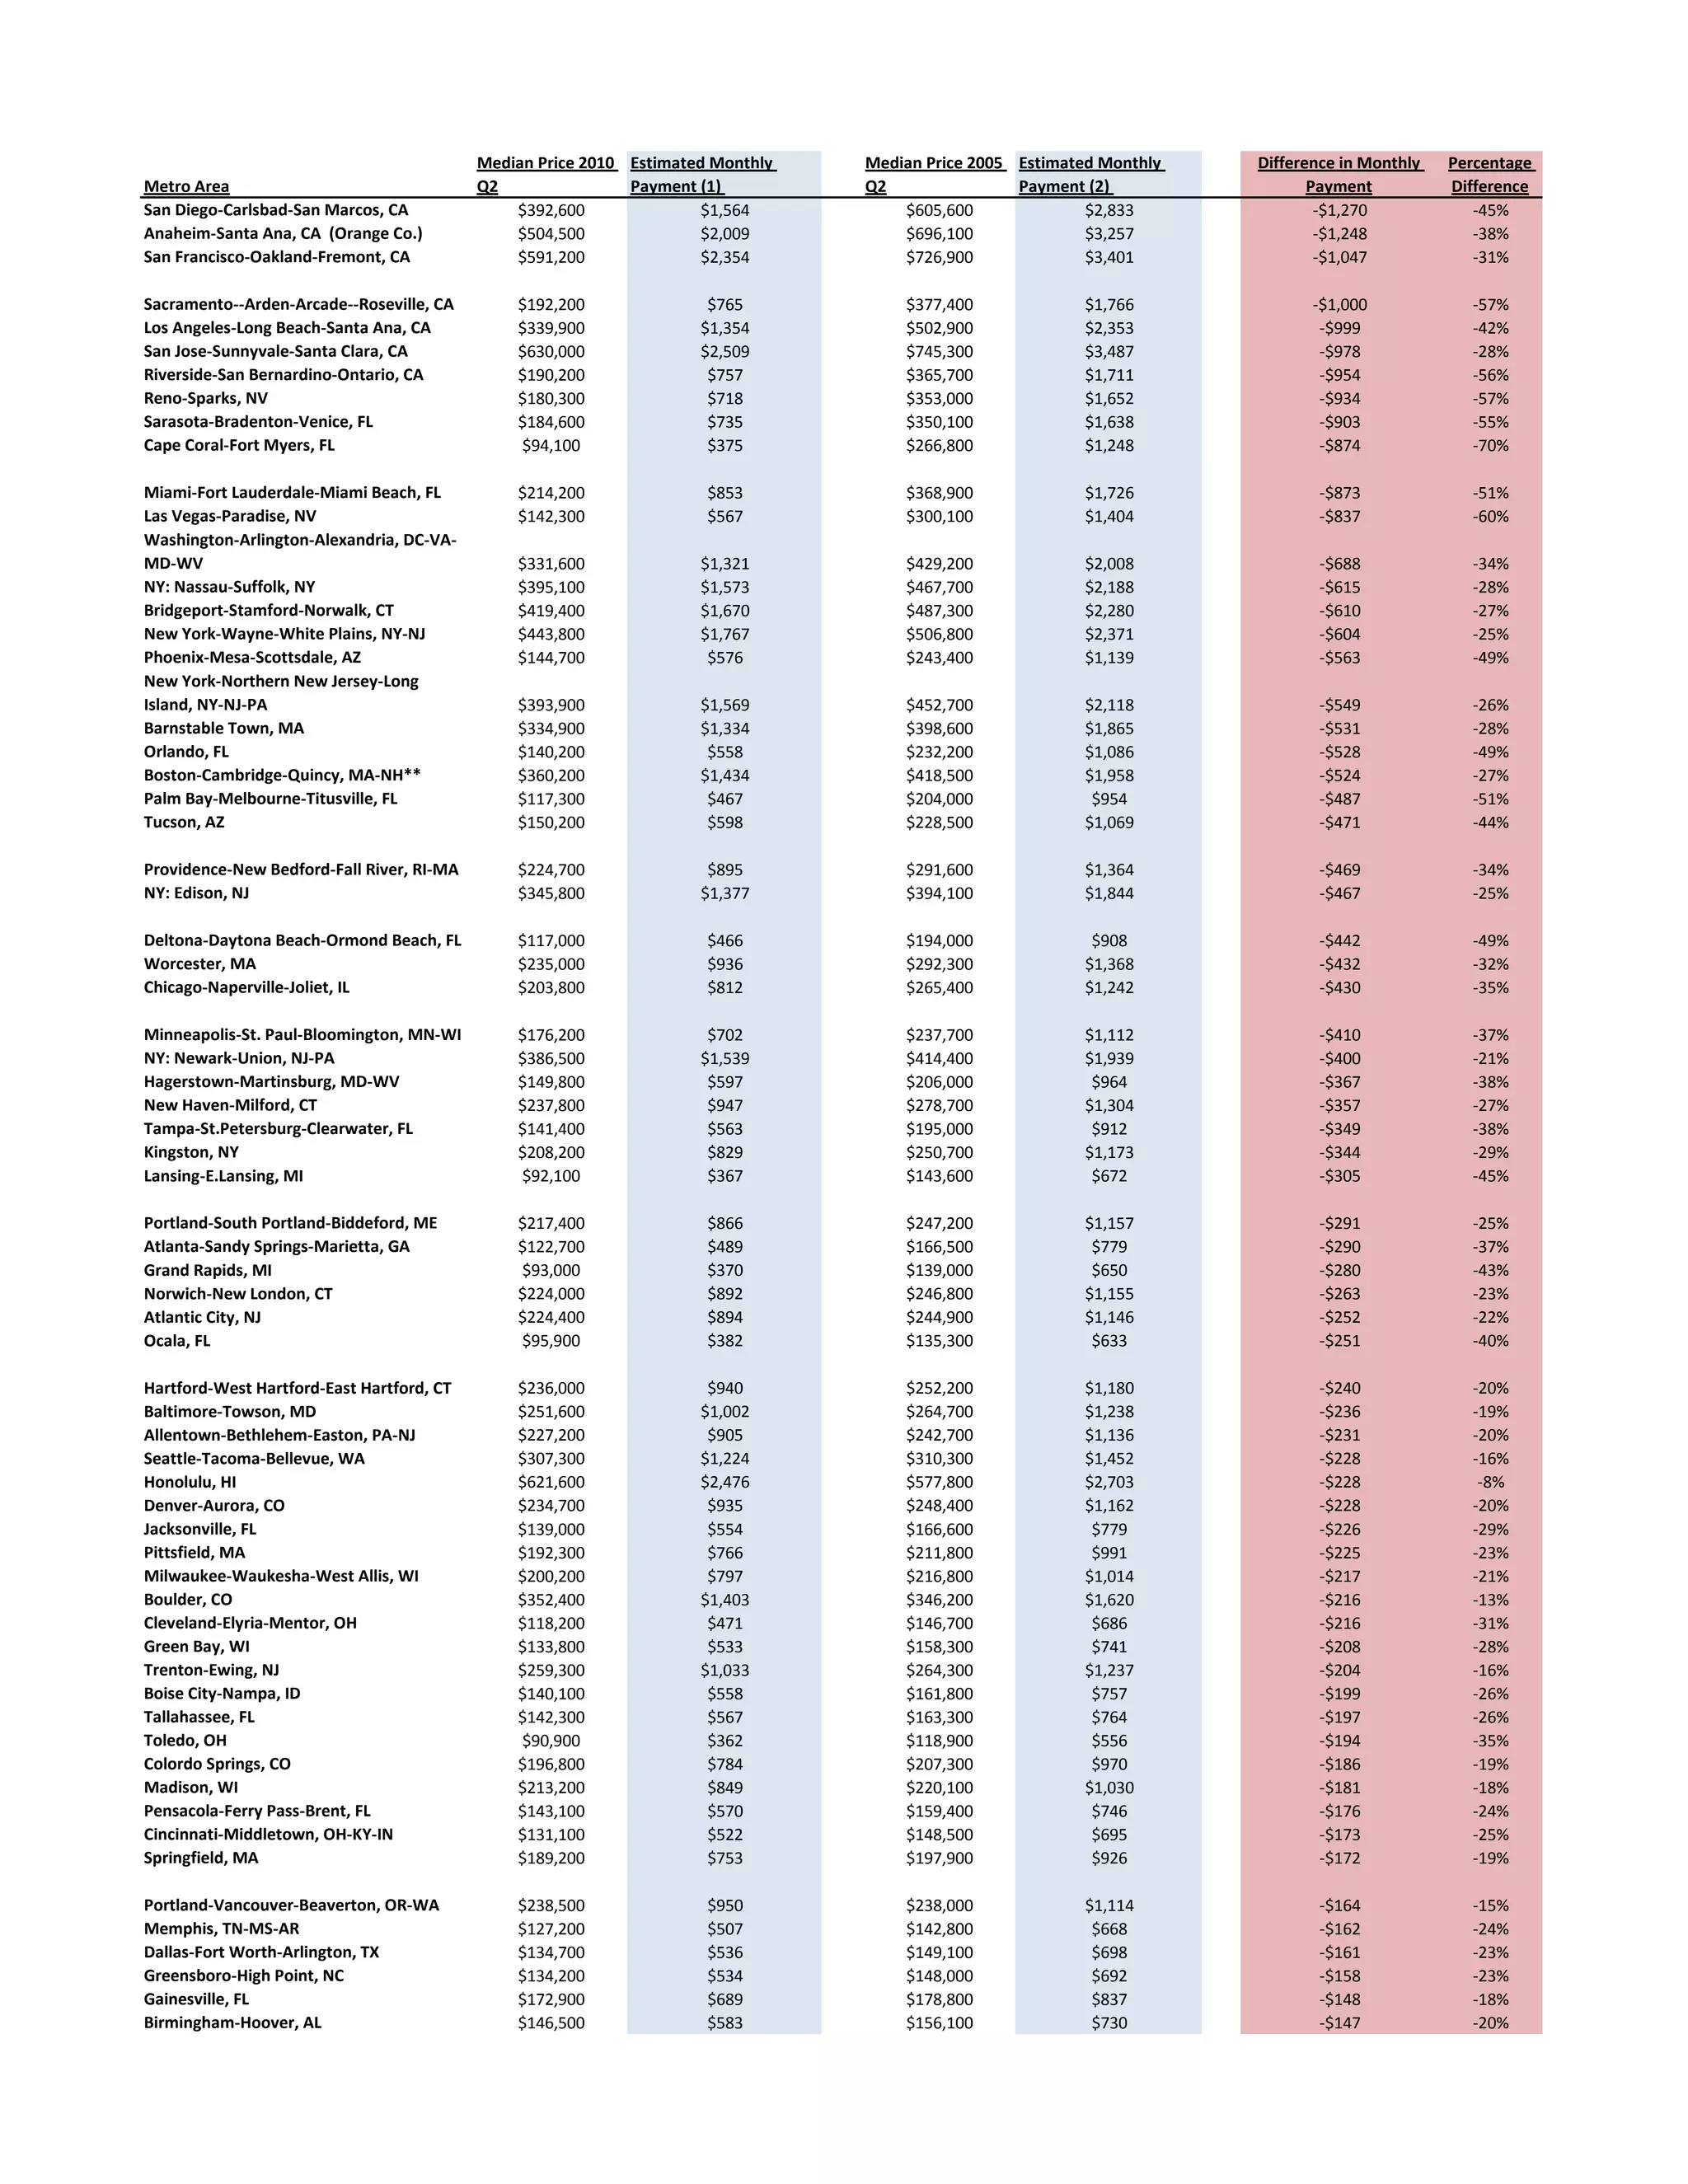
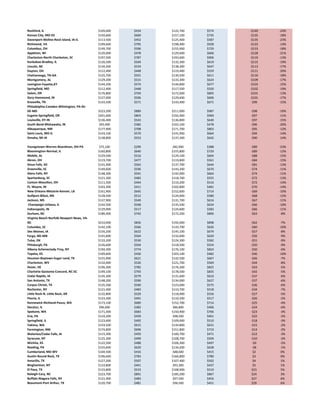
SlideShare a Scribd company logo
Median Price 2010 Estimated Monthly   Median Price 2005 Estimated Monthly   Difference in Monthly   Percentage
Metro Area                                 Q2                Payment (1)         Q2                Payment (2)                Payment          Difference
San Diego-Carlsbad-San Marcos, CA              $392,600               $1,564         $605,600              $2,833              -$1,270            -45%
Anaheim-Santa Ana, CA (Orange Co.)             $504,500               $2,009         $696,100              $3,257              -$1,248            -38%
San Francisco-Oakland-Fremont, CA              $591,200               $2,354         $726,900              $3,401              -$1,047            -31%

Sacramento--Arden-Arcade--Roseville, CA        $192,200               $765           $377,400              $1,766             -$1,000            -57%
Los Angeles-Long Beach-Santa Ana, CA           $339,900              $1,354          $502,900              $2,353              -$999             -42%
San Jose-Sunnyvale-Santa Clara, CA             $630,000              $2,509          $745,300              $3,487              -$978             -28%
Riverside-San Bernardino-Ontario, CA           $190,200               $757           $365,700              $1,711              -$954             -56%
Reno-Sparks, NV                                $180,300               $718           $353,000              $1,652              -$934             -57%
Sarasota-Bradenton-Venice, FL                  $184,600               $735           $350,100              $1,638              -$903             -55%
Cape Coral-Fort Myers, FL                      $94,100                $375           $266,800              $1,248              -$874             -70%

Miami-Fort Lauderdale-Miami Beach, FL          $214,200               $853           $368,900              $1,726             -$873              -51%
Las Vegas-Paradise, NV                         $142,300               $567           $300,100              $1,404             -$837              -60%
Washington-Arlington-Alexandria, DC-VA-
MD-WV                                          $331,600              $1,321          $429,200              $2,008             -$688              -34%
NY: Nassau-Suffolk, NY                         $395,100              $1,573          $467,700              $2,188             -$615              -28%
Bridgeport-Stamford-Norwalk, CT                $419,400              $1,670          $487,300              $2,280             -$610              -27%
New York-Wayne-White Plains, NY-NJ             $443,800              $1,767          $506,800              $2,371             -$604              -25%
Phoenix-Mesa-Scottsdale, AZ                    $144,700               $576           $243,400              $1,139             -$563              -49%
New York-Northern New Jersey-Long
Island, NY-NJ-PA                               $393,900              $1,569          $452,700              $2,118             -$549              -26%
Barnstable Town, MA                            $334,900              $1,334          $398,600              $1,865             -$531              -28%
Orlando, FL                                    $140,200               $558           $232,200              $1,086             -$528              -49%
Boston-Cambridge-Quincy, MA-NH**               $360,200              $1,434          $418,500              $1,958             -$524              -27%
Palm Bay-Melbourne-Titusville, FL              $117,300               $467           $204,000               $954              -$487              -51%
Tucson, AZ                                     $150,200               $598           $228,500              $1,069             -$471              -44%

Providence-New Bedford-Fall River, RI-MA       $224,700               $895           $291,600              $1,364             -$469              -34%
NY: Edison, NJ                                 $345,800              $1,377          $394,100              $1,844             -$467              -25%

Deltona-Daytona Beach-Ormond Beach, FL         $117,000               $466           $194,000               $908              -$442              -49%
Worcester, MA                                  $235,000               $936           $292,300              $1,368             -$432              -32%
Chicago-Naperville-Joliet, IL                  $203,800               $812           $265,400              $1,242             -$430              -35%

Minneapolis-St. Paul-Bloomington, MN-WI        $176,200               $702           $237,700              $1,112             -$410              -37%
NY: Newark-Union, NJ-PA                        $386,500              $1,539          $414,400              $1,939             -$400              -21%
Hagerstown-Martinsburg, MD-WV                  $149,800               $597           $206,000               $964              -$367              -38%
New Haven-Milford, CT                          $237,800               $947           $278,700              $1,304             -$357              -27%
Tampa-St.Petersburg-Clearwater, FL             $141,400               $563           $195,000               $912              -$349              -38%
Kingston, NY                                   $208,200               $829           $250,700              $1,173             -$344              -29%
Lansing-E.Lansing, MI                          $92,100                $367           $143,600               $672              -$305              -45%

Portland-South Portland-Biddeford, ME          $217,400               $866           $247,200              $1,157             -$291              -25%
Atlanta-Sandy Springs-Marietta, GA             $122,700               $489           $166,500               $779              -$290              -37%
Grand Rapids, MI                               $93,000                $370           $139,000               $650              -$280              -43%
Norwich-New London, CT                         $224,000               $892           $246,800              $1,155             -$263              -23%
Atlantic City, NJ                              $224,400               $894           $244,900              $1,146             -$252              -22%
Ocala, FL                                      $95,900                $382           $135,300               $633              -$251              -40%

Hartford-West Hartford-East Hartford, CT       $236,000               $940           $252,200              $1,180             -$240              -20%
Baltimore-Towson, MD                           $251,600              $1,002          $264,700              $1,238             -$236              -19%
Allentown-Bethlehem-Easton, PA-NJ              $227,200               $905           $242,700              $1,136             -$231              -20%
Seattle-Tacoma-Bellevue, WA                    $307,300              $1,224          $310,300              $1,452             -$228              -16%
Honolulu, HI                                   $621,600              $2,476          $577,800              $2,703             -$228               -8%
Denver-Aurora, CO                              $234,700               $935           $248,400              $1,162             -$228              -20%
Jacksonville, FL                               $139,000               $554           $166,600               $779              -$226              -29%
Pittsfield, MA                                 $192,300               $766           $211,800               $991              -$225              -23%
Milwaukee-Waukesha-West Allis, WI              $200,200               $797           $216,800              $1,014             -$217              -21%
Boulder, CO                                    $352,400              $1,403          $346,200              $1,620             -$216              -13%
Cleveland-Elyria-Mentor, OH                    $118,200               $471           $146,700               $686              -$216              -31%
Green Bay, WI                                  $133,800               $533           $158,300               $741              -$208              -28%
Trenton-Ewing, NJ                              $259,300              $1,033          $264,300              $1,237             -$204              -16%
Boise City-Nampa, ID                           $140,100               $558           $161,800               $757              -$199              -26%
Tallahassee, FL                                $142,300               $567           $163,300               $764              -$197              -26%
Toledo, OH                                     $90,900                $362           $118,900               $556              -$194              -35%
Colordo Springs, CO                            $196,800               $784           $207,300               $970              -$186              -19%
Madison, WI                                    $213,200               $849           $220,100              $1,030             -$181              -18%
Pensacola-Ferry Pass-Brent, FL                 $143,100               $570           $159,400               $746              -$176              -24%
Cincinnati-Middletown, OH-KY-IN                $131,100               $522           $148,500               $695              -$173              -25%
Springfield, MA                                $189,200               $753           $197,900               $926              -$172              -19%

Portland-Vancouver-Beaverton, OR-WA            $238,500               $950           $238,000              $1,114             -$164              -15%
Memphis, TN-MS-AR                              $127,200               $507           $142,800               $668              -$162              -24%
Dallas-Fort Worth-Arlington, TX                $134,700               $536           $149,100               $698              -$161              -23%
Greensboro-High Point, NC                      $134,200               $534           $148,000               $692              -$158              -23%
Gainesville, FL                                $172,900               $689           $178,800               $837              -$148              -18%
Birmingham-Hoover, AL                          $146,500               $583           $156,100               $730              -$147              -20%
Rockford, IL                               $109,000   $434   $122,700   $574   -$140   -24%
Kansas City, MO-KS                         $150,600   $600   $157,100   $735   -$135   -18%
Davenport-Moline-Rock Island, IA-IL        $113,500   $452   $125,400   $587   -$135   -23%
Richmond, VA                               $199,600   $795   $198,400   $928   -$133   -14%
Columbus, OH                               $149,700   $596   $155,900   $729   -$133   -18%
Appleton, WI                               $120,000   $478   $129,600   $606   -$128   -21%
Charleston-North Charleston, SC            $197,500   $787   $193,600   $906   -$119   -13%
Kankakee-Bradley, IL                       $126,500   $504   $132,300   $619   -$115   -19%
Lincoln, NE                                $134,200   $534   $138,300   $647   -$113   -17%
Dayton, OH                                 $112,400   $448   $119,400   $559   -$111   -20%
Chattanooga, TN-GA                         $125,700   $501   $130,500   $611   -$110   -18%
Montgomery, AL                             $129,200   $515   $133,300   $624   -$109   -17%
Lexington-Fayette,KY                       $144,200   $574   $144,800   $677   -$103   -15%
Springfield, MO                            $112,400   $448   $117,500   $550   -$102   -19%
Salem, OR                                  $176,800   $704   $172,000   $805   -$101   -13%
Gary-Hammond, IN                           $127,000   $506   $129,600   $606   -$101   -17%
Knoxville, TN                              $143,500   $571   $143,400   $671    -$99   -15%
Philadelphia-Camden-Wilmington, PA-NJ-
DE-MD                                      $223,200   $889   $211,000   $987   -$98    -10%
Eugene-Springfield, OR                     $201,600   $803   $192,400   $900   -$97    -11%
Louisville, KY-IN                          $136,400   $543   $136,800   $640   -$97    -15%
South Bend-Mishawaka, IN                   $95,900    $382   $102,100   $478   -$96    -20%
Albuquerque, NM                            $177,900   $708   $171,700   $803   -$95    -12%
Saint Louis, MO-IL                         $143,100   $570   $141,900   $664   -$94    -14%
Omaha, NE-IA                               $138,800   $553   $137,300   $642   -$90    -14%

Youngstown-Warren-Boardman, OH-PA          $75,100    $299   $82,900    $388   -$89    -23%
Bloomington-Normal, IL                     $160,800   $640   $155,800   $729   -$89    -12%
Mobile, AL                                 $129,500   $516   $129,100   $604   -$88    -15%
Akron, OH                                  $119,700   $477   $119,800   $561   -$84    -15%
Sioux Falls, SD                            $141,400   $563   $137,700   $644   -$81    -13%
Greenville, SC                             $149,600   $596   $143,200   $670   -$74    -11%
Glens Falls, NY                            $148,300   $591   $142,000   $664   -$74    -11%
Spartanburg, SC                            $121,300   $483   $118,700   $555   -$72    -13%
Canton-Massillon, OH                       $111,500   $444   $110,200   $516   -$72    -14%
Ft. Wayne, IN                              $103,300   $411   $102,800   $481   -$70    -14%
New Orleans-Metairie-Kenner, LA            $161,900   $645   $152,600   $714   -$69    -10%
Gulfport-Biloxi, MS                        $128,500   $512   $124,000   $580   -$68    -12%
Jackson, MS                                $137,900   $549   $131,700   $616   -$67    -11%
 Champaign-Urbana, IL                      $142,500   $568   $135,500   $634   -$66    -10%
Indianapolis, IN                           $129,900   $517   $124,600   $583   -$66    -11%
Durham, NC                                 $186,400   $742   $172,200   $806   -$63     -8%
Virginia Beach-Norfolk-Newport News, VA-
NC                                         $210,000   $836   $192,000   $898   -$62     -7%
Columbia, SC                               $142,100   $566   $133,700   $626   -$60    -10%
Des Moines, IA                             $156,200   $622   $145,100   $679   -$57     -8%
Fargo, ND-MN                               $141,600   $564   $132,600   $620   -$56     -9%
Tulsa, OK                                  $133,200   $530   $124,300   $582   -$51     -9%
Pittsburgh, PA                             $126,600   $504   $118,500   $554   -$50     -9%
Albany-Schenectady-Troy, NY                $194,300   $774   $176,100   $824   -$50     -6%
Topeka, KS                                 $109,600   $436   $103,100   $482   -$46    -10%
Houston-Baytown-Sugar Land, TX             $155,900   $621   $142,500   $667   -$46     -7%
Charleston, WV                             $132,000   $526   $121,700   $569   -$44     -8%
Dover, DE                                  $196,300   $782   $176,300   $825   -$43     -5%
Charlotte-Gastonia-Concord, NC-SC          $199,100   $793   $178,500   $835   -$42     -5%
Cedar Rapids, IA                           $145,300   $579   $131,600   $616   -$37     -6%
San Antonio, TX                            $148,200   $590   $134,000   $627   -$37     -6%
Corpus Christi, TX                         $135,500   $540   $123,000   $575   -$36     -6%
Rochester, NY                              $121,400   $483   $110,700   $518   -$34     -7%
Little Rock-N. Little Rock, AR             $132,800   $529   $118,900   $556   -$27     -5%
Peoria, IL                                 $123,300   $491   $110,500   $517   -$26     -5%
Kennewick-Richland-Pasco, WA               $173,100   $689   $152,700   $714   -$25     -4%
Decatur, IL                                $96,000    $382   $86,800    $406   -$24     -6%
Spokane, WA                                $171,400   $683   $150,900   $706   -$23     -3%
Erie, PA                                   $110,200   $439   $98,500    $461   -$22     -5%
Springfield, IL                            $123,600   $492   $109,000   $510   -$18     -3%
Yakima, WA                                 $154,500   $615   $134,800   $631   -$15     -2%
Farmington, NM                             $174,800   $696   $151,800   $710   -$14     -2%
Waterloo/Cedar Falls, IA                   $115,300   $459   $100,700   $471   -$12     -3%
Syracuse, NY                               $125,300   $499   $108,700   $509   -$10     -2%
Wichita, KS                                $122,500   $488   $106,300   $497    -$9     -2%
Reading, PA                                $155,600   $620   $134,200   $628    -$8     -1%
Cumberland, MD-WV                          $104,500   $416   $88,600    $415     $2     0%
Austin-Round Rock, TX                      $196,600   $783   $166,800   $780     $3     0%
Amarillo, TX                               $127,200   $507   $107,400   $502     $4     1%
Binghamton, NY                             $110,800   $441   $93,300    $437     $5     1%
El Paso, TX                                $133,800   $533   $108,900   $510   $23      5%
Raleigh-Cary, NC                           $223,700   $891   $185,200   $867   $24      3%
Buffalo-Niagara Falls, NY                  $121,400   $483   $97,500    $456   $27      6%
Beaumont-Port Arthur, TX                   $120,700   $481   $96,500    $451   $29      6%
Salt Lake City, UT                       $207,300   $826   $169,900   $795   $31   4%
Elmira, NY                               $99,200    $395   $77,700    $364   $32   9%
Shreveport-Bossier City, LA              $155,900   $621   $125,100   $585   $36   6%
Baton Rouge, LA                          $170,400   $679   $135,400   $634   $45   7%
Oklahoma City, OK                        $149,900   $597   $115,700   $541   $56   10%
Bismarck, ND                             $163,100   $650   $121,500   $568   $81   14%

(1) Assumes 20 percent downpayment and
30-year fixed mortgage of 4.35%
(September 2010 avg)
(2) Assumes 20 percent downpayment and
30-year fixed mortgage of 5.77%
(September 2005 avg)

More Related Content

What's hot

Math in the News: 11/21/11
Math in the News: 11/21/11Math in the News: 11/21/11
Math in the News: 11/21/11
Media4math
 
Solar Schools: Potential Savings by District
Solar Schools: Potential Savings by DistrictSolar Schools: Potential Savings by District
Solar Schools: Potential Savings by District
The Solar Foundation
 
Federal Budget Outlays
Federal Budget OutlaysFederal Budget Outlays
Federal Budget Outlays
brucekaufman
 
Vancouver real estate rebgv stats package january 2011
Vancouver real estate rebgv stats package january 2011Vancouver real estate rebgv stats package january 2011
Vancouver real estate rebgv stats package january 2011
Matt Collinge
 
H W 2010 Q3 De 12 Mo
H W 2010 Q3 De 12 MoH W 2010 Q3 De 12 Mo
H W 2010 Q3 De 12 Mochipwags
 
Rebgv stats package%2_c_october_2011_%282%29
Rebgv stats package%2_c_october_2011_%282%29Rebgv stats package%2_c_october_2011_%282%29
Rebgv stats package%2_c_october_2011_%282%29
vancouverhomesteam
 
October 2011 REBGV Stats Mike Stewart
October 2011 REBGV Stats Mike StewartOctober 2011 REBGV Stats Mike Stewart
October 2011 REBGV Stats Mike Stewart
Mike Stewart
 
Tax Deferred Investing
Tax Deferred InvestingTax Deferred Investing
Tax Deferred Investing
hlazarus
 
Chicagoland Quarterly Supply/Demand Report - 7/1/2011
Chicagoland Quarterly Supply/Demand Report - 7/1/2011Chicagoland Quarterly Supply/Demand Report - 7/1/2011
Chicagoland Quarterly Supply/Demand Report - 7/1/2011
chipwags
 
Cuadro nomina.
Cuadro nomina.Cuadro nomina.
Cuadro nomina.KarenOyola
 
Dsh summary
Dsh summaryDsh summary
Dsh summarysoder145
 

What's hot (12)

103
103103
103
 
Math in the News: 11/21/11
Math in the News: 11/21/11Math in the News: 11/21/11
Math in the News: 11/21/11
 
Solar Schools: Potential Savings by District
Solar Schools: Potential Savings by DistrictSolar Schools: Potential Savings by District
Solar Schools: Potential Savings by District
 
Federal Budget Outlays
Federal Budget OutlaysFederal Budget Outlays
Federal Budget Outlays
 
Vancouver real estate rebgv stats package january 2011
Vancouver real estate rebgv stats package january 2011Vancouver real estate rebgv stats package january 2011
Vancouver real estate rebgv stats package january 2011
 
H W 2010 Q3 De 12 Mo
H W 2010 Q3 De 12 MoH W 2010 Q3 De 12 Mo
H W 2010 Q3 De 12 Mo
 
Rebgv stats package%2_c_october_2011_%282%29
Rebgv stats package%2_c_october_2011_%282%29Rebgv stats package%2_c_october_2011_%282%29
Rebgv stats package%2_c_october_2011_%282%29
 
October 2011 REBGV Stats Mike Stewart
October 2011 REBGV Stats Mike StewartOctober 2011 REBGV Stats Mike Stewart
October 2011 REBGV Stats Mike Stewart
 
Tax Deferred Investing
Tax Deferred InvestingTax Deferred Investing
Tax Deferred Investing
 
Chicagoland Quarterly Supply/Demand Report - 7/1/2011
Chicagoland Quarterly Supply/Demand Report - 7/1/2011Chicagoland Quarterly Supply/Demand Report - 7/1/2011
Chicagoland Quarterly Supply/Demand Report - 7/1/2011
 
Cuadro nomina.
Cuadro nomina.Cuadro nomina.
Cuadro nomina.
 
Dsh summary
Dsh summaryDsh summary
Dsh summary
 

Viewers also liked

Economic Indicators for Week of September 27-October 1, 2010
Economic Indicators for Week of September 27-October 1, 2010Economic Indicators for Week of September 27-October 1, 2010
Economic Indicators for Week of September 27-October 1, 2010
NAR Research
 
AÑO NUEVO - VIDA NUEVA
AÑO NUEVO - VIDA NUEVAAÑO NUEVO - VIDA NUEVA
AÑO NUEVO - VIDA NUEVA
BETTY16
 
Put Social Media to Work for You and Your Organization
Put Social Media to Work for You and Your OrganizationPut Social Media to Work for You and Your Organization
Put Social Media to Work for You and Your OrganizationKatherine Swartz Hilton
 
Annotating 5 different creative media events
Annotating 5 different creative media eventsAnnotating 5 different creative media events
Annotating 5 different creative media eventsloganjones07
 
Challenges and Opportunities for the Local Enterprise Partnerships
Challenges and Opportunities for the Local Enterprise PartnershipsChallenges and Opportunities for the Local Enterprise Partnerships
Challenges and Opportunities for the Local Enterprise Partnerships
Martin Dare-Edwards
 
Persecuted and Forgotten?
Persecuted and Forgotten? Persecuted and Forgotten?
Persecuted and Forgotten?
Anochi.com.
 
Inflation Watch for January, 2011
Inflation Watch for January, 2011Inflation Watch for January, 2011
Inflation Watch for January, 2011NAR Research
 
Metro Area Unemployment
Metro Area UnemploymentMetro Area Unemployment
Metro Area UnemploymentNAR Research
 
Webinar: 2010 NAR Profile of Home Buyers and Sellers Highlights
Webinar: 2010 NAR Profile of Home Buyers and Sellers HighlightsWebinar: 2010 NAR Profile of Home Buyers and Sellers Highlights
Webinar: 2010 NAR Profile of Home Buyers and Sellers Highlights
NAR Research
 
Economic Indicators for Week of December 20-23, 2010
Economic Indicators for Week of December 20-23, 2010Economic Indicators for Week of December 20-23, 2010
Economic Indicators for Week of December 20-23, 2010
NAR Research
 
Summary of NOVEMBER 2010 Existing Home Sales Statistics
Summary of NOVEMBER 2010 Existing Home Sales StatisticsSummary of NOVEMBER 2010 Existing Home Sales Statistics
Summary of NOVEMBER 2010 Existing Home Sales Statistics
NAR Research
 
Economic Indicators for week of August 30-September 3, 2010
Economic Indicators for week of August 30-September 3, 2010Economic Indicators for week of August 30-September 3, 2010
Economic Indicators for week of August 30-September 3, 2010
NAR Research
 
O Serviço Social na área da Educação: perspectivas e desafios
O Serviço Social na área da Educação: perspectivas e desafiosO Serviço Social na área da Educação: perspectivas e desafios
O Serviço Social na área da Educação: perspectivas e desafios
CRESS-MG
 
Recursosdelageosfera (fil eminimizer)
Recursosdelageosfera (fil eminimizer)Recursosdelageosfera (fil eminimizer)
Recursosdelageosfera (fil eminimizer)pallfu
 
..... :)
..... :)..... :)
..... :)
Nailabarrios
 
Para empezar
Para empezarPara empezar
Para empezar
dianagomezrios
 
Pdot g royal-enclave
Pdot g royal-enclavePdot g royal-enclave
Pdot g royal-enclavenelsonlevi
 
Nuestro instituto - Biel y Àlex
Nuestro instituto - Biel y ÀlexNuestro instituto - Biel y Àlex
Nuestro instituto - Biel y Àlexeyc2eso
 
20120516 jawsug sapporo_updates
20120516 jawsug sapporo_updates20120516 jawsug sapporo_updates
20120516 jawsug sapporo_updatesYasuhiro Horiuchi
 

Viewers also liked (20)

Economic Indicators for Week of September 27-October 1, 2010
Economic Indicators for Week of September 27-October 1, 2010Economic Indicators for Week of September 27-October 1, 2010
Economic Indicators for Week of September 27-October 1, 2010
 
AÑO NUEVO - VIDA NUEVA
AÑO NUEVO - VIDA NUEVAAÑO NUEVO - VIDA NUEVA
AÑO NUEVO - VIDA NUEVA
 
Put Social Media to Work for You and Your Organization
Put Social Media to Work for You and Your OrganizationPut Social Media to Work for You and Your Organization
Put Social Media to Work for You and Your Organization
 
Annotating 5 different creative media events
Annotating 5 different creative media eventsAnnotating 5 different creative media events
Annotating 5 different creative media events
 
Challenges and Opportunities for the Local Enterprise Partnerships
Challenges and Opportunities for the Local Enterprise PartnershipsChallenges and Opportunities for the Local Enterprise Partnerships
Challenges and Opportunities for the Local Enterprise Partnerships
 
Persecuted and Forgotten?
Persecuted and Forgotten? Persecuted and Forgotten?
Persecuted and Forgotten?
 
Inflation Watch for January, 2011
Inflation Watch for January, 2011Inflation Watch for January, 2011
Inflation Watch for January, 2011
 
Metro Area Unemployment
Metro Area UnemploymentMetro Area Unemployment
Metro Area Unemployment
 
Webinar: 2010 NAR Profile of Home Buyers and Sellers Highlights
Webinar: 2010 NAR Profile of Home Buyers and Sellers HighlightsWebinar: 2010 NAR Profile of Home Buyers and Sellers Highlights
Webinar: 2010 NAR Profile of Home Buyers and Sellers Highlights
 
Economic Indicators for Week of December 20-23, 2010
Economic Indicators for Week of December 20-23, 2010Economic Indicators for Week of December 20-23, 2010
Economic Indicators for Week of December 20-23, 2010
 
Summary of NOVEMBER 2010 Existing Home Sales Statistics
Summary of NOVEMBER 2010 Existing Home Sales StatisticsSummary of NOVEMBER 2010 Existing Home Sales Statistics
Summary of NOVEMBER 2010 Existing Home Sales Statistics
 
Economic Indicators for week of August 30-September 3, 2010
Economic Indicators for week of August 30-September 3, 2010Economic Indicators for week of August 30-September 3, 2010
Economic Indicators for week of August 30-September 3, 2010
 
O Serviço Social na área da Educação: perspectivas e desafios
O Serviço Social na área da Educação: perspectivas e desafiosO Serviço Social na área da Educação: perspectivas e desafios
O Serviço Social na área da Educação: perspectivas e desafios
 
Dayana
DayanaDayana
Dayana
 
Recursosdelageosfera (fil eminimizer)
Recursosdelageosfera (fil eminimizer)Recursosdelageosfera (fil eminimizer)
Recursosdelageosfera (fil eminimizer)
 
..... :)
..... :)..... :)
..... :)
 
Para empezar
Para empezarPara empezar
Para empezar
 
Pdot g royal-enclave
Pdot g royal-enclavePdot g royal-enclave
Pdot g royal-enclave
 
Nuestro instituto - Biel y Àlex
Nuestro instituto - Biel y ÀlexNuestro instituto - Biel y Àlex
Nuestro instituto - Biel y Àlex
 
20120516 jawsug sapporo_updates
20120516 jawsug sapporo_updates20120516 jawsug sapporo_updates
20120516 jawsug sapporo_updates
 

Similar to Metro Monthly Payments 2005 vs 2010

Alberta progressive conservatives ca financial disclosures 2009 2010
Alberta progressive conservatives ca financial disclosures 2009 2010Alberta progressive conservatives ca financial disclosures 2009 2010
Alberta progressive conservatives ca financial disclosures 2009 2010David Cournoyer
 
Stimulus Funds
Stimulus FundsStimulus Funds
Stimulus Fundsefordag
 
What Muni Costs
What Muni CostsWhat Muni Costs
What Muni Costs
Matt Baume
 
Risk Management Association\'s CRE Panel
Risk Management Association\'s CRE PanelRisk Management Association\'s CRE Panel
Risk Management Association\'s CRE Panelcesimpsoniii
 
Banco Nuevo Mundo - Impacto negativo generado por visita reiterativa inspecci...
Banco Nuevo Mundo - Impacto negativo generado por visita reiterativa inspecci...Banco Nuevo Mundo - Impacto negativo generado por visita reiterativa inspecci...
Banco Nuevo Mundo - Impacto negativo generado por visita reiterativa inspecci...gonzaloromani
 
Chicago Real Estate Market Data - Broken Down by City
Chicago Real Estate Market Data - Broken Down by CityChicago Real Estate Market Data - Broken Down by City
Chicago Real Estate Market Data - Broken Down by Citybethrepta
 
H W 2010 Q1 De 12 Mo
H W 2010 Q1 De 12 MoH W 2010 Q1 De 12 Mo
H W 2010 Q1 De 12 Mo
chipwags
 
Bnm analisis evolucion depositos - graficos
Bnm   analisis evolucion depositos - graficosBnm   analisis evolucion depositos - graficos
Bnm analisis evolucion depositos - graficosgonzaloromani
 
2009-10 Economic Contributions Of Intl Students
2009-10 Economic Contributions Of Intl Students2009-10 Economic Contributions Of Intl Students
2009-10 Economic Contributions Of Intl Students
Marty Bennett
 
Coldwell Banker C&C Properties Sales Dec 2010
Coldwell Banker C&C Properties Sales Dec 2010Coldwell Banker C&C Properties Sales Dec 2010
Coldwell Banker C&C Properties Sales Dec 2010
Jessica Murr, Real Estate Professional
 
Hhaf Defaultprob
Hhaf DefaultprobHhaf Defaultprob
Hhaf Defaultprob
brucekaufman
 
Vreb Statistical Digest March2011
Vreb Statistical Digest March2011Vreb Statistical Digest March2011
Vreb Statistical Digest March2011
Tara Lynn
 
25 Most Profitable Markets for Flipping Houses
25 Most Profitable Markets for Flipping Houses25 Most Profitable Markets for Flipping Houses
25 Most Profitable Markets for Flipping Houses
Stone Path Commercial
 
Evol depositos por empresa estatal en Banco Nuevo Mundo
Evol depositos por empresa estatal en Banco Nuevo MundoEvol depositos por empresa estatal en Banco Nuevo Mundo
Evol depositos por empresa estatal en Banco Nuevo Mundogonzaloromani
 
Consumer spends are up this holiday season!
Consumer spends are up this holiday season!Consumer spends are up this holiday season!
Consumer spends are up this holiday season!nidiki
 
Ports-to-Plains Alliance Accomplishments
Ports-to-Plains Alliance AccomplishmentsPorts-to-Plains Alliance Accomplishments
Ports-to-Plains Alliance Accomplishments
Ports-To-Plains Blog
 
March 2099 Stats Real Estate Board Of Greater Vancouver
March 2099 Stats Real Estate Board Of Greater VancouverMarch 2099 Stats Real Estate Board Of Greater Vancouver
March 2099 Stats Real Estate Board Of Greater VancouverChristopher R Anderson
 
Vancouver real estate november 2012 stats package rebgv
Vancouver real estate november 2012 stats package rebgvVancouver real estate november 2012 stats package rebgv
Vancouver real estate november 2012 stats package rebgv
Matt Collinge
 

Similar to Metro Monthly Payments 2005 vs 2010 (20)

Alberta progressive conservatives ca financial disclosures 2009 2010
Alberta progressive conservatives ca financial disclosures 2009 2010Alberta progressive conservatives ca financial disclosures 2009 2010
Alberta progressive conservatives ca financial disclosures 2009 2010
 
Stimulus Funds
Stimulus FundsStimulus Funds
Stimulus Funds
 
What Muni Costs
What Muni CostsWhat Muni Costs
What Muni Costs
 
Risk Management Association\'s CRE Panel
Risk Management Association\'s CRE PanelRisk Management Association\'s CRE Panel
Risk Management Association\'s CRE Panel
 
Hotelaria americana
Hotelaria americanaHotelaria americana
Hotelaria americana
 
Banco Nuevo Mundo - Impacto negativo generado por visita reiterativa inspecci...
Banco Nuevo Mundo - Impacto negativo generado por visita reiterativa inspecci...Banco Nuevo Mundo - Impacto negativo generado por visita reiterativa inspecci...
Banco Nuevo Mundo - Impacto negativo generado por visita reiterativa inspecci...
 
Chicago Real Estate Market Data - Broken Down by City
Chicago Real Estate Market Data - Broken Down by CityChicago Real Estate Market Data - Broken Down by City
Chicago Real Estate Market Data - Broken Down by City
 
H W 2010 Q1 De 12 Mo
H W 2010 Q1 De 12 MoH W 2010 Q1 De 12 Mo
H W 2010 Q1 De 12 Mo
 
Bnm analisis evolucion depositos - graficos
Bnm   analisis evolucion depositos - graficosBnm   analisis evolucion depositos - graficos
Bnm analisis evolucion depositos - graficos
 
2009-10 Economic Contributions Of Intl Students
2009-10 Economic Contributions Of Intl Students2009-10 Economic Contributions Of Intl Students
2009-10 Economic Contributions Of Intl Students
 
Coldwell Banker C&C Properties Sales Dec 2010
Coldwell Banker C&C Properties Sales Dec 2010Coldwell Banker C&C Properties Sales Dec 2010
Coldwell Banker C&C Properties Sales Dec 2010
 
Hhaf Defaultprob
Hhaf DefaultprobHhaf Defaultprob
Hhaf Defaultprob
 
Vreb Statistical Digest March2011
Vreb Statistical Digest March2011Vreb Statistical Digest March2011
Vreb Statistical Digest March2011
 
25 Most Profitable Markets for Flipping Houses
25 Most Profitable Markets for Flipping Houses25 Most Profitable Markets for Flipping Houses
25 Most Profitable Markets for Flipping Houses
 
Evol depositos por empresa estatal en Banco Nuevo Mundo
Evol depositos por empresa estatal en Banco Nuevo MundoEvol depositos por empresa estatal en Banco Nuevo Mundo
Evol depositos por empresa estatal en Banco Nuevo Mundo
 
Consumer spends are up this holiday season!
Consumer spends are up this holiday season!Consumer spends are up this holiday season!
Consumer spends are up this holiday season!
 
REBGV Stats Package Oct 2012
REBGV Stats Package Oct 2012REBGV Stats Package Oct 2012
REBGV Stats Package Oct 2012
 
Ports-to-Plains Alliance Accomplishments
Ports-to-Plains Alliance AccomplishmentsPorts-to-Plains Alliance Accomplishments
Ports-to-Plains Alliance Accomplishments
 
March 2099 Stats Real Estate Board Of Greater Vancouver
March 2099 Stats Real Estate Board Of Greater VancouverMarch 2099 Stats Real Estate Board Of Greater Vancouver
March 2099 Stats Real Estate Board Of Greater Vancouver
 
Vancouver real estate november 2012 stats package rebgv
Vancouver real estate november 2012 stats package rebgvVancouver real estate november 2012 stats package rebgv
Vancouver real estate november 2012 stats package rebgv
 

More from NAR Research

Mortgage Delinquencies by State
Mortgage Delinquencies by StateMortgage Delinquencies by State
Mortgage Delinquencies by StateNAR Research
 
Mortgage Delinquencies
Mortgage DelinquenciesMortgage Delinquencies
Mortgage DelinquenciesNAR Research
 
Inflation Watch: February 17, 2011
Inflation Watch: February 17, 2011Inflation Watch: February 17, 2011
Inflation Watch: February 17, 2011NAR Research
 
Recovery to Normalcy: Feb 2011
Recovery to Normalcy: Feb 2011Recovery to Normalcy: Feb 2011
Recovery to Normalcy: Feb 2011
NAR Research
 
Home Price Monitor
Home Price MonitorHome Price Monitor
Home Price Monitor
NAR Research
 
How Risky is the FHA’s Low Down Payment Program?
How Risky is the FHA’s Low Down Payment Program?How Risky is the FHA’s Low Down Payment Program?
How Risky is the FHA’s Low Down Payment Program?NAR Research
 
Metro Area Monthly Mortgage Payments: 2005 vs 2010
Metro Area Monthly Mortgage Payments: 2005 vs 2010Metro Area Monthly Mortgage Payments: 2005 vs 2010
Metro Area Monthly Mortgage Payments: 2005 vs 2010
NAR Research
 
State by State Employment Trends
State by State Employment TrendsState by State Employment Trends
State by State Employment TrendsNAR Research
 
Economic Indicators for the Week of January 18th
Economic Indicators for the Week of January 18thEconomic Indicators for the Week of January 18th
Economic Indicators for the Week of January 18thNAR Research
 
Summary of December 2010 Existing-Home Sales
Summary of December 2010 Existing-Home SalesSummary of December 2010 Existing-Home Sales
Summary of December 2010 Existing-Home SalesNAR Research
 
Daily Economic Update for January 5, 2011
Daily Economic Update for January 5, 2011Daily Economic Update for January 5, 2011
Daily Economic Update for January 5, 2011NAR Research
 
Daily Economic Update for January 04, 2011
Daily Economic Update for January 04, 2011Daily Economic Update for January 04, 2011
Daily Economic Update for January 04, 2011NAR Research
 
Daily Economic Update, January 3, 2011
Daily Economic Update, January 3, 2011Daily Economic Update, January 3, 2011
Daily Economic Update, January 3, 2011NAR Research
 
Summary of NOVEMBER 2010 Pending Home Sales Statistics
Summary of NOVEMBER 2010 Pending Home Sales StatisticsSummary of NOVEMBER 2010 Pending Home Sales Statistics
Summary of NOVEMBER 2010 Pending Home Sales Statistics
NAR Research
 
Daily Economic Update: December 30, 2010
Daily Economic Update: December 30, 2010Daily Economic Update: December 30, 2010
Daily Economic Update: December 30, 2010NAR Research
 
Daily Economic Update, December 28, 2010
Daily Economic Update, December 28, 2010Daily Economic Update, December 28, 2010
Daily Economic Update, December 28, 2010NAR Research
 
Daily Economic Update, December 27, 2010
Daily Economic Update, December 27, 2010Daily Economic Update, December 27, 2010
Daily Economic Update, December 27, 2010NAR Research
 
Daily Economic Update, December 22, 2010
Daily Economic Update, December 22, 2010Daily Economic Update, December 22, 2010
Daily Economic Update, December 22, 2010NAR Research
 
Daily Economic Update for December 20, 2010
Daily Economic Update for December 20, 2010Daily Economic Update for December 20, 2010
Daily Economic Update for December 20, 2010NAR Research
 
Daily Economic Update for December 16, 2010
Daily Economic Update for December 16, 2010Daily Economic Update for December 16, 2010
Daily Economic Update for December 16, 2010NAR Research
 

More from NAR Research (20)

Mortgage Delinquencies by State
Mortgage Delinquencies by StateMortgage Delinquencies by State
Mortgage Delinquencies by State
 
Mortgage Delinquencies
Mortgage DelinquenciesMortgage Delinquencies
Mortgage Delinquencies
 
Inflation Watch: February 17, 2011
Inflation Watch: February 17, 2011Inflation Watch: February 17, 2011
Inflation Watch: February 17, 2011
 
Recovery to Normalcy: Feb 2011
Recovery to Normalcy: Feb 2011Recovery to Normalcy: Feb 2011
Recovery to Normalcy: Feb 2011
 
Home Price Monitor
Home Price MonitorHome Price Monitor
Home Price Monitor
 
How Risky is the FHA’s Low Down Payment Program?
How Risky is the FHA’s Low Down Payment Program?How Risky is the FHA’s Low Down Payment Program?
How Risky is the FHA’s Low Down Payment Program?
 
Metro Area Monthly Mortgage Payments: 2005 vs 2010
Metro Area Monthly Mortgage Payments: 2005 vs 2010Metro Area Monthly Mortgage Payments: 2005 vs 2010
Metro Area Monthly Mortgage Payments: 2005 vs 2010
 
State by State Employment Trends
State by State Employment TrendsState by State Employment Trends
State by State Employment Trends
 
Economic Indicators for the Week of January 18th
Economic Indicators for the Week of January 18thEconomic Indicators for the Week of January 18th
Economic Indicators for the Week of January 18th
 
Summary of December 2010 Existing-Home Sales
Summary of December 2010 Existing-Home SalesSummary of December 2010 Existing-Home Sales
Summary of December 2010 Existing-Home Sales
 
Daily Economic Update for January 5, 2011
Daily Economic Update for January 5, 2011Daily Economic Update for January 5, 2011
Daily Economic Update for January 5, 2011
 
Daily Economic Update for January 04, 2011
Daily Economic Update for January 04, 2011Daily Economic Update for January 04, 2011
Daily Economic Update for January 04, 2011
 
Daily Economic Update, January 3, 2011
Daily Economic Update, January 3, 2011Daily Economic Update, January 3, 2011
Daily Economic Update, January 3, 2011
 
Summary of NOVEMBER 2010 Pending Home Sales Statistics
Summary of NOVEMBER 2010 Pending Home Sales StatisticsSummary of NOVEMBER 2010 Pending Home Sales Statistics
Summary of NOVEMBER 2010 Pending Home Sales Statistics
 
Daily Economic Update: December 30, 2010
Daily Economic Update: December 30, 2010Daily Economic Update: December 30, 2010
Daily Economic Update: December 30, 2010
 
Daily Economic Update, December 28, 2010
Daily Economic Update, December 28, 2010Daily Economic Update, December 28, 2010
Daily Economic Update, December 28, 2010
 
Daily Economic Update, December 27, 2010
Daily Economic Update, December 27, 2010Daily Economic Update, December 27, 2010
Daily Economic Update, December 27, 2010
 
Daily Economic Update, December 22, 2010
Daily Economic Update, December 22, 2010Daily Economic Update, December 22, 2010
Daily Economic Update, December 22, 2010
 
Daily Economic Update for December 20, 2010
Daily Economic Update for December 20, 2010Daily Economic Update for December 20, 2010
Daily Economic Update for December 20, 2010
 
Daily Economic Update for December 16, 2010
Daily Economic Update for December 16, 2010Daily Economic Update for December 16, 2010
Daily Economic Update for December 16, 2010
 

Recently uploaded

Killer Referans Bahcesehir Catalog Listing Turkey
Killer Referans Bahcesehir Catalog Listing TurkeyKiller Referans Bahcesehir Catalog Listing Turkey
Killer Referans Bahcesehir Catalog Listing Turkey
Listing Turkey
 
Riverview City Loni Kalbhor Pune Brochure
Riverview City Loni Kalbhor Pune BrochureRiverview City Loni Kalbhor Pune Brochure
Riverview City Loni Kalbhor Pune Brochure
kishor21012022
 
Architectural & Interior design portfolio.pdf
Architectural & Interior design portfolio.pdfArchitectural & Interior design portfolio.pdf
Architectural & Interior design portfolio.pdf
susantebinum
 
One FNG by Group 108 Sector 142 Noida Construction Update
One FNG by Group 108 Sector 142 Noida Construction UpdateOne FNG by Group 108 Sector 142 Noida Construction Update
One FNG by Group 108 Sector 142 Noida Construction Update
One FNG
 
Presentation to Windust Meadows HOA Board of Directors June 4, 2024: Focus o...
Presentation to Windust Meadows HOA Board of Directors June 4, 2024:  Focus o...Presentation to Windust Meadows HOA Board of Directors June 4, 2024:  Focus o...
Presentation to Windust Meadows HOA Board of Directors June 4, 2024: Focus o...
Joseph Lewis Aguirre
 
How to keep your Home naturally Cool and Warm
How to keep your Home naturally Cool and WarmHow to keep your Home naturally Cool and Warm
How to keep your Home naturally Cool and Warm
Vinra Construction
 
Elegant Evergreen Homes - Luxury Apartments Redefining Comfort in Yelahanka, ...
Elegant Evergreen Homes - Luxury Apartments Redefining Comfort in Yelahanka, ...Elegant Evergreen Homes - Luxury Apartments Redefining Comfort in Yelahanka, ...
Elegant Evergreen Homes - Luxury Apartments Redefining Comfort in Yelahanka, ...
JagadishKR1
 
Sense Levent Kagithane Catalog - Listing Turkey
Sense Levent Kagithane Catalog - Listing TurkeySense Levent Kagithane Catalog - Listing Turkey
Sense Levent Kagithane Catalog - Listing Turkey
Listing Turkey
 
Hawthorn Module 1 Coverted to Slide Show - 04.06.2024.docx
Hawthorn Module 1 Coverted to Slide Show - 04.06.2024.docxHawthorn Module 1 Coverted to Slide Show - 04.06.2024.docx
Hawthorn Module 1 Coverted to Slide Show - 04.06.2024.docx
anothershaneroberts
 
One20 North Vancouver Floor Plans by Three Shores Development.
One20 North Vancouver Floor Plans by Three Shores Development.One20 North Vancouver Floor Plans by Three Shores Development.
One20 North Vancouver Floor Plans by Three Shores Development.
VickyAulakh1
 
Rixos Tersane Istanbul Residences Brochure_May2024_ENG.pdf
Rixos Tersane Istanbul Residences Brochure_May2024_ENG.pdfRixos Tersane Istanbul Residences Brochure_May2024_ENG.pdf
Rixos Tersane Istanbul Residences Brochure_May2024_ENG.pdf
Listing Turkey
 
Brigade Insignia at Yelahanka Brochure.pdf
Brigade Insignia at Yelahanka Brochure.pdfBrigade Insignia at Yelahanka Brochure.pdf
Brigade Insignia at Yelahanka Brochure.pdf
SachinChauhan191
 
Omaxe Sports City Dwarka A Comprehensive Guide
Omaxe Sports City Dwarka A Comprehensive GuideOmaxe Sports City Dwarka A Comprehensive Guide
Omaxe Sports City Dwarka A Comprehensive Guide
omaxesportscitydwark
 
Investing In The US As A Canadian… And How To Do It RIGHT!! (feat. Erwin Szet...
Investing In The US As A Canadian… And How To Do It RIGHT!! (feat. Erwin Szet...Investing In The US As A Canadian… And How To Do It RIGHT!! (feat. Erwin Szet...
Investing In The US As A Canadian… And How To Do It RIGHT!! (feat. Erwin Szet...
Volition Properties
 
2BHK-3BHK NEW FLAT FOR SALE IN TUPUDANA,RANCHI.
2BHK-3BHK NEW FLAT FOR SALE IN TUPUDANA,RANCHI.2BHK-3BHK NEW FLAT FOR SALE IN TUPUDANA,RANCHI.
2BHK-3BHK NEW FLAT FOR SALE IN TUPUDANA,RANCHI.
aashiyanastardevelop
 
Deutsche EuroShop | Company Presentation | 06/24
Deutsche EuroShop | Company Presentation | 06/24Deutsche EuroShop | Company Presentation | 06/24
Deutsche EuroShop | Company Presentation | 06/24
Deutsche EuroShop AG
 
Optimizing Your MCA Lead Capture Process for Better Results
Optimizing Your MCA Lead Capture Process for Better ResultsOptimizing Your MCA Lead Capture Process for Better Results
Optimizing Your MCA Lead Capture Process for Better Results
Lead Generation Media
 
Simpolo Company Profile & Corporate Logo
Simpolo Company Profile & Corporate LogoSimpolo Company Profile & Corporate Logo
Simpolo Company Profile & Corporate Logo
simpolosparkteam
 
Biography and career about Lixin Azarmehr
Biography and career about Lixin AzarmehrBiography and career about Lixin Azarmehr
Biography and career about Lixin Azarmehr
Lixin Azarmehr
 
SVN Live 6.3.24 Weekly Property Broadcast
SVN Live 6.3.24 Weekly Property BroadcastSVN Live 6.3.24 Weekly Property Broadcast
SVN Live 6.3.24 Weekly Property Broadcast
SVN International Corp.
 

Recently uploaded (20)

Killer Referans Bahcesehir Catalog Listing Turkey
Killer Referans Bahcesehir Catalog Listing TurkeyKiller Referans Bahcesehir Catalog Listing Turkey
Killer Referans Bahcesehir Catalog Listing Turkey
 
Riverview City Loni Kalbhor Pune Brochure
Riverview City Loni Kalbhor Pune BrochureRiverview City Loni Kalbhor Pune Brochure
Riverview City Loni Kalbhor Pune Brochure
 
Architectural & Interior design portfolio.pdf
Architectural & Interior design portfolio.pdfArchitectural & Interior design portfolio.pdf
Architectural & Interior design portfolio.pdf
 
One FNG by Group 108 Sector 142 Noida Construction Update
One FNG by Group 108 Sector 142 Noida Construction UpdateOne FNG by Group 108 Sector 142 Noida Construction Update
One FNG by Group 108 Sector 142 Noida Construction Update
 
Presentation to Windust Meadows HOA Board of Directors June 4, 2024: Focus o...
Presentation to Windust Meadows HOA Board of Directors June 4, 2024:  Focus o...Presentation to Windust Meadows HOA Board of Directors June 4, 2024:  Focus o...
Presentation to Windust Meadows HOA Board of Directors June 4, 2024: Focus o...
 
How to keep your Home naturally Cool and Warm
How to keep your Home naturally Cool and WarmHow to keep your Home naturally Cool and Warm
How to keep your Home naturally Cool and Warm
 
Elegant Evergreen Homes - Luxury Apartments Redefining Comfort in Yelahanka, ...
Elegant Evergreen Homes - Luxury Apartments Redefining Comfort in Yelahanka, ...Elegant Evergreen Homes - Luxury Apartments Redefining Comfort in Yelahanka, ...
Elegant Evergreen Homes - Luxury Apartments Redefining Comfort in Yelahanka, ...
 
Sense Levent Kagithane Catalog - Listing Turkey
Sense Levent Kagithane Catalog - Listing TurkeySense Levent Kagithane Catalog - Listing Turkey
Sense Levent Kagithane Catalog - Listing Turkey
 
Hawthorn Module 1 Coverted to Slide Show - 04.06.2024.docx
Hawthorn Module 1 Coverted to Slide Show - 04.06.2024.docxHawthorn Module 1 Coverted to Slide Show - 04.06.2024.docx
Hawthorn Module 1 Coverted to Slide Show - 04.06.2024.docx
 
One20 North Vancouver Floor Plans by Three Shores Development.
One20 North Vancouver Floor Plans by Three Shores Development.One20 North Vancouver Floor Plans by Three Shores Development.
One20 North Vancouver Floor Plans by Three Shores Development.
 
Rixos Tersane Istanbul Residences Brochure_May2024_ENG.pdf
Rixos Tersane Istanbul Residences Brochure_May2024_ENG.pdfRixos Tersane Istanbul Residences Brochure_May2024_ENG.pdf
Rixos Tersane Istanbul Residences Brochure_May2024_ENG.pdf
 
Brigade Insignia at Yelahanka Brochure.pdf
Brigade Insignia at Yelahanka Brochure.pdfBrigade Insignia at Yelahanka Brochure.pdf
Brigade Insignia at Yelahanka Brochure.pdf
 
Omaxe Sports City Dwarka A Comprehensive Guide
Omaxe Sports City Dwarka A Comprehensive GuideOmaxe Sports City Dwarka A Comprehensive Guide
Omaxe Sports City Dwarka A Comprehensive Guide
 
Investing In The US As A Canadian… And How To Do It RIGHT!! (feat. Erwin Szet...
Investing In The US As A Canadian… And How To Do It RIGHT!! (feat. Erwin Szet...Investing In The US As A Canadian… And How To Do It RIGHT!! (feat. Erwin Szet...
Investing In The US As A Canadian… And How To Do It RIGHT!! (feat. Erwin Szet...
 
2BHK-3BHK NEW FLAT FOR SALE IN TUPUDANA,RANCHI.
2BHK-3BHK NEW FLAT FOR SALE IN TUPUDANA,RANCHI.2BHK-3BHK NEW FLAT FOR SALE IN TUPUDANA,RANCHI.
2BHK-3BHK NEW FLAT FOR SALE IN TUPUDANA,RANCHI.
 
Deutsche EuroShop | Company Presentation | 06/24
Deutsche EuroShop | Company Presentation | 06/24Deutsche EuroShop | Company Presentation | 06/24
Deutsche EuroShop | Company Presentation | 06/24
 
Optimizing Your MCA Lead Capture Process for Better Results
Optimizing Your MCA Lead Capture Process for Better ResultsOptimizing Your MCA Lead Capture Process for Better Results
Optimizing Your MCA Lead Capture Process for Better Results
 
Simpolo Company Profile & Corporate Logo
Simpolo Company Profile & Corporate LogoSimpolo Company Profile & Corporate Logo
Simpolo Company Profile & Corporate Logo
 
Biography and career about Lixin Azarmehr
Biography and career about Lixin AzarmehrBiography and career about Lixin Azarmehr
Biography and career about Lixin Azarmehr
 
SVN Live 6.3.24 Weekly Property Broadcast
SVN Live 6.3.24 Weekly Property BroadcastSVN Live 6.3.24 Weekly Property Broadcast
SVN Live 6.3.24 Weekly Property Broadcast
 

Metro Monthly Payments 2005 vs 2010

  • 1. Median Price 2010 Estimated Monthly Median Price 2005 Estimated Monthly Difference in Monthly Percentage Metro Area Q2 Payment (1) Q2 Payment (2) Payment Difference San Diego-Carlsbad-San Marcos, CA $392,600 $1,564 $605,600 $2,833 -$1,270 -45% Anaheim-Santa Ana, CA (Orange Co.) $504,500 $2,009 $696,100 $3,257 -$1,248 -38% San Francisco-Oakland-Fremont, CA $591,200 $2,354 $726,900 $3,401 -$1,047 -31% Sacramento--Arden-Arcade--Roseville, CA $192,200 $765 $377,400 $1,766 -$1,000 -57% Los Angeles-Long Beach-Santa Ana, CA $339,900 $1,354 $502,900 $2,353 -$999 -42% San Jose-Sunnyvale-Santa Clara, CA $630,000 $2,509 $745,300 $3,487 -$978 -28% Riverside-San Bernardino-Ontario, CA $190,200 $757 $365,700 $1,711 -$954 -56% Reno-Sparks, NV $180,300 $718 $353,000 $1,652 -$934 -57% Sarasota-Bradenton-Venice, FL $184,600 $735 $350,100 $1,638 -$903 -55% Cape Coral-Fort Myers, FL $94,100 $375 $266,800 $1,248 -$874 -70% Miami-Fort Lauderdale-Miami Beach, FL $214,200 $853 $368,900 $1,726 -$873 -51% Las Vegas-Paradise, NV $142,300 $567 $300,100 $1,404 -$837 -60% Washington-Arlington-Alexandria, DC-VA- MD-WV $331,600 $1,321 $429,200 $2,008 -$688 -34% NY: Nassau-Suffolk, NY $395,100 $1,573 $467,700 $2,188 -$615 -28% Bridgeport-Stamford-Norwalk, CT $419,400 $1,670 $487,300 $2,280 -$610 -27% New York-Wayne-White Plains, NY-NJ $443,800 $1,767 $506,800 $2,371 -$604 -25% Phoenix-Mesa-Scottsdale, AZ $144,700 $576 $243,400 $1,139 -$563 -49% New York-Northern New Jersey-Long Island, NY-NJ-PA $393,900 $1,569 $452,700 $2,118 -$549 -26% Barnstable Town, MA $334,900 $1,334 $398,600 $1,865 -$531 -28% Orlando, FL $140,200 $558 $232,200 $1,086 -$528 -49% Boston-Cambridge-Quincy, MA-NH** $360,200 $1,434 $418,500 $1,958 -$524 -27% Palm Bay-Melbourne-Titusville, FL $117,300 $467 $204,000 $954 -$487 -51% Tucson, AZ $150,200 $598 $228,500 $1,069 -$471 -44% Providence-New Bedford-Fall River, RI-MA $224,700 $895 $291,600 $1,364 -$469 -34% NY: Edison, NJ $345,800 $1,377 $394,100 $1,844 -$467 -25% Deltona-Daytona Beach-Ormond Beach, FL $117,000 $466 $194,000 $908 -$442 -49% Worcester, MA $235,000 $936 $292,300 $1,368 -$432 -32% Chicago-Naperville-Joliet, IL $203,800 $812 $265,400 $1,242 -$430 -35% Minneapolis-St. Paul-Bloomington, MN-WI $176,200 $702 $237,700 $1,112 -$410 -37% NY: Newark-Union, NJ-PA $386,500 $1,539 $414,400 $1,939 -$400 -21% Hagerstown-Martinsburg, MD-WV $149,800 $597 $206,000 $964 -$367 -38% New Haven-Milford, CT $237,800 $947 $278,700 $1,304 -$357 -27% Tampa-St.Petersburg-Clearwater, FL $141,400 $563 $195,000 $912 -$349 -38% Kingston, NY $208,200 $829 $250,700 $1,173 -$344 -29% Lansing-E.Lansing, MI $92,100 $367 $143,600 $672 -$305 -45% Portland-South Portland-Biddeford, ME $217,400 $866 $247,200 $1,157 -$291 -25% Atlanta-Sandy Springs-Marietta, GA $122,700 $489 $166,500 $779 -$290 -37% Grand Rapids, MI $93,000 $370 $139,000 $650 -$280 -43% Norwich-New London, CT $224,000 $892 $246,800 $1,155 -$263 -23% Atlantic City, NJ $224,400 $894 $244,900 $1,146 -$252 -22% Ocala, FL $95,900 $382 $135,300 $633 -$251 -40% Hartford-West Hartford-East Hartford, CT $236,000 $940 $252,200 $1,180 -$240 -20% Baltimore-Towson, MD $251,600 $1,002 $264,700 $1,238 -$236 -19% Allentown-Bethlehem-Easton, PA-NJ $227,200 $905 $242,700 $1,136 -$231 -20% Seattle-Tacoma-Bellevue, WA $307,300 $1,224 $310,300 $1,452 -$228 -16% Honolulu, HI $621,600 $2,476 $577,800 $2,703 -$228 -8% Denver-Aurora, CO $234,700 $935 $248,400 $1,162 -$228 -20% Jacksonville, FL $139,000 $554 $166,600 $779 -$226 -29% Pittsfield, MA $192,300 $766 $211,800 $991 -$225 -23% Milwaukee-Waukesha-West Allis, WI $200,200 $797 $216,800 $1,014 -$217 -21% Boulder, CO $352,400 $1,403 $346,200 $1,620 -$216 -13% Cleveland-Elyria-Mentor, OH $118,200 $471 $146,700 $686 -$216 -31% Green Bay, WI $133,800 $533 $158,300 $741 -$208 -28% Trenton-Ewing, NJ $259,300 $1,033 $264,300 $1,237 -$204 -16% Boise City-Nampa, ID $140,100 $558 $161,800 $757 -$199 -26% Tallahassee, FL $142,300 $567 $163,300 $764 -$197 -26% Toledo, OH $90,900 $362 $118,900 $556 -$194 -35% Colordo Springs, CO $196,800 $784 $207,300 $970 -$186 -19% Madison, WI $213,200 $849 $220,100 $1,030 -$181 -18% Pensacola-Ferry Pass-Brent, FL $143,100 $570 $159,400 $746 -$176 -24% Cincinnati-Middletown, OH-KY-IN $131,100 $522 $148,500 $695 -$173 -25% Springfield, MA $189,200 $753 $197,900 $926 -$172 -19% Portland-Vancouver-Beaverton, OR-WA $238,500 $950 $238,000 $1,114 -$164 -15% Memphis, TN-MS-AR $127,200 $507 $142,800 $668 -$162 -24% Dallas-Fort Worth-Arlington, TX $134,700 $536 $149,100 $698 -$161 -23% Greensboro-High Point, NC $134,200 $534 $148,000 $692 -$158 -23% Gainesville, FL $172,900 $689 $178,800 $837 -$148 -18% Birmingham-Hoover, AL $146,500 $583 $156,100 $730 -$147 -20%
  • 2. Rockford, IL $109,000 $434 $122,700 $574 -$140 -24% Kansas City, MO-KS $150,600 $600 $157,100 $735 -$135 -18% Davenport-Moline-Rock Island, IA-IL $113,500 $452 $125,400 $587 -$135 -23% Richmond, VA $199,600 $795 $198,400 $928 -$133 -14% Columbus, OH $149,700 $596 $155,900 $729 -$133 -18% Appleton, WI $120,000 $478 $129,600 $606 -$128 -21% Charleston-North Charleston, SC $197,500 $787 $193,600 $906 -$119 -13% Kankakee-Bradley, IL $126,500 $504 $132,300 $619 -$115 -19% Lincoln, NE $134,200 $534 $138,300 $647 -$113 -17% Dayton, OH $112,400 $448 $119,400 $559 -$111 -20% Chattanooga, TN-GA $125,700 $501 $130,500 $611 -$110 -18% Montgomery, AL $129,200 $515 $133,300 $624 -$109 -17% Lexington-Fayette,KY $144,200 $574 $144,800 $677 -$103 -15% Springfield, MO $112,400 $448 $117,500 $550 -$102 -19% Salem, OR $176,800 $704 $172,000 $805 -$101 -13% Gary-Hammond, IN $127,000 $506 $129,600 $606 -$101 -17% Knoxville, TN $143,500 $571 $143,400 $671 -$99 -15% Philadelphia-Camden-Wilmington, PA-NJ- DE-MD $223,200 $889 $211,000 $987 -$98 -10% Eugene-Springfield, OR $201,600 $803 $192,400 $900 -$97 -11% Louisville, KY-IN $136,400 $543 $136,800 $640 -$97 -15% South Bend-Mishawaka, IN $95,900 $382 $102,100 $478 -$96 -20% Albuquerque, NM $177,900 $708 $171,700 $803 -$95 -12% Saint Louis, MO-IL $143,100 $570 $141,900 $664 -$94 -14% Omaha, NE-IA $138,800 $553 $137,300 $642 -$90 -14% Youngstown-Warren-Boardman, OH-PA $75,100 $299 $82,900 $388 -$89 -23% Bloomington-Normal, IL $160,800 $640 $155,800 $729 -$89 -12% Mobile, AL $129,500 $516 $129,100 $604 -$88 -15% Akron, OH $119,700 $477 $119,800 $561 -$84 -15% Sioux Falls, SD $141,400 $563 $137,700 $644 -$81 -13% Greenville, SC $149,600 $596 $143,200 $670 -$74 -11% Glens Falls, NY $148,300 $591 $142,000 $664 -$74 -11% Spartanburg, SC $121,300 $483 $118,700 $555 -$72 -13% Canton-Massillon, OH $111,500 $444 $110,200 $516 -$72 -14% Ft. Wayne, IN $103,300 $411 $102,800 $481 -$70 -14% New Orleans-Metairie-Kenner, LA $161,900 $645 $152,600 $714 -$69 -10% Gulfport-Biloxi, MS $128,500 $512 $124,000 $580 -$68 -12% Jackson, MS $137,900 $549 $131,700 $616 -$67 -11% Champaign-Urbana, IL $142,500 $568 $135,500 $634 -$66 -10% Indianapolis, IN $129,900 $517 $124,600 $583 -$66 -11% Durham, NC $186,400 $742 $172,200 $806 -$63 -8% Virginia Beach-Norfolk-Newport News, VA- NC $210,000 $836 $192,000 $898 -$62 -7% Columbia, SC $142,100 $566 $133,700 $626 -$60 -10% Des Moines, IA $156,200 $622 $145,100 $679 -$57 -8% Fargo, ND-MN $141,600 $564 $132,600 $620 -$56 -9% Tulsa, OK $133,200 $530 $124,300 $582 -$51 -9% Pittsburgh, PA $126,600 $504 $118,500 $554 -$50 -9% Albany-Schenectady-Troy, NY $194,300 $774 $176,100 $824 -$50 -6% Topeka, KS $109,600 $436 $103,100 $482 -$46 -10% Houston-Baytown-Sugar Land, TX $155,900 $621 $142,500 $667 -$46 -7% Charleston, WV $132,000 $526 $121,700 $569 -$44 -8% Dover, DE $196,300 $782 $176,300 $825 -$43 -5% Charlotte-Gastonia-Concord, NC-SC $199,100 $793 $178,500 $835 -$42 -5% Cedar Rapids, IA $145,300 $579 $131,600 $616 -$37 -6% San Antonio, TX $148,200 $590 $134,000 $627 -$37 -6% Corpus Christi, TX $135,500 $540 $123,000 $575 -$36 -6% Rochester, NY $121,400 $483 $110,700 $518 -$34 -7% Little Rock-N. Little Rock, AR $132,800 $529 $118,900 $556 -$27 -5% Peoria, IL $123,300 $491 $110,500 $517 -$26 -5% Kennewick-Richland-Pasco, WA $173,100 $689 $152,700 $714 -$25 -4% Decatur, IL $96,000 $382 $86,800 $406 -$24 -6% Spokane, WA $171,400 $683 $150,900 $706 -$23 -3% Erie, PA $110,200 $439 $98,500 $461 -$22 -5% Springfield, IL $123,600 $492 $109,000 $510 -$18 -3% Yakima, WA $154,500 $615 $134,800 $631 -$15 -2% Farmington, NM $174,800 $696 $151,800 $710 -$14 -2% Waterloo/Cedar Falls, IA $115,300 $459 $100,700 $471 -$12 -3% Syracuse, NY $125,300 $499 $108,700 $509 -$10 -2% Wichita, KS $122,500 $488 $106,300 $497 -$9 -2% Reading, PA $155,600 $620 $134,200 $628 -$8 -1% Cumberland, MD-WV $104,500 $416 $88,600 $415 $2 0% Austin-Round Rock, TX $196,600 $783 $166,800 $780 $3 0% Amarillo, TX $127,200 $507 $107,400 $502 $4 1% Binghamton, NY $110,800 $441 $93,300 $437 $5 1% El Paso, TX $133,800 $533 $108,900 $510 $23 5% Raleigh-Cary, NC $223,700 $891 $185,200 $867 $24 3% Buffalo-Niagara Falls, NY $121,400 $483 $97,500 $456 $27 6% Beaumont-Port Arthur, TX $120,700 $481 $96,500 $451 $29 6%
  • 3. Salt Lake City, UT $207,300 $826 $169,900 $795 $31 4% Elmira, NY $99,200 $395 $77,700 $364 $32 9% Shreveport-Bossier City, LA $155,900 $621 $125,100 $585 $36 6% Baton Rouge, LA $170,400 $679 $135,400 $634 $45 7% Oklahoma City, OK $149,900 $597 $115,700 $541 $56 10% Bismarck, ND $163,100 $650 $121,500 $568 $81 14% (1) Assumes 20 percent downpayment and 30-year fixed mortgage of 4.35% (September 2010 avg) (2) Assumes 20 percent downpayment and 30-year fixed mortgage of 5.77% (September 2005 avg)