Metrics: Google Analytics
•
0 likes•205 views

An in-depth introduction at how nonprofits can use Google Analytics.

Recommended
Recommended
More Related Content
Similar to Metrics: Google Analytics
Similar to Metrics: Google Analytics (20)
More from Amplify Mobilise Change
Recently uploaded
Recently uploaded (20)
Metrics: Google Analytics
- 3. Metrics in the relationship cycle (off and online, public and direct Reach, Brand awareness, word of mouth, knock on effect... Likes, shares, views, comments, shares, DMs, follows, clicks, attendance, questions, opens.. Link clicks, completed online action, donations signatures, conversion, attendance... Organic growth over time, long term relationships, positive sentiments, advocacy, recurring actions...
- 4. Appropriate time on page/ not bounced Report on all stages of a journey First step Social media post to attract Second step Click through to a new page/ view Third step Initiates the action that has been called Fourth step Completes the activity. Fifth step How many people? How many people? How many people? How many people? How many people? What's working?
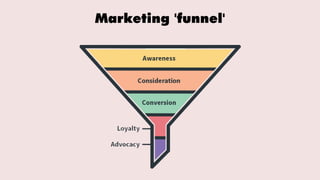
- 5. Nurturing your relationships AWARENESS INITIAL ENGAGEMENT MORE CONSIDERED ENGAGEMENT ACTION, CONVERSION LOYALTY, ADVOCACY PUBLIC COMMS BROAD MESSAGING DIRECT COMMS, SPECIFIC MESSAGING, SEGMENTATION SOME ACTION
- 6. You want to move away from reporting like this: "We successfully posted 20 posts on Facebook in May 2020" To: "Between February and March, we reached 500 0000 people and achieved a high engagement rate of 5% engagement rate per post and reached over a million people in May. This, in turn, meant that we saw an increase in attendance at our core events and also, a steady increase in donations over time between these dates." Track quality not quantity
- 7. How many people have seen or viewed your content/ (how far you reached); this is tied into how much you spend and how people respond to your content. Very much broad strokes. A bigger quantity indicates more potential for engagement and action. Examples: Opens, pageviews, video views, downloads Reach (indicator of awareness, potential)
- 8. Engagement rate (indicator of consideration, quality) How many people from the initial total took a closer look at your content; explored more, stayed longer, contacted you. A high rate means your content is resonating with you audiences and shows trust. Examples: likes, shares, pageviews, DMs, retweets, comments, asking questions, leads
- 9. Engagement rate Total number of engagements/ reach, or size of community etc. Click through rate Total number of clicks/size of community or reach of content Open rate Total number of opens/ size of the database Conversion rate Total number of completed actions/ relevant metric Rates indicate value
- 10. Traffic Traffic is link clicks. How many people literally click on your link? This indicates interest and is a form of engagement. Beware of equating link clicks with actual pageviews. Remember to track your journeys and what happens at the destination.
- 11. A trackable, completed action that means someone has finished a journey. Doesn't usually happen on web. Conversions are often synched with broader organisation/ campaign outcomes. A much smaller number of people will complete a journey, which is normal. Ideally you measure conversions in rates but there are often quantity targets associated like 'funds raised'. Examples: learning completed, funds donated, application completed, participation completed. Conversion
- 12. How many times people read a certain page/ all pages. Indicates interest, trust, loyalty. Also, great for SEO and ranking. Can also be an indicator of digital literacy and even language literacy and comprehension, as well as content/ experience 'stickiness' Pageviews (qt)
- 13. Tells you if someone is interested in what you have to say. Can also indicate outcomes like literacy, for example if time spent reading indicates literacy levels. You can also use time on page to measure if someone is doing an activity, by timing how long a typical persona takes to read and not do an activity, versus how long they take to read and complete the activity (if you don't have event stats for activities). Time on page/ time on site
- 14. What people are saying about your organisation and you content; indicates general feelings about org; can check manually in comments or pay for a tool to do this automatically (Tools such as Hootsuite or Social Bakers, both quite expensive, so manual could be your best bet. You could get a good sense of things from a sample of comments) Sentiment
- 15. Can be seen across social media and websites. Indicates loyalty, interest, brand name, social leadership, great content. On web, should be the largest proportion of traffic. One social, usually the lowest compared to paid. Organic traffic to site, size of organic community, organic results
- 16. Tools Social listening/ sentiment tracking/ social analytics Mention Keyhole Crowdtangle Hootesuite (and the likes) Web analytics Google Analytics, Google Search console Social analytics Insights tab Ads reporting Newsletter Depending on email client, all mailers/ campaigns should have a report