Download as PDF, PPTX
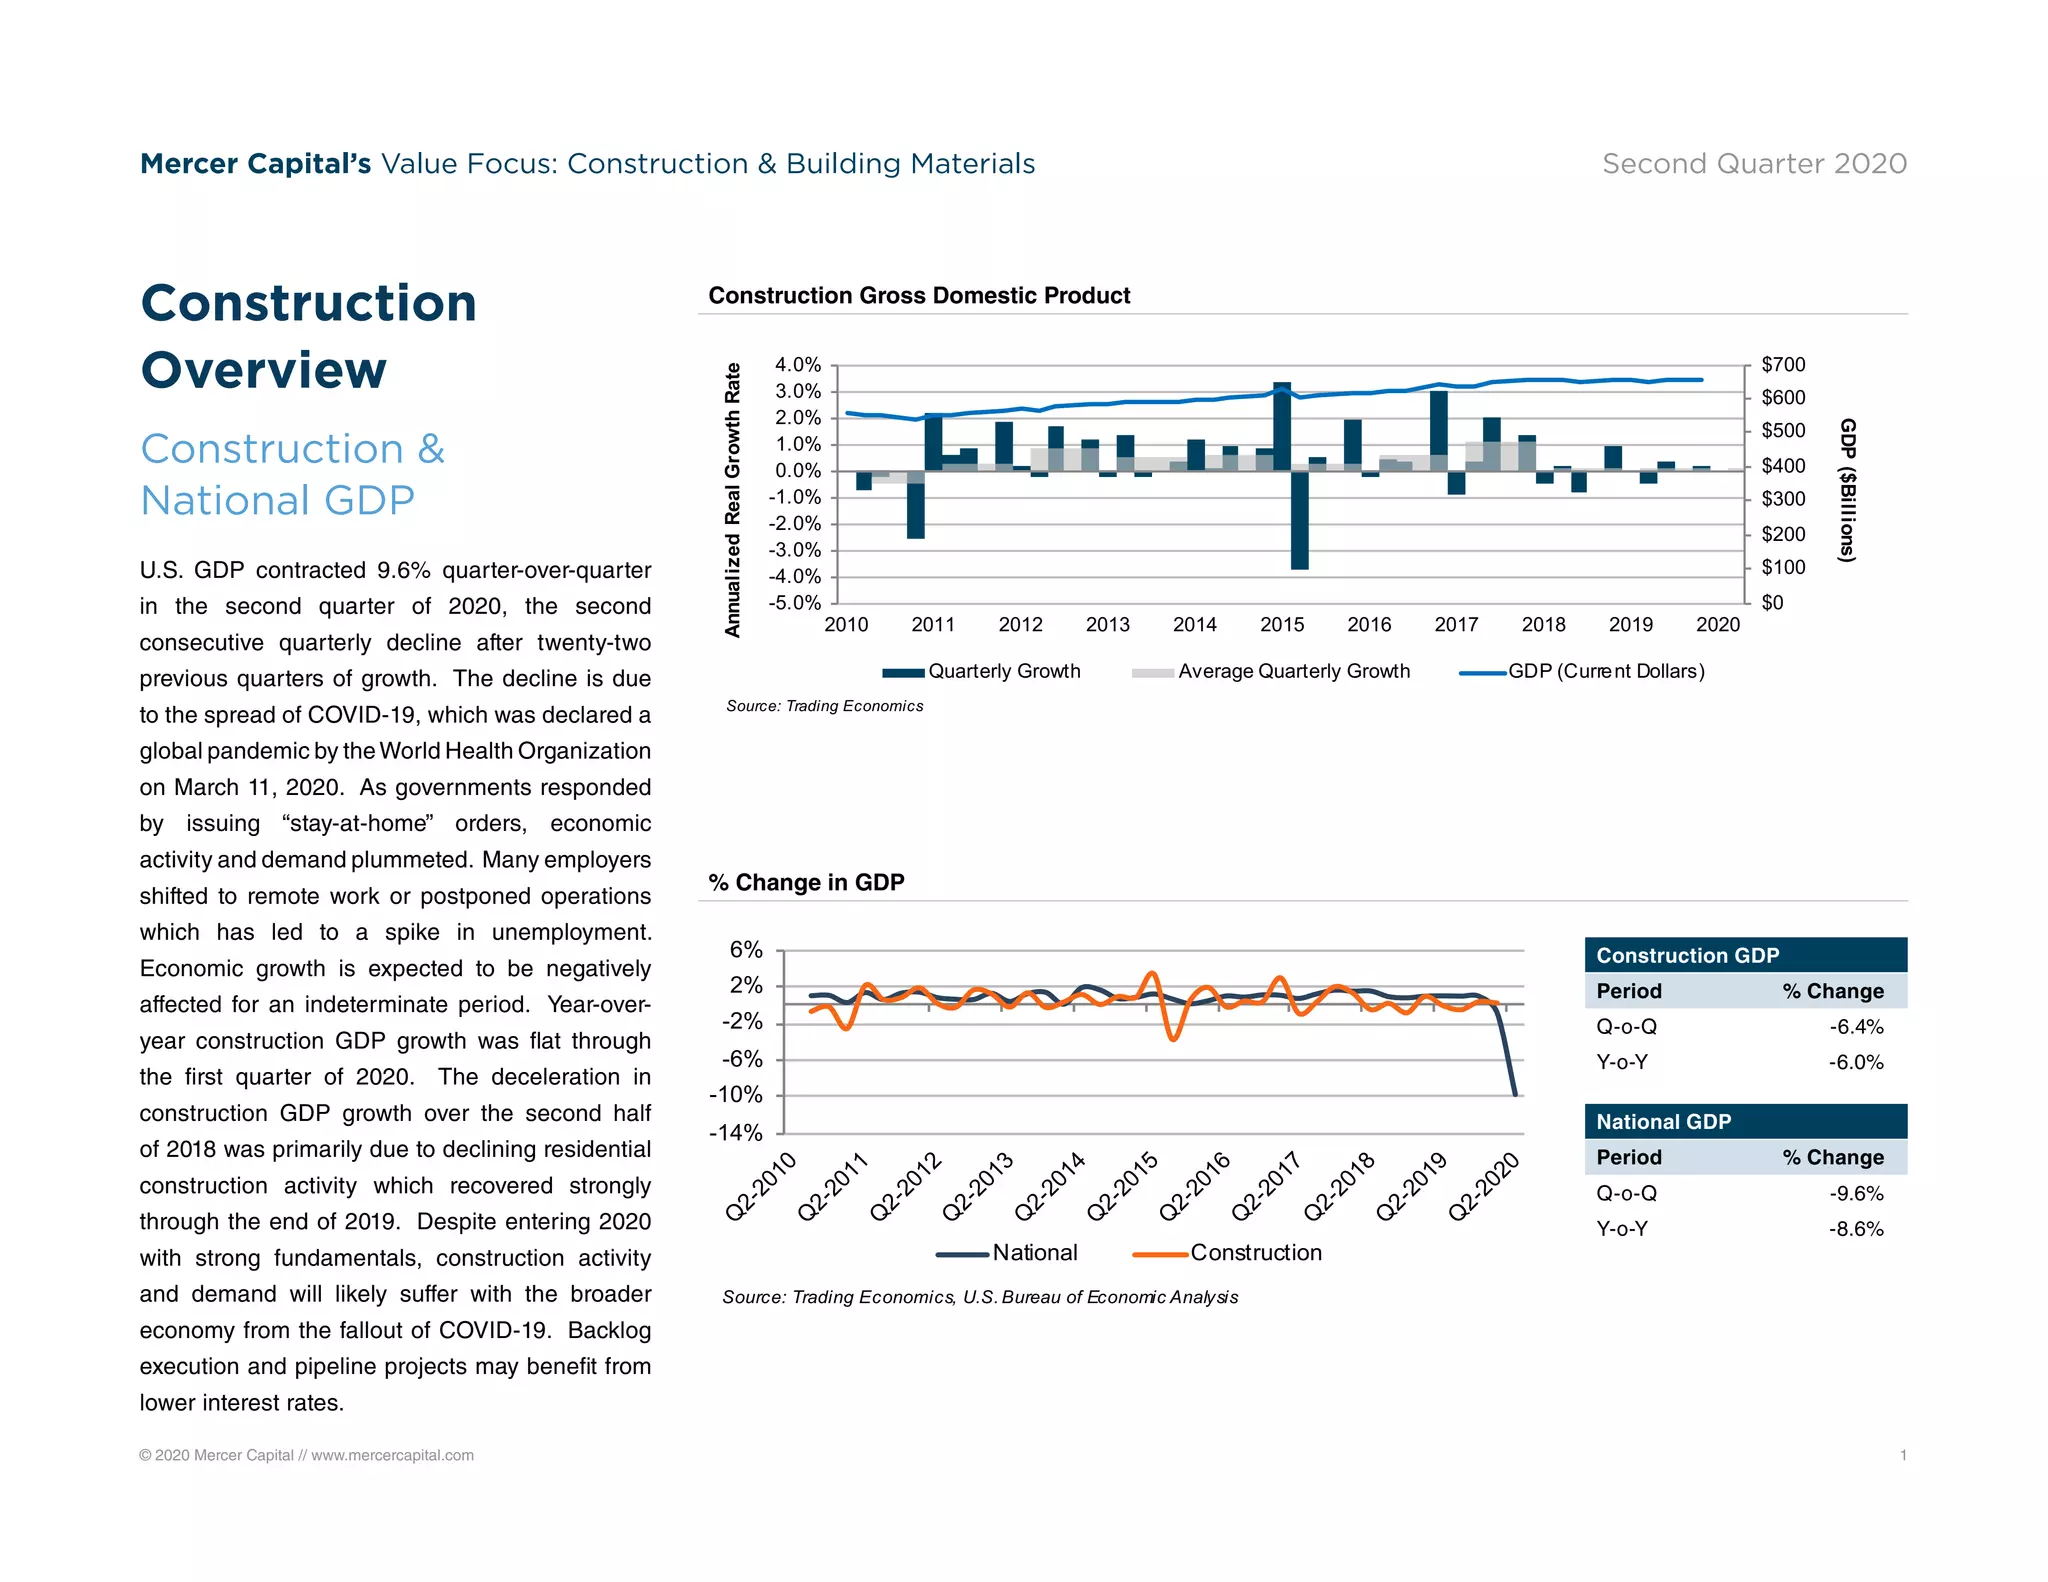
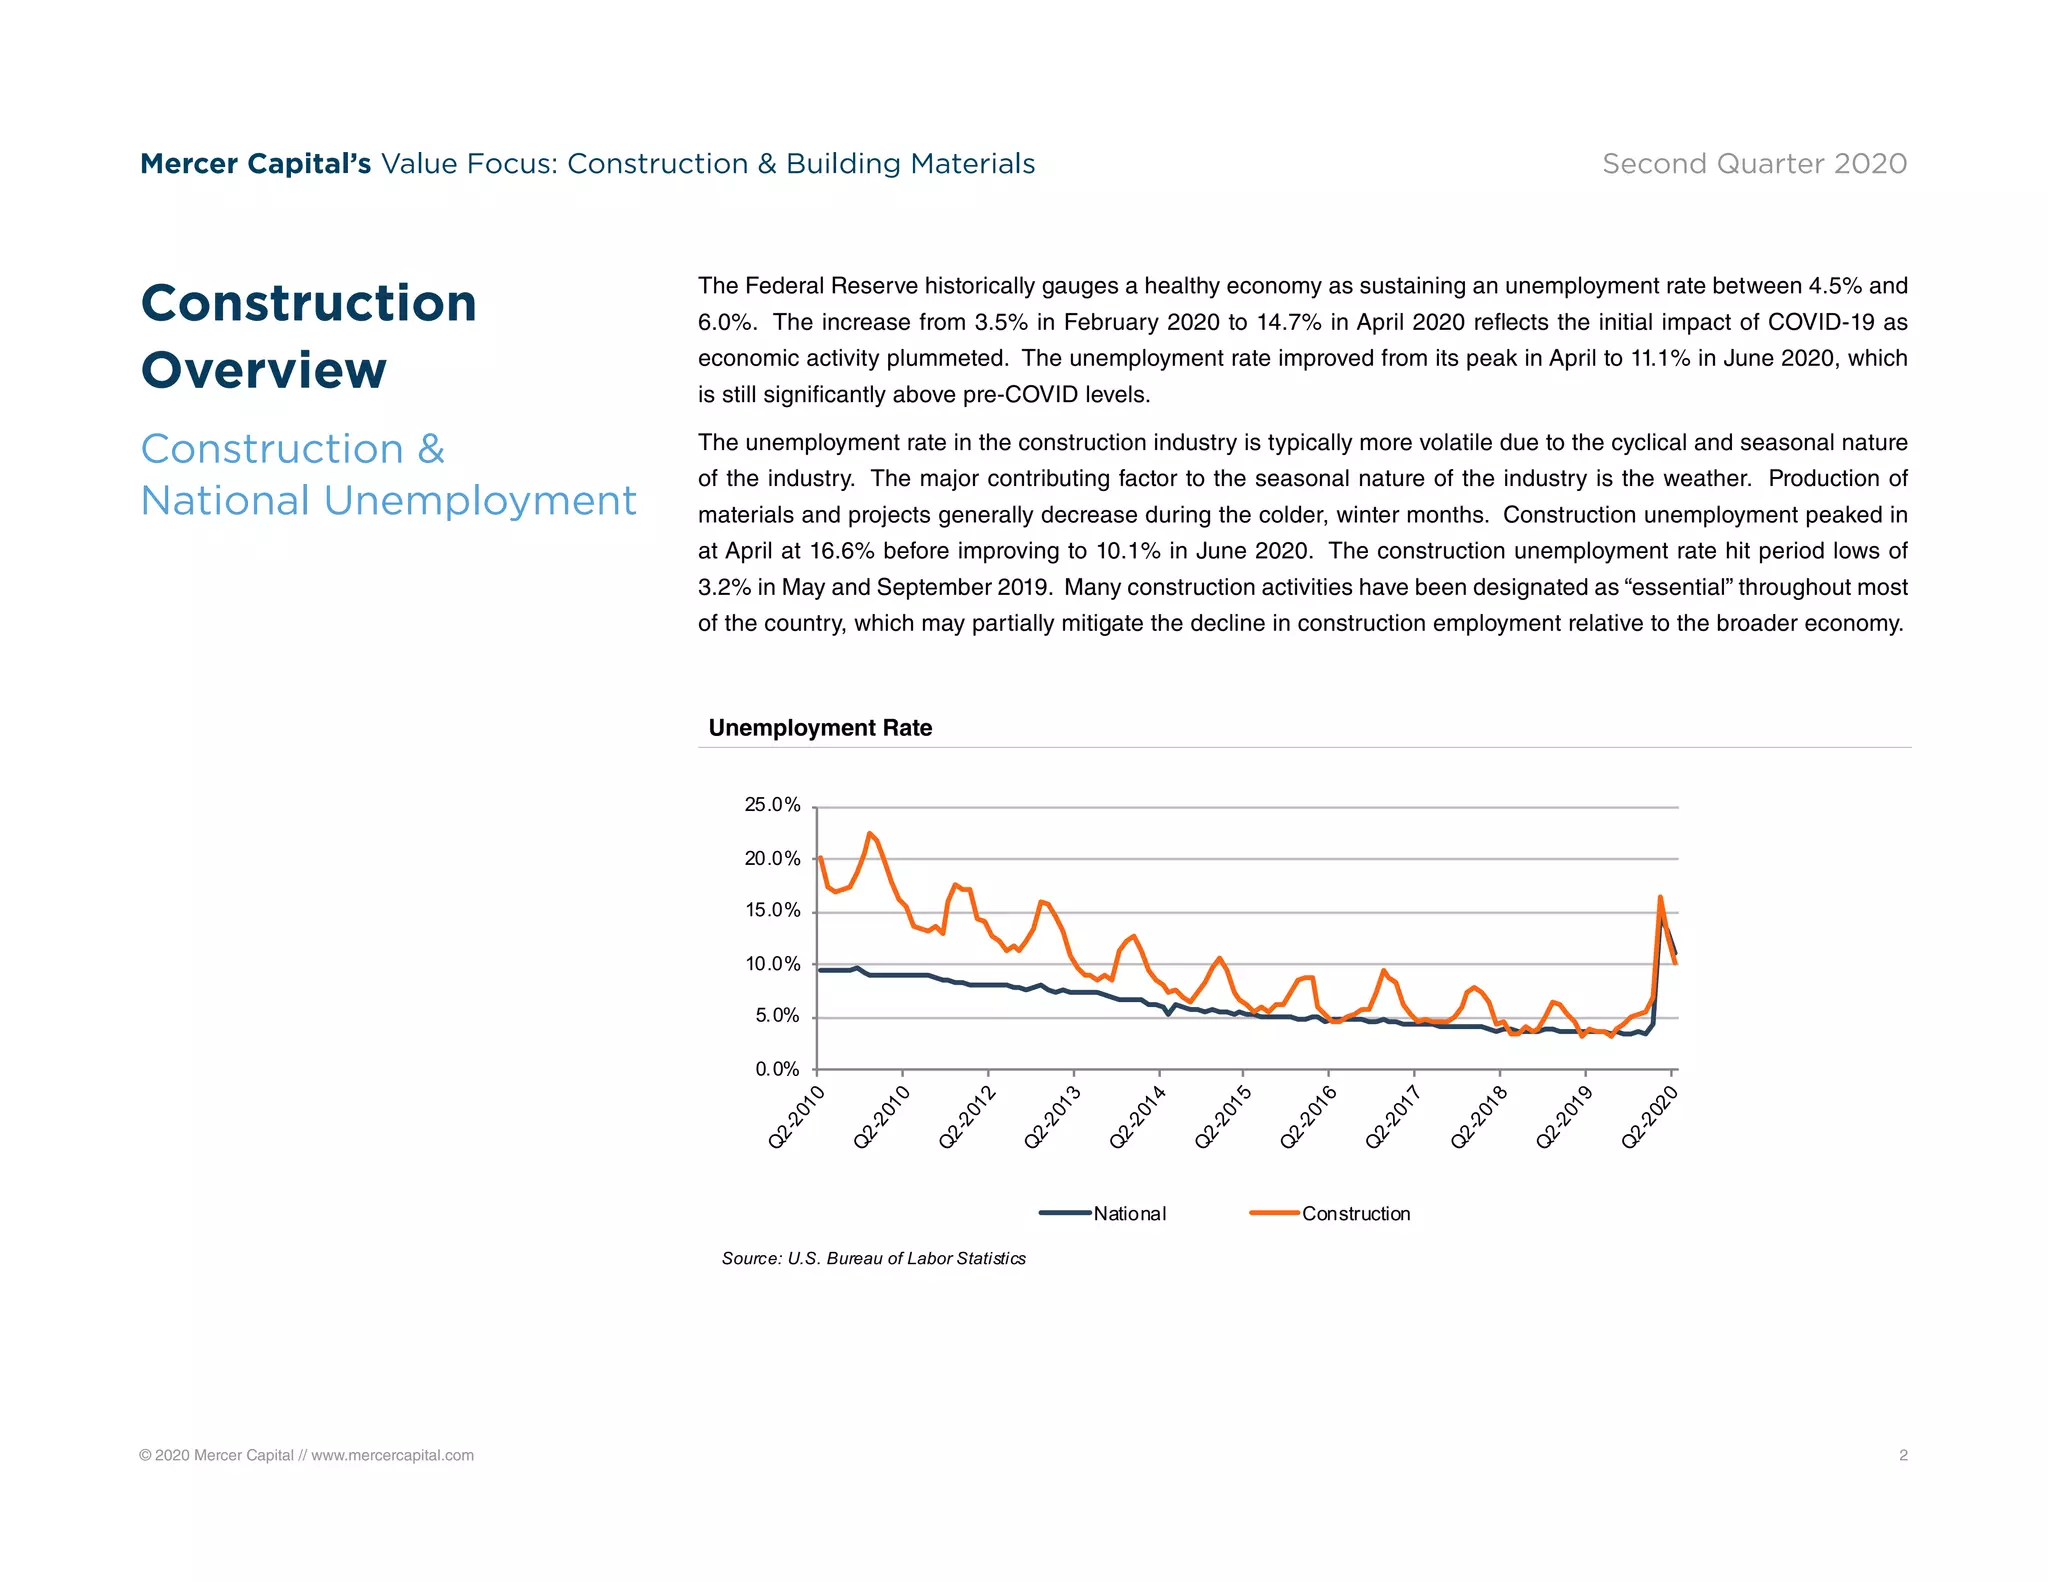
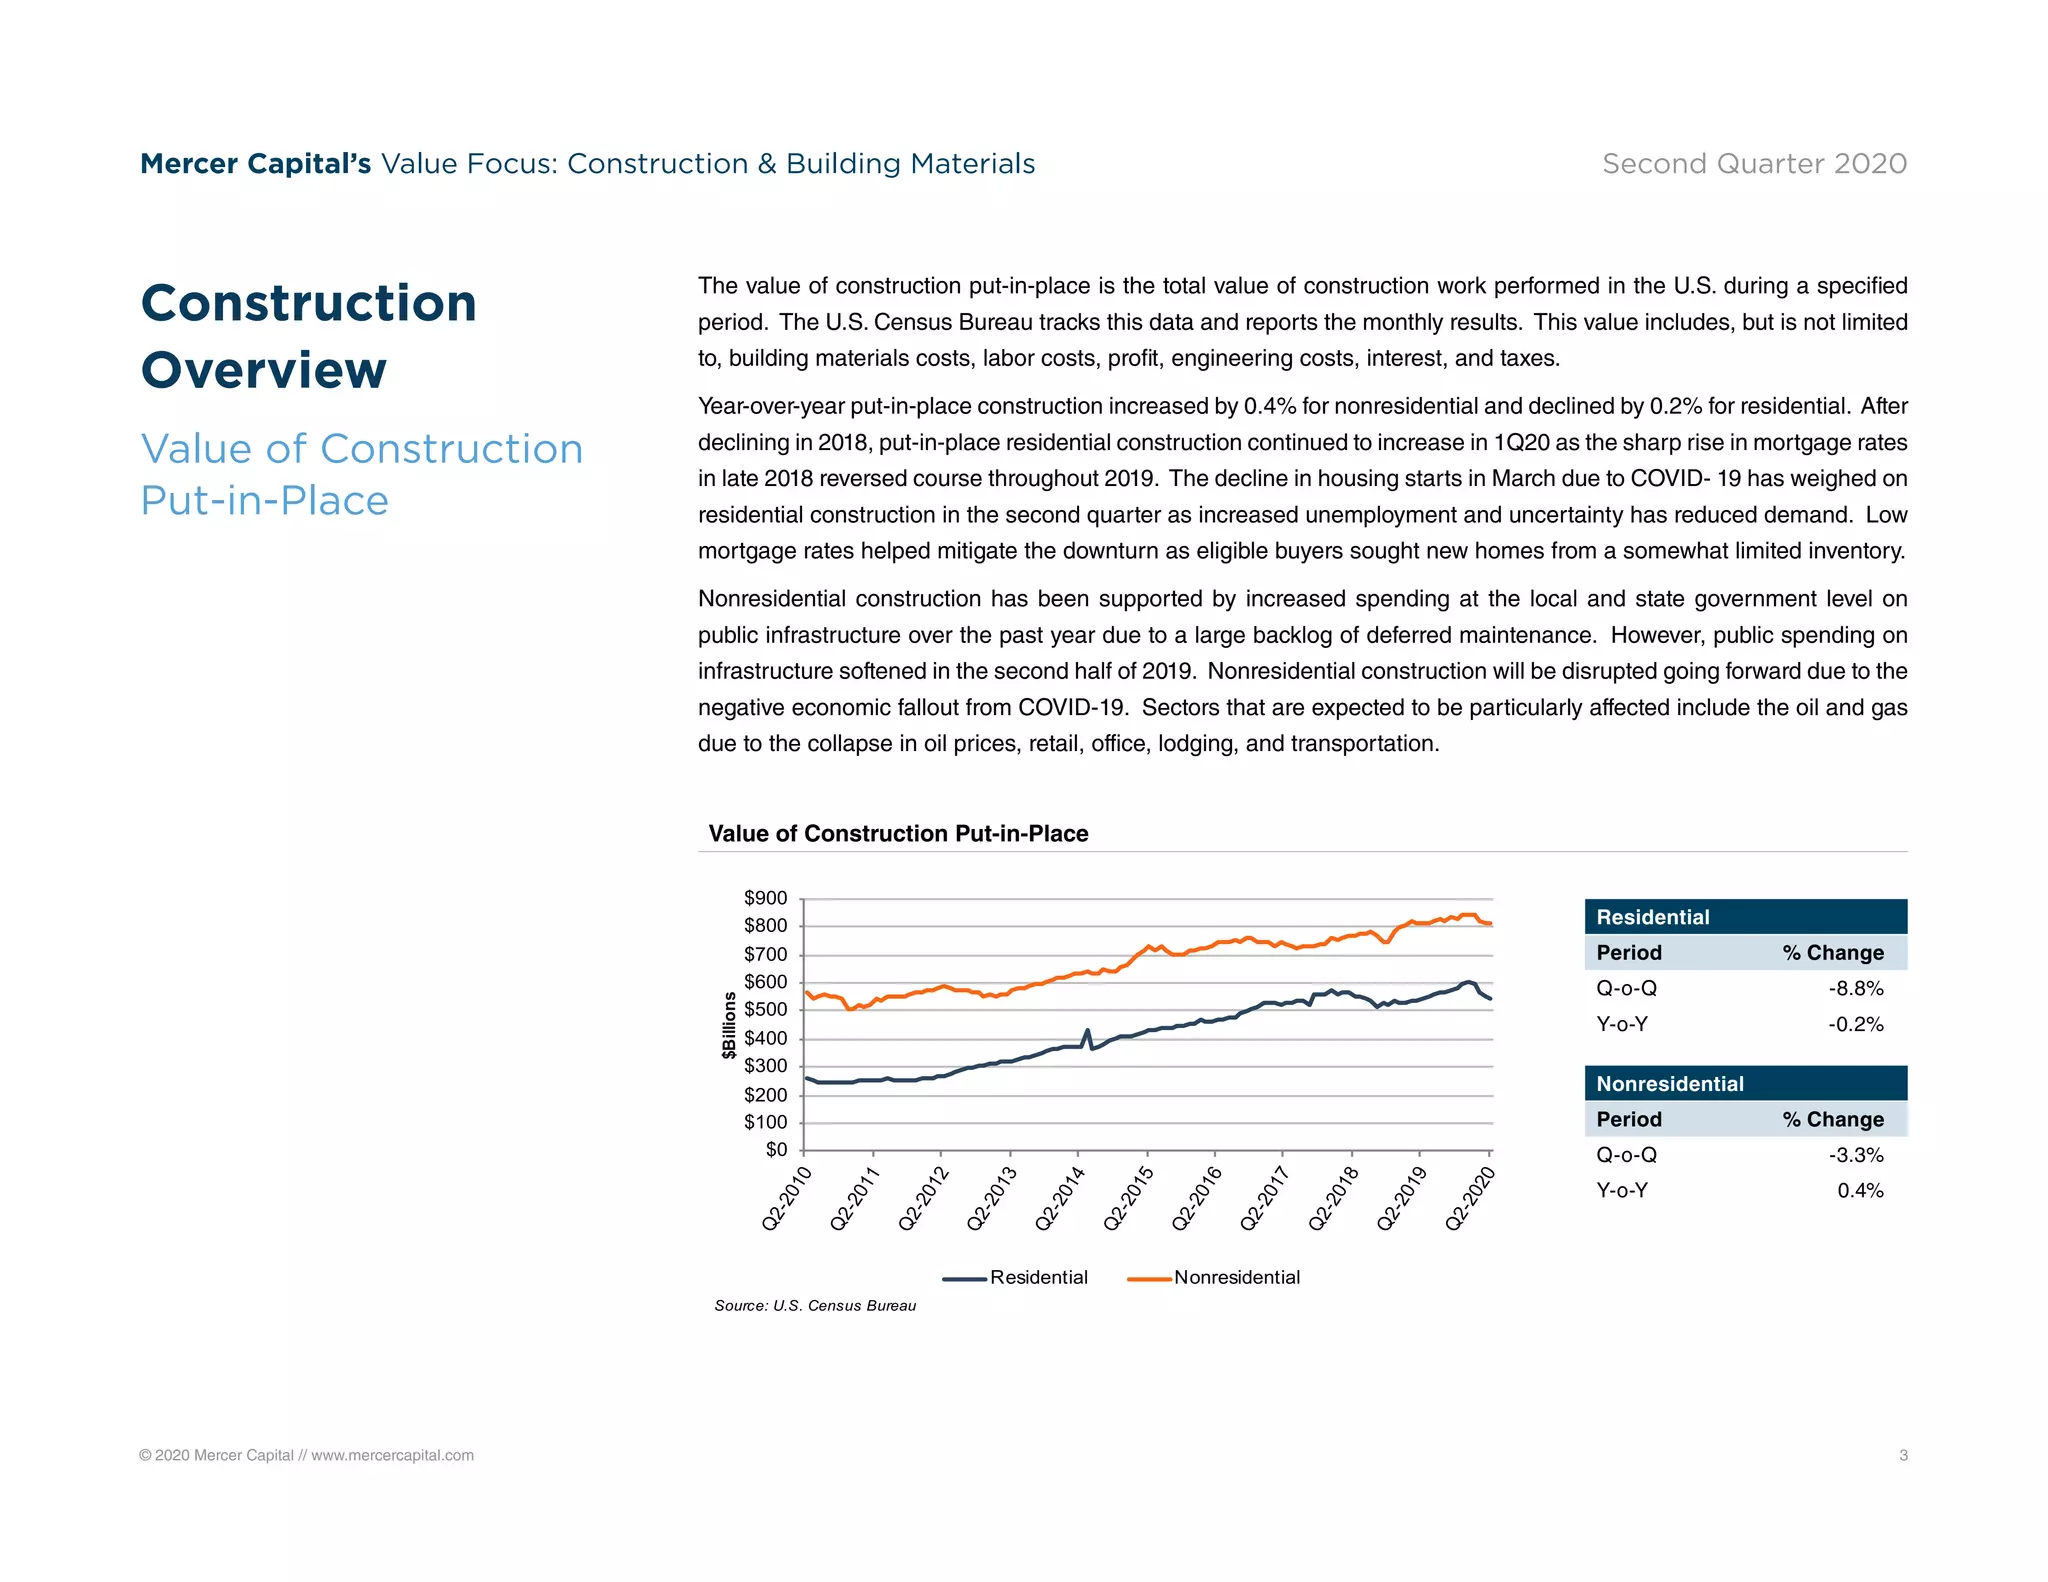


The second quarter of 2020 experienced a historic decline in U.S. GDP due to the COVID-19 pandemic, with a contraction of 9.6%. The construction industry was deemed essential, allowing some continuity in operations, but faced significant disruptions and rising unemployment rates, peaking at 16.6% in April. While the residential sector showed signs of recovery towards the end of the quarter, non-residential construction remains under pressure, particularly in sectors like hospitality and retail, influenced by economic uncertainty and shifts in public spending.


