Download to read offline
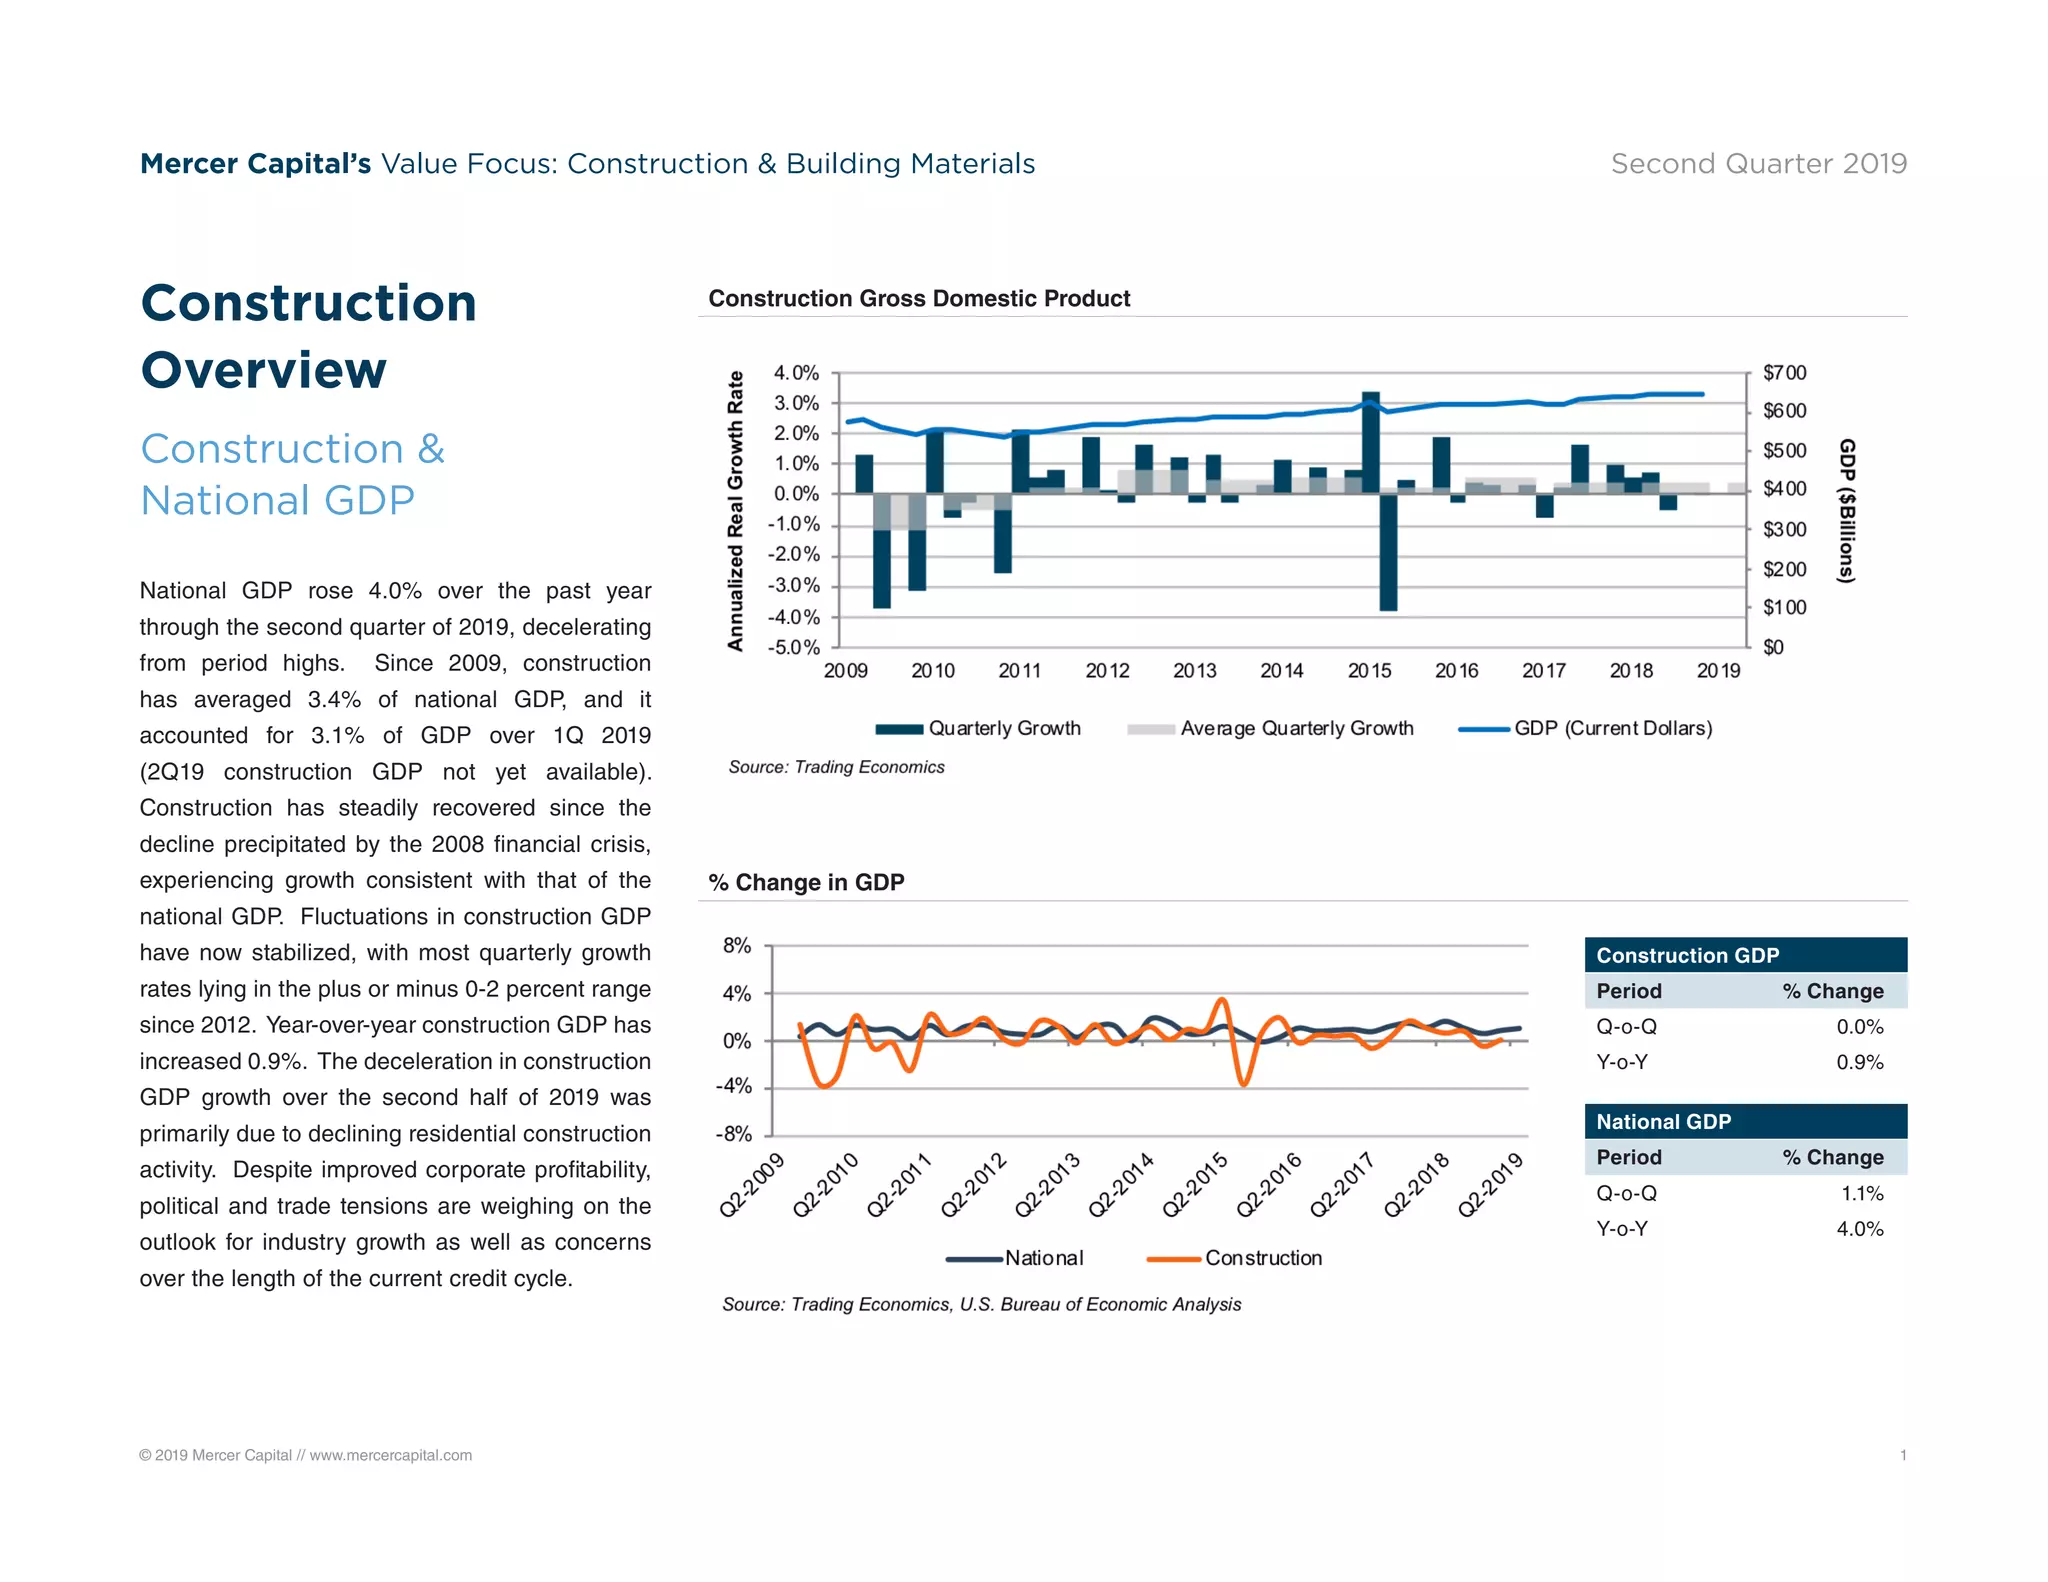
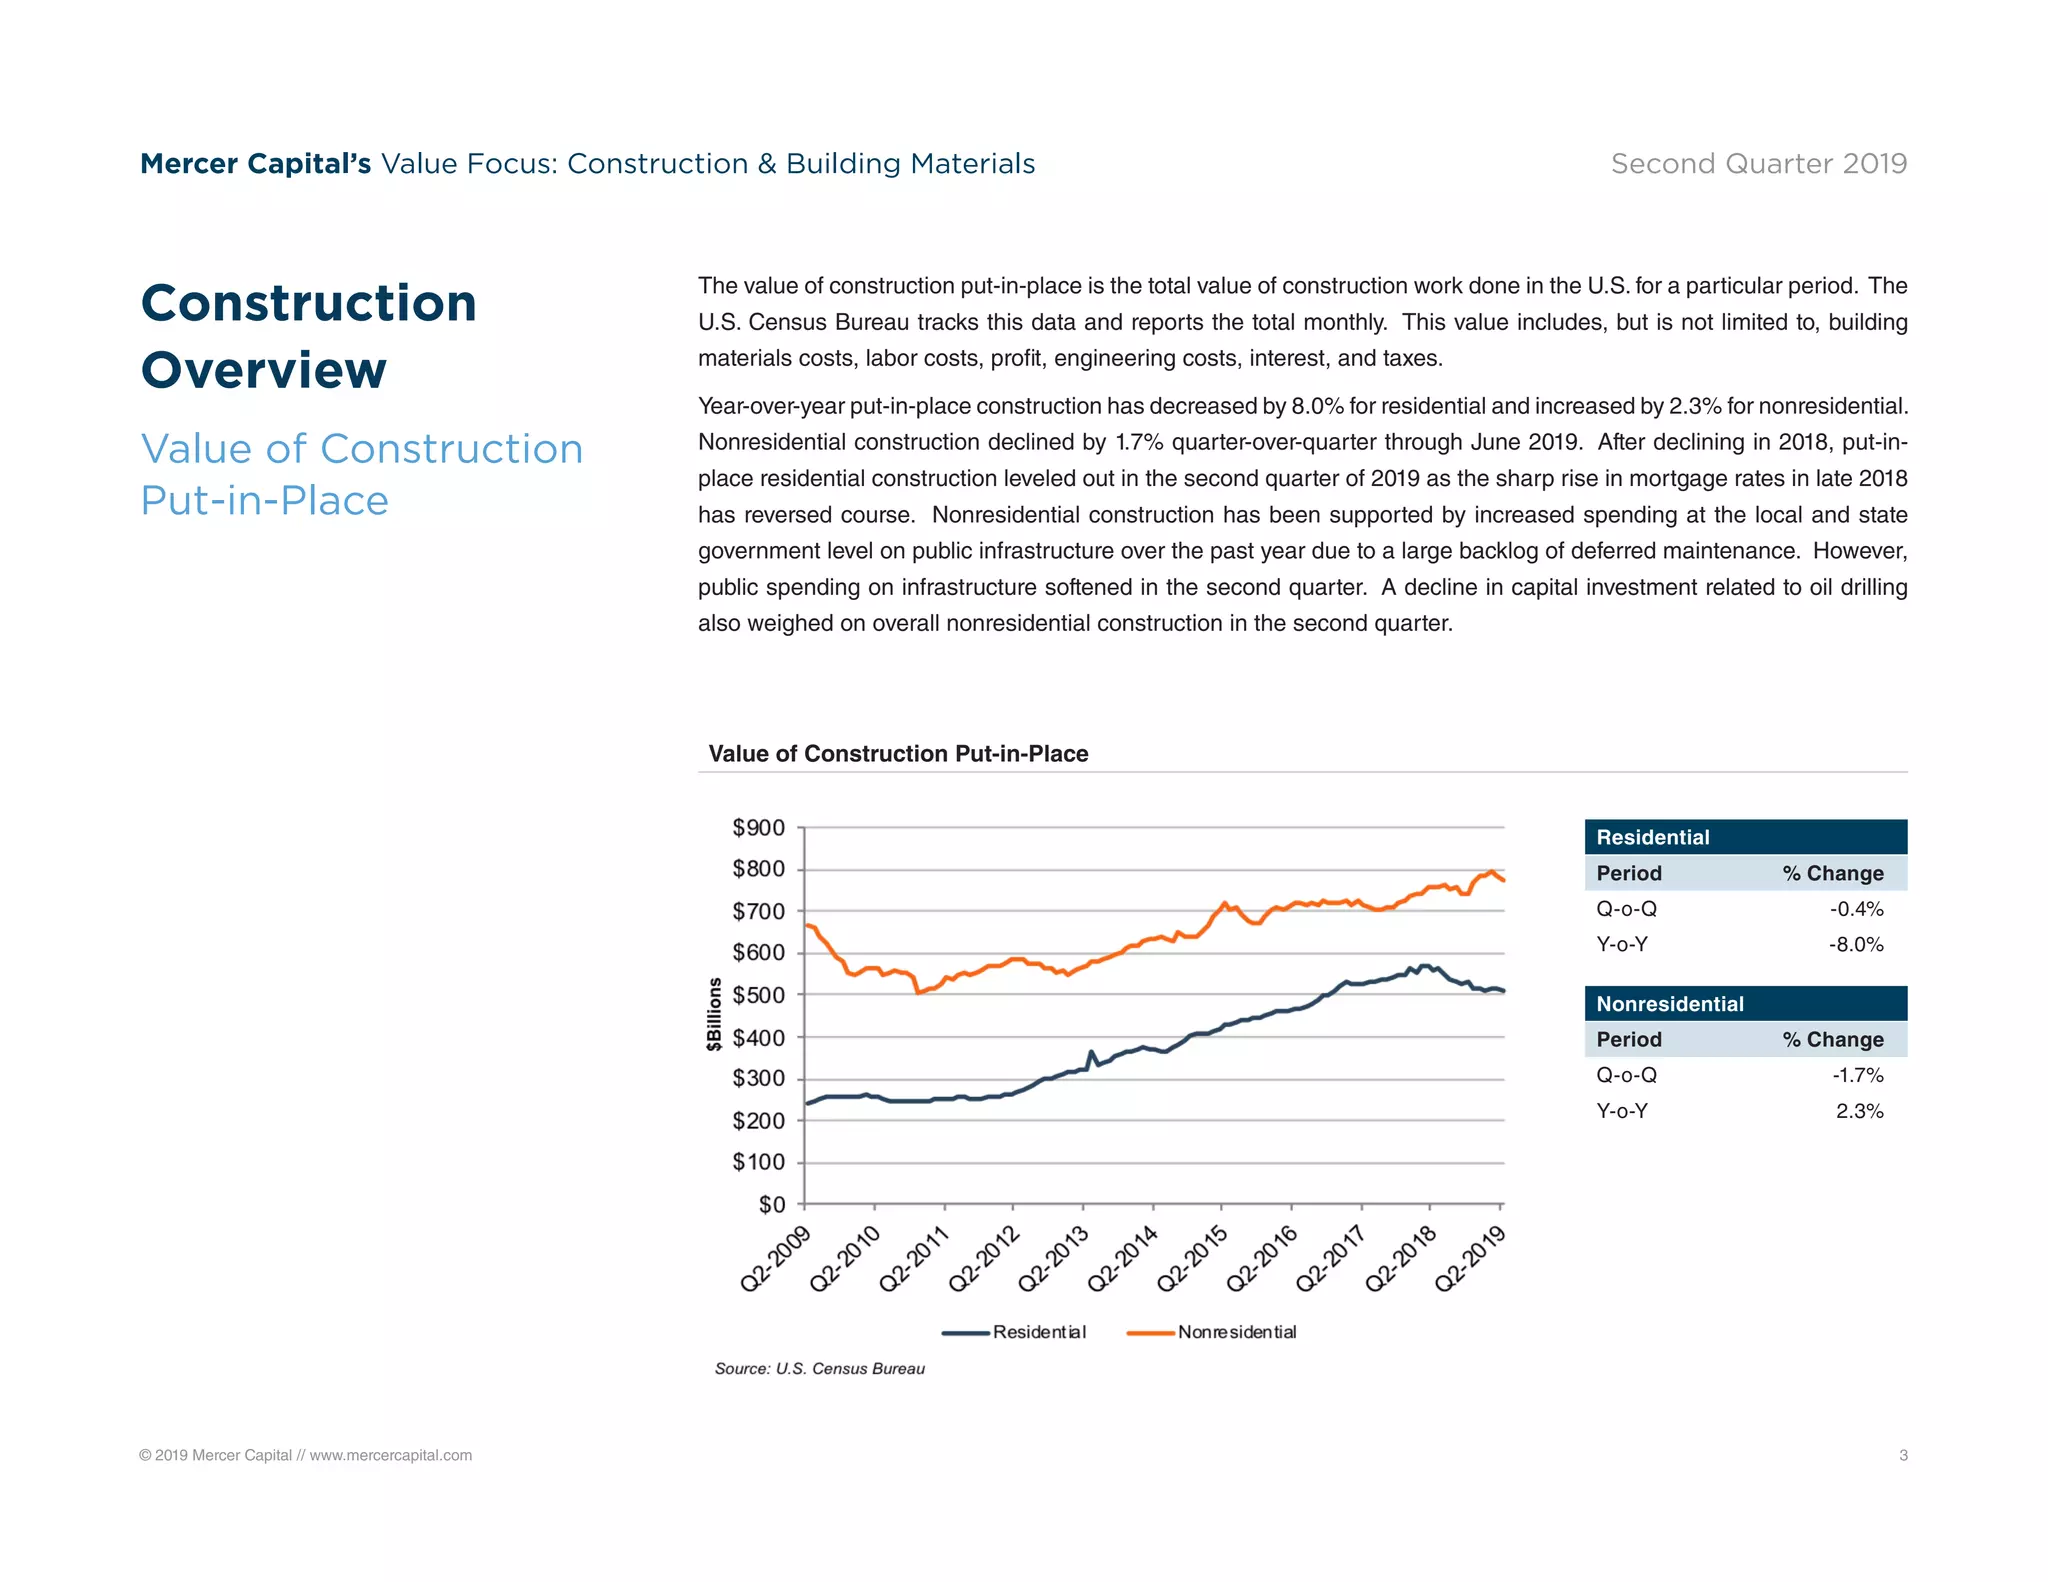
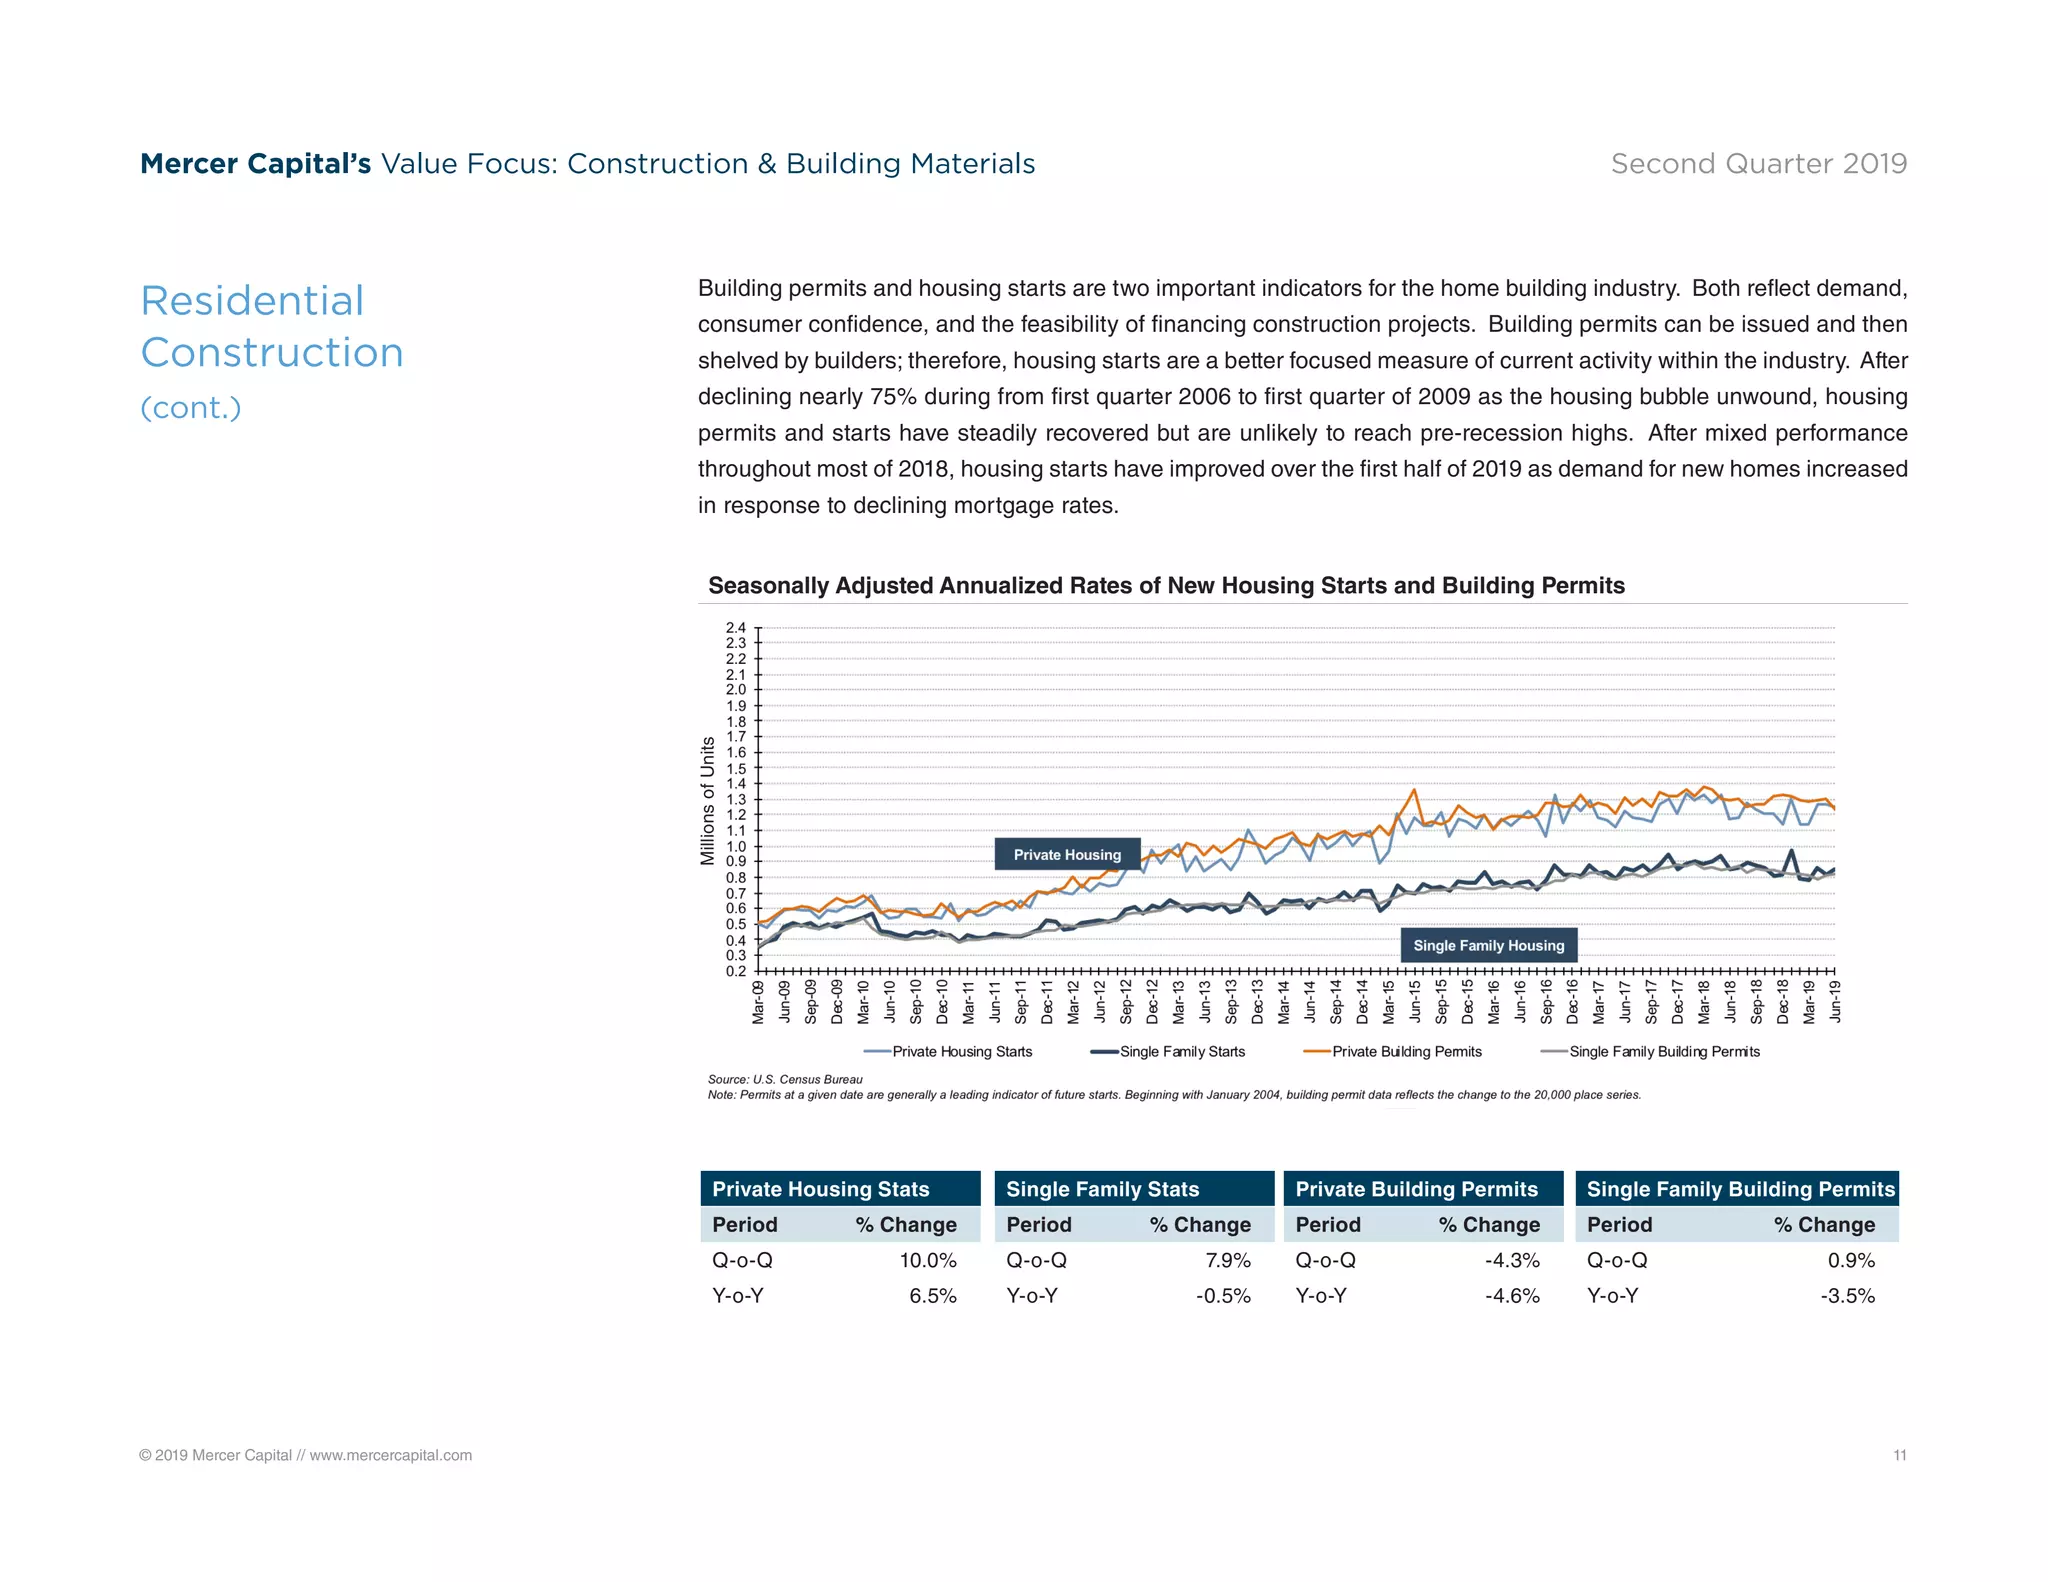


The second quarter of 2019 shows a rebound in residential construction after a downturn in late 2018, aided by lower mortgage rates, though ongoing trade tensions and concerns over economic growth persist. Nonresidential construction has supported public spending, particularly on infrastructure, but has faced challenges due to rising material costs and the uncertainty over federal funding. The construction industry's future remains uncertain, contingent upon macroeconomic factors, government investment, and demand in both residential and nonresidential markets.


