Download to read offline
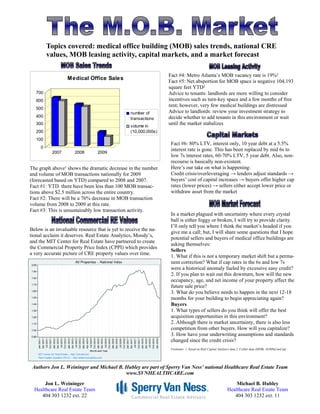


The document summarizes recent trends in the medical office building (MOB) real estate market, including a dramatic decrease in sales transactions and volume nationally from 2008 to 2009. Vacancy rates are high in metro Atlanta at 19% and net absorption is negative. The tightening of credit markets has increased capital costs for buyers, who are now offering higher capitalization rates. The author provides questions for both potential sellers and buyers of MOBs to consider in the current uncertain market environment.


