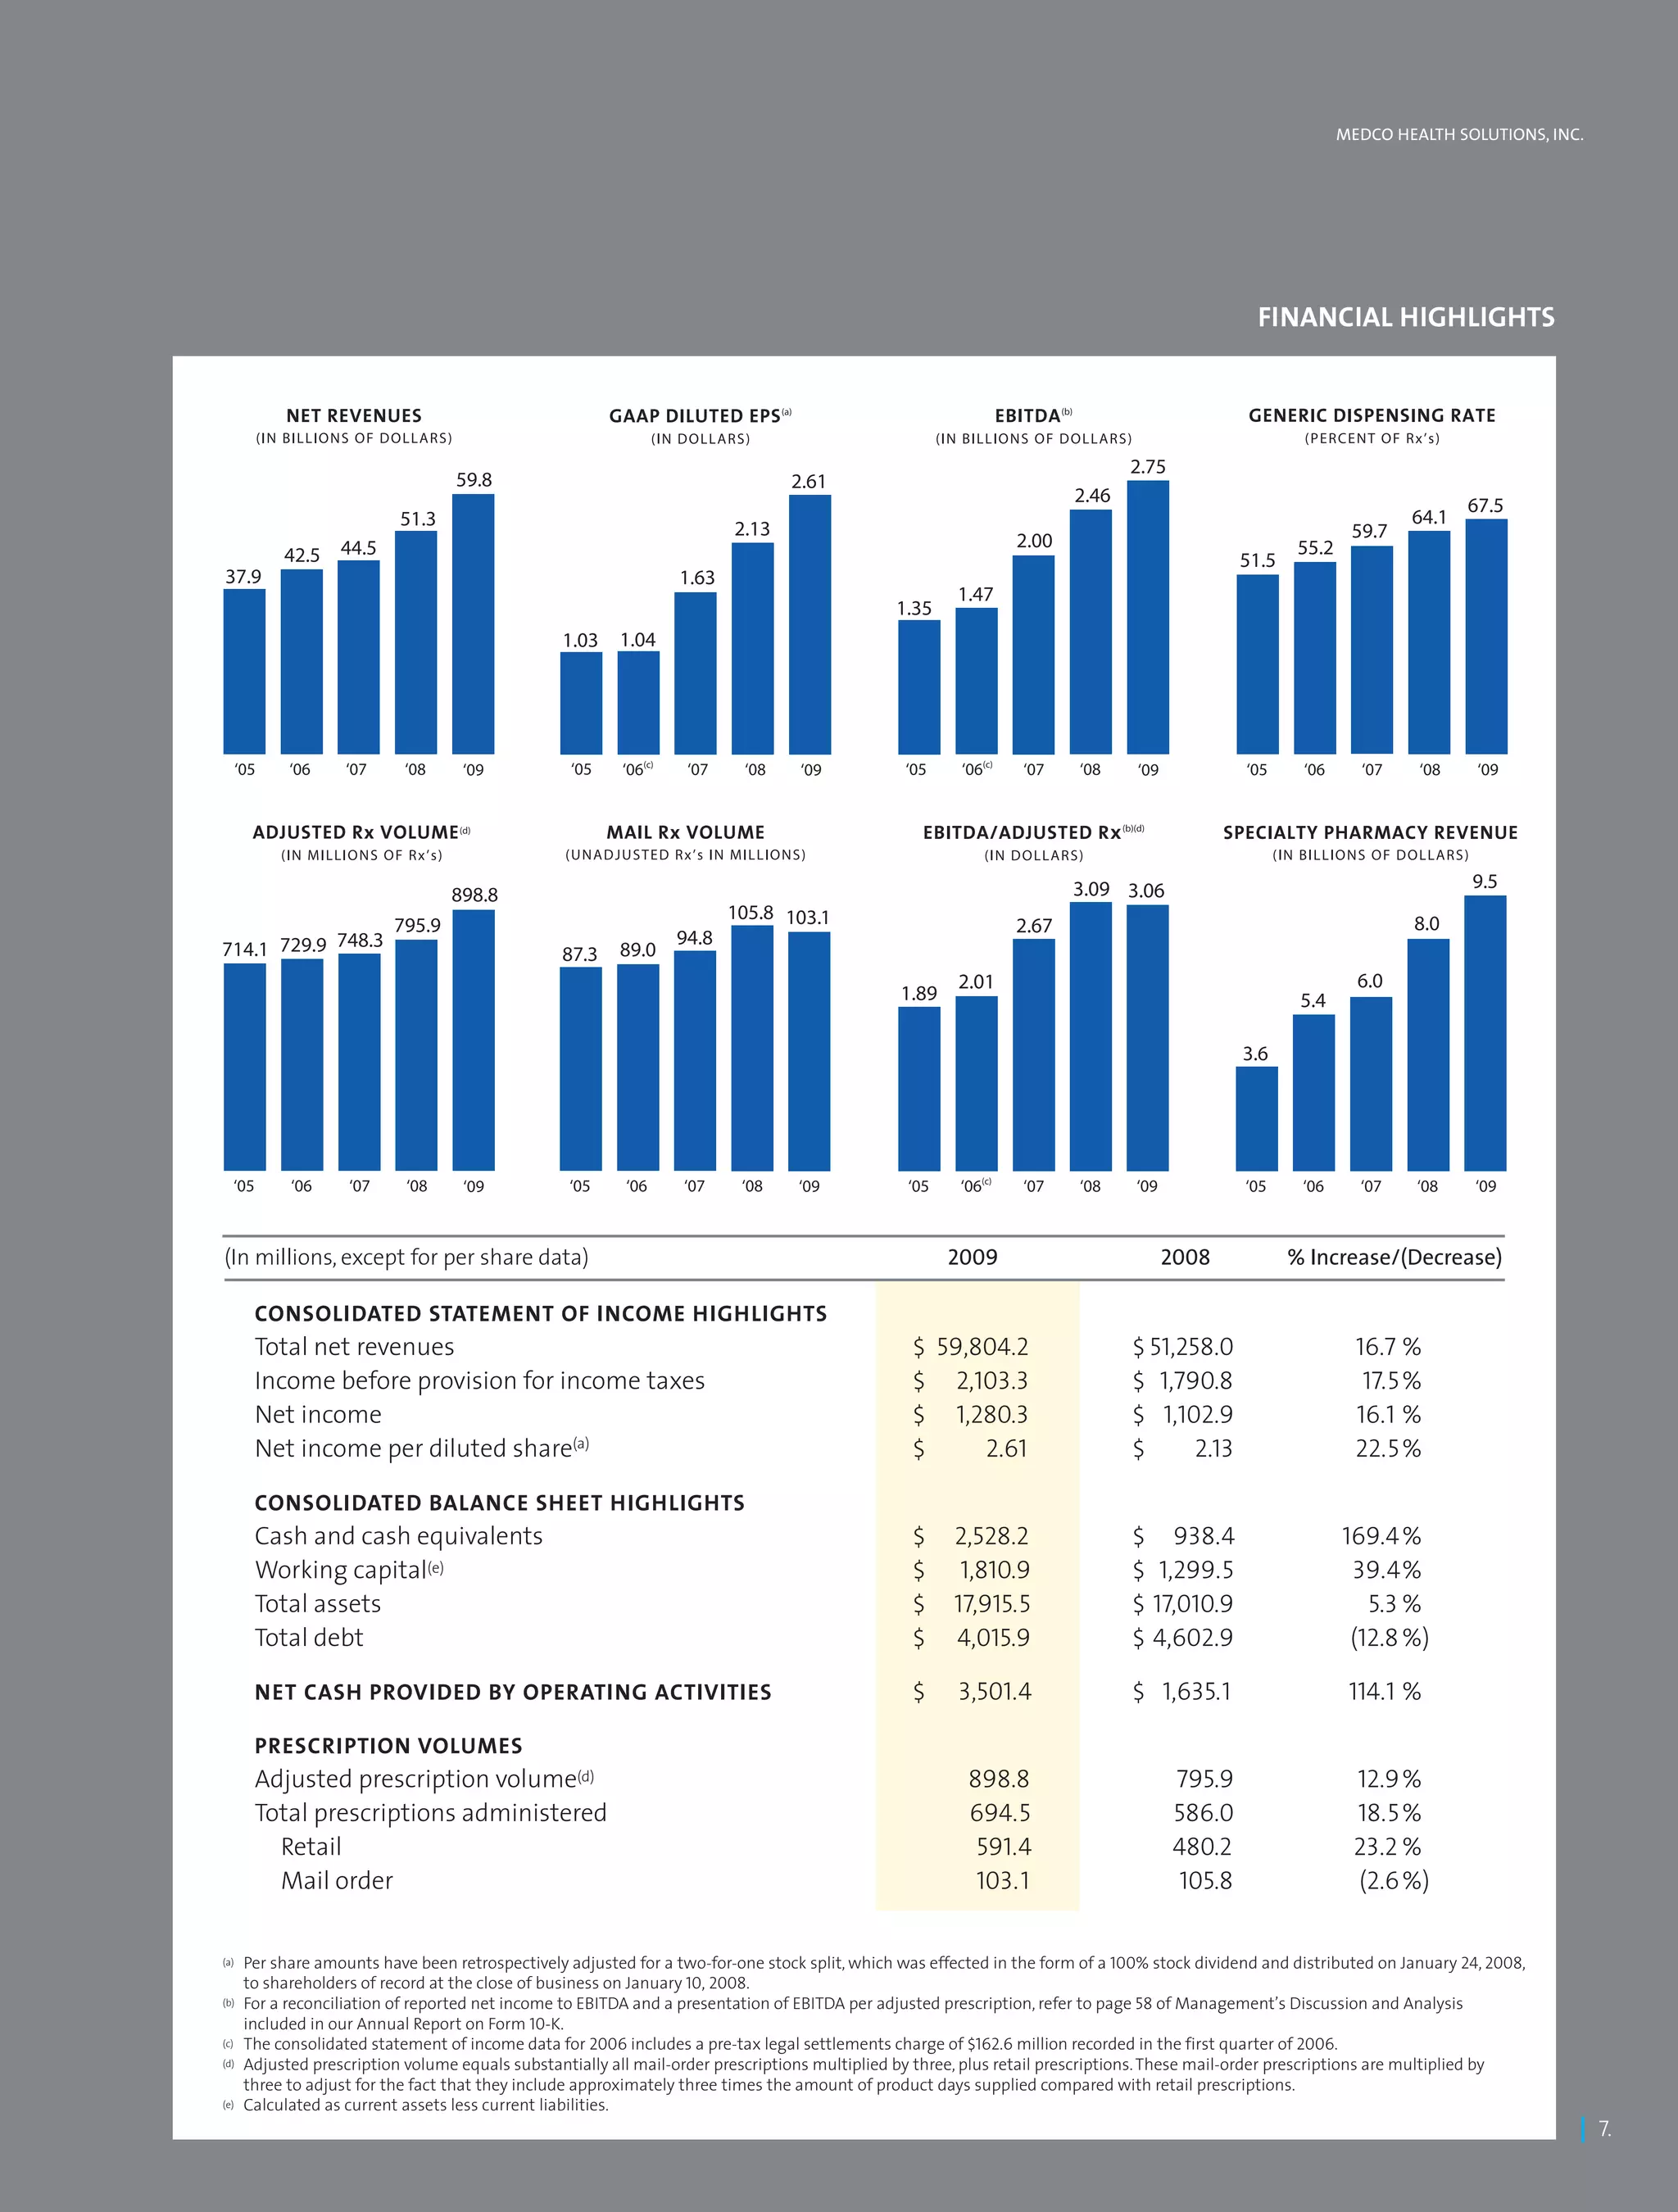
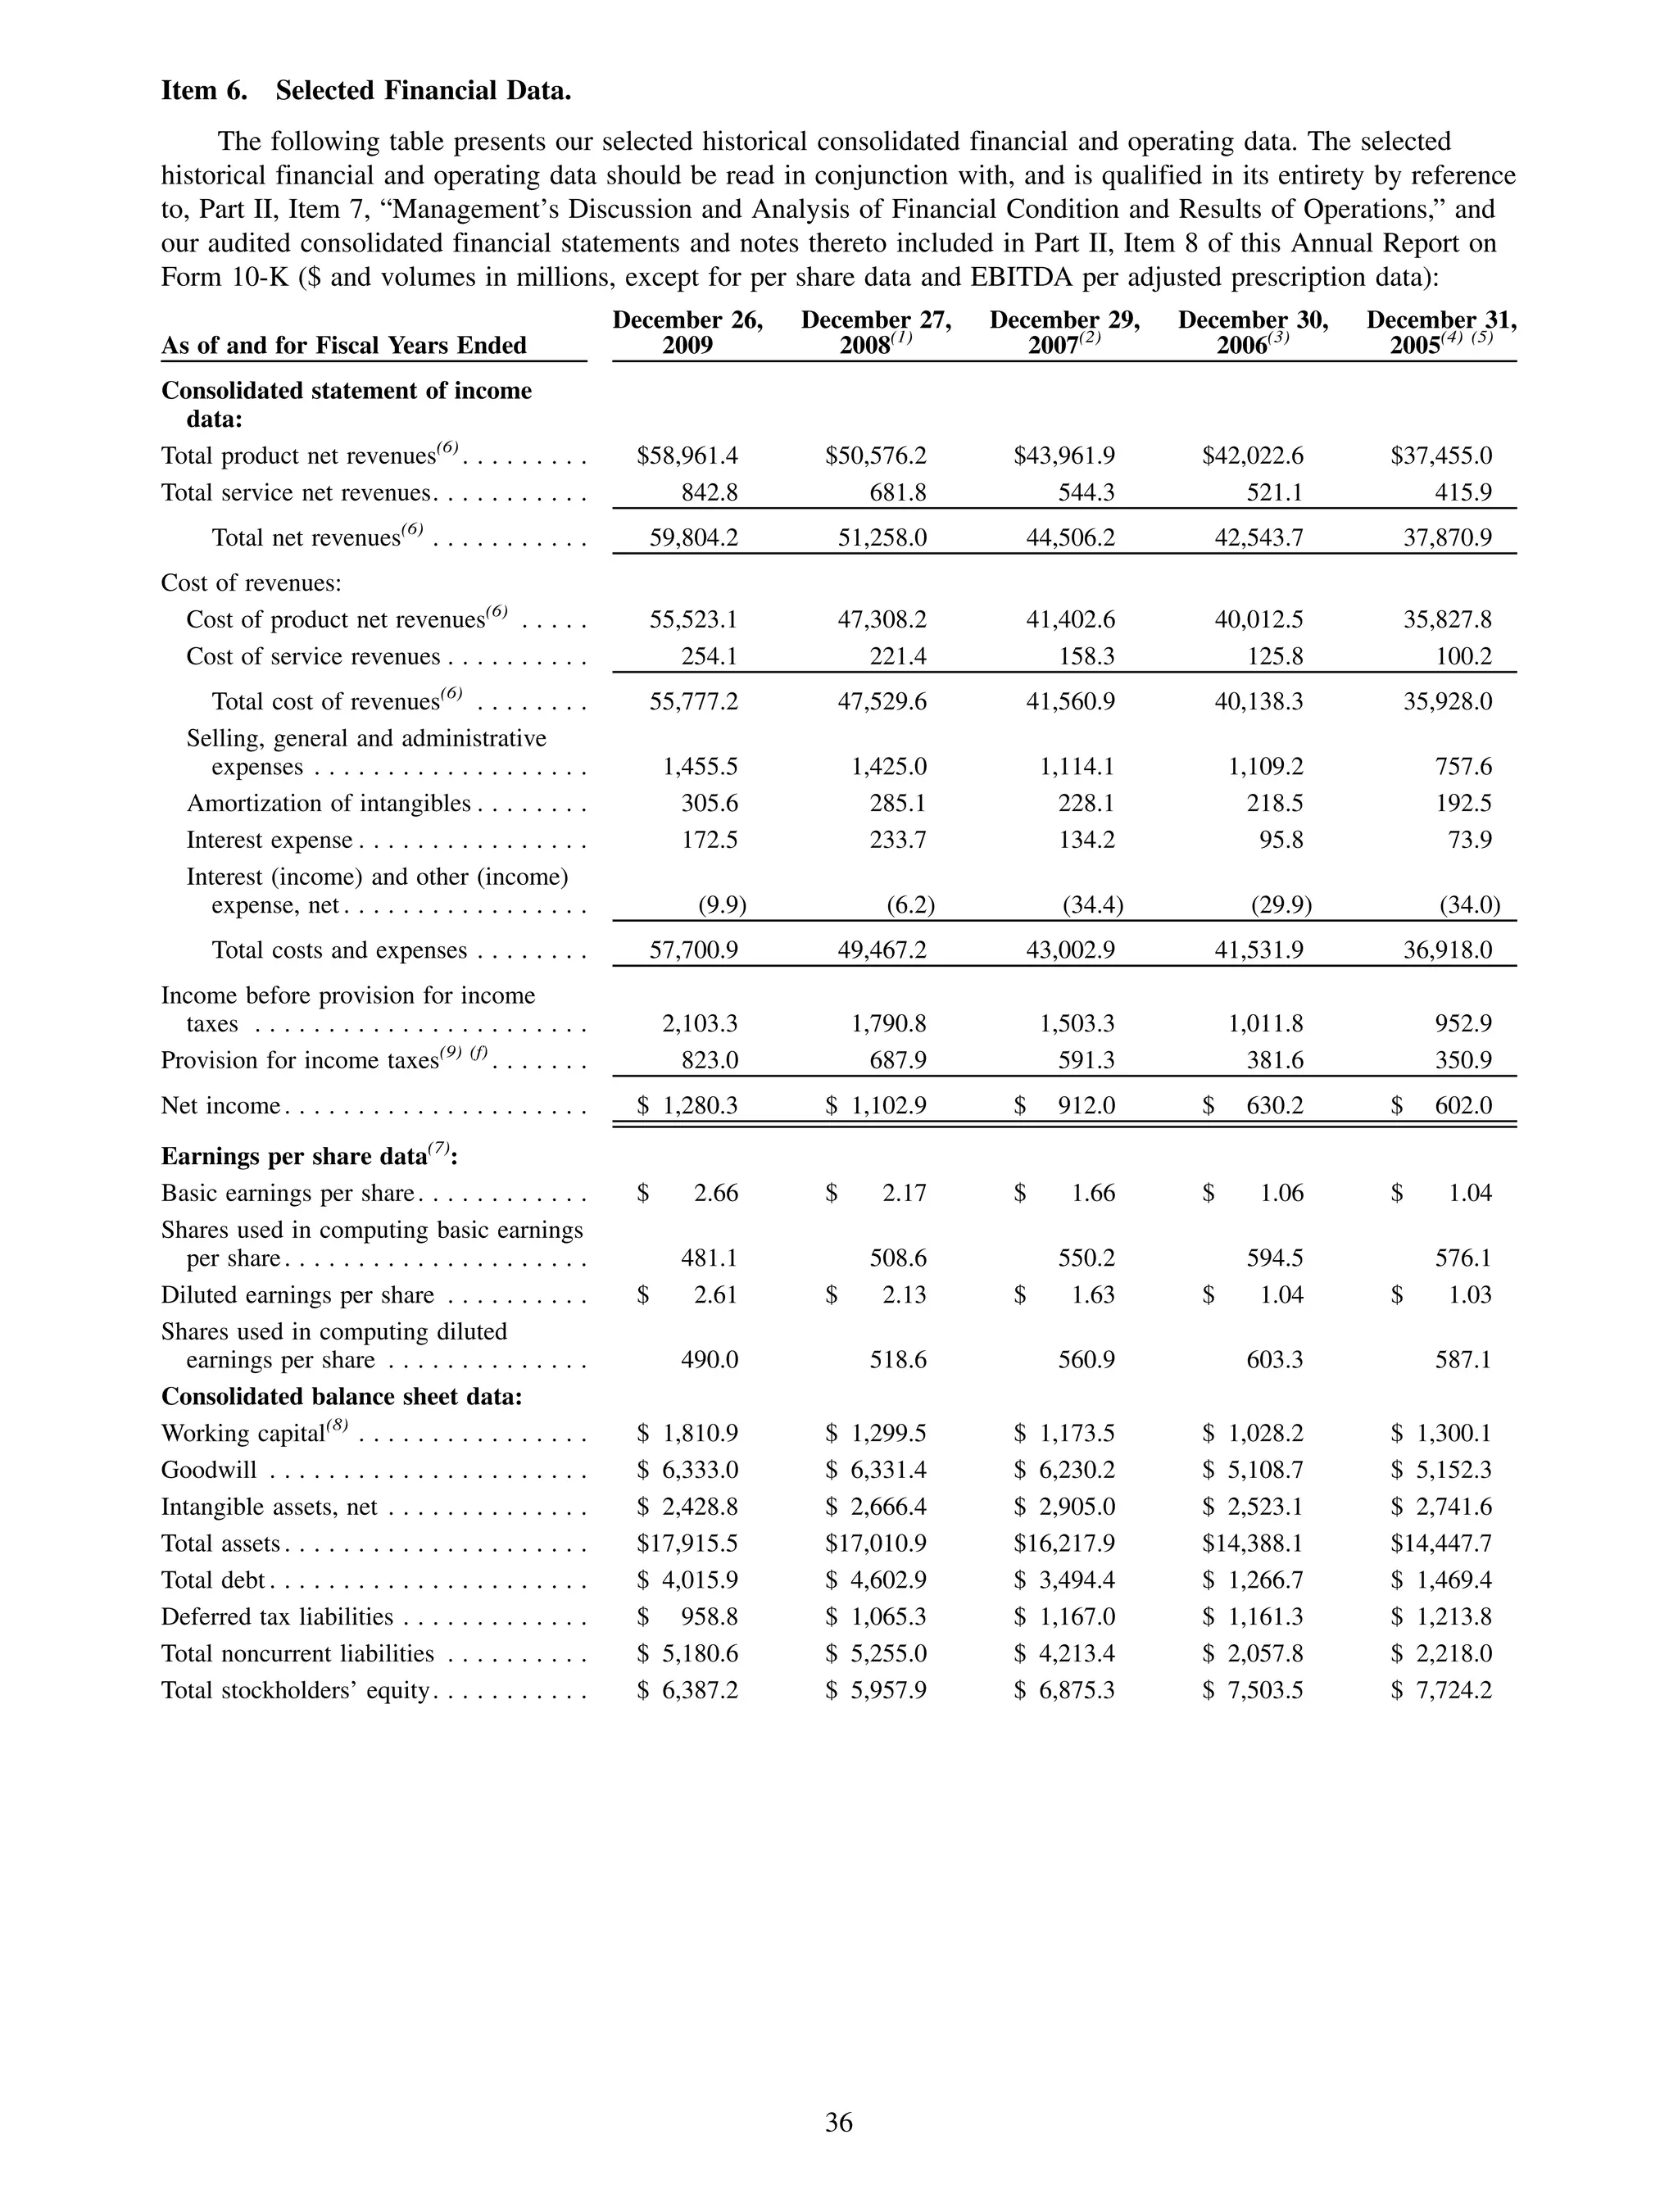
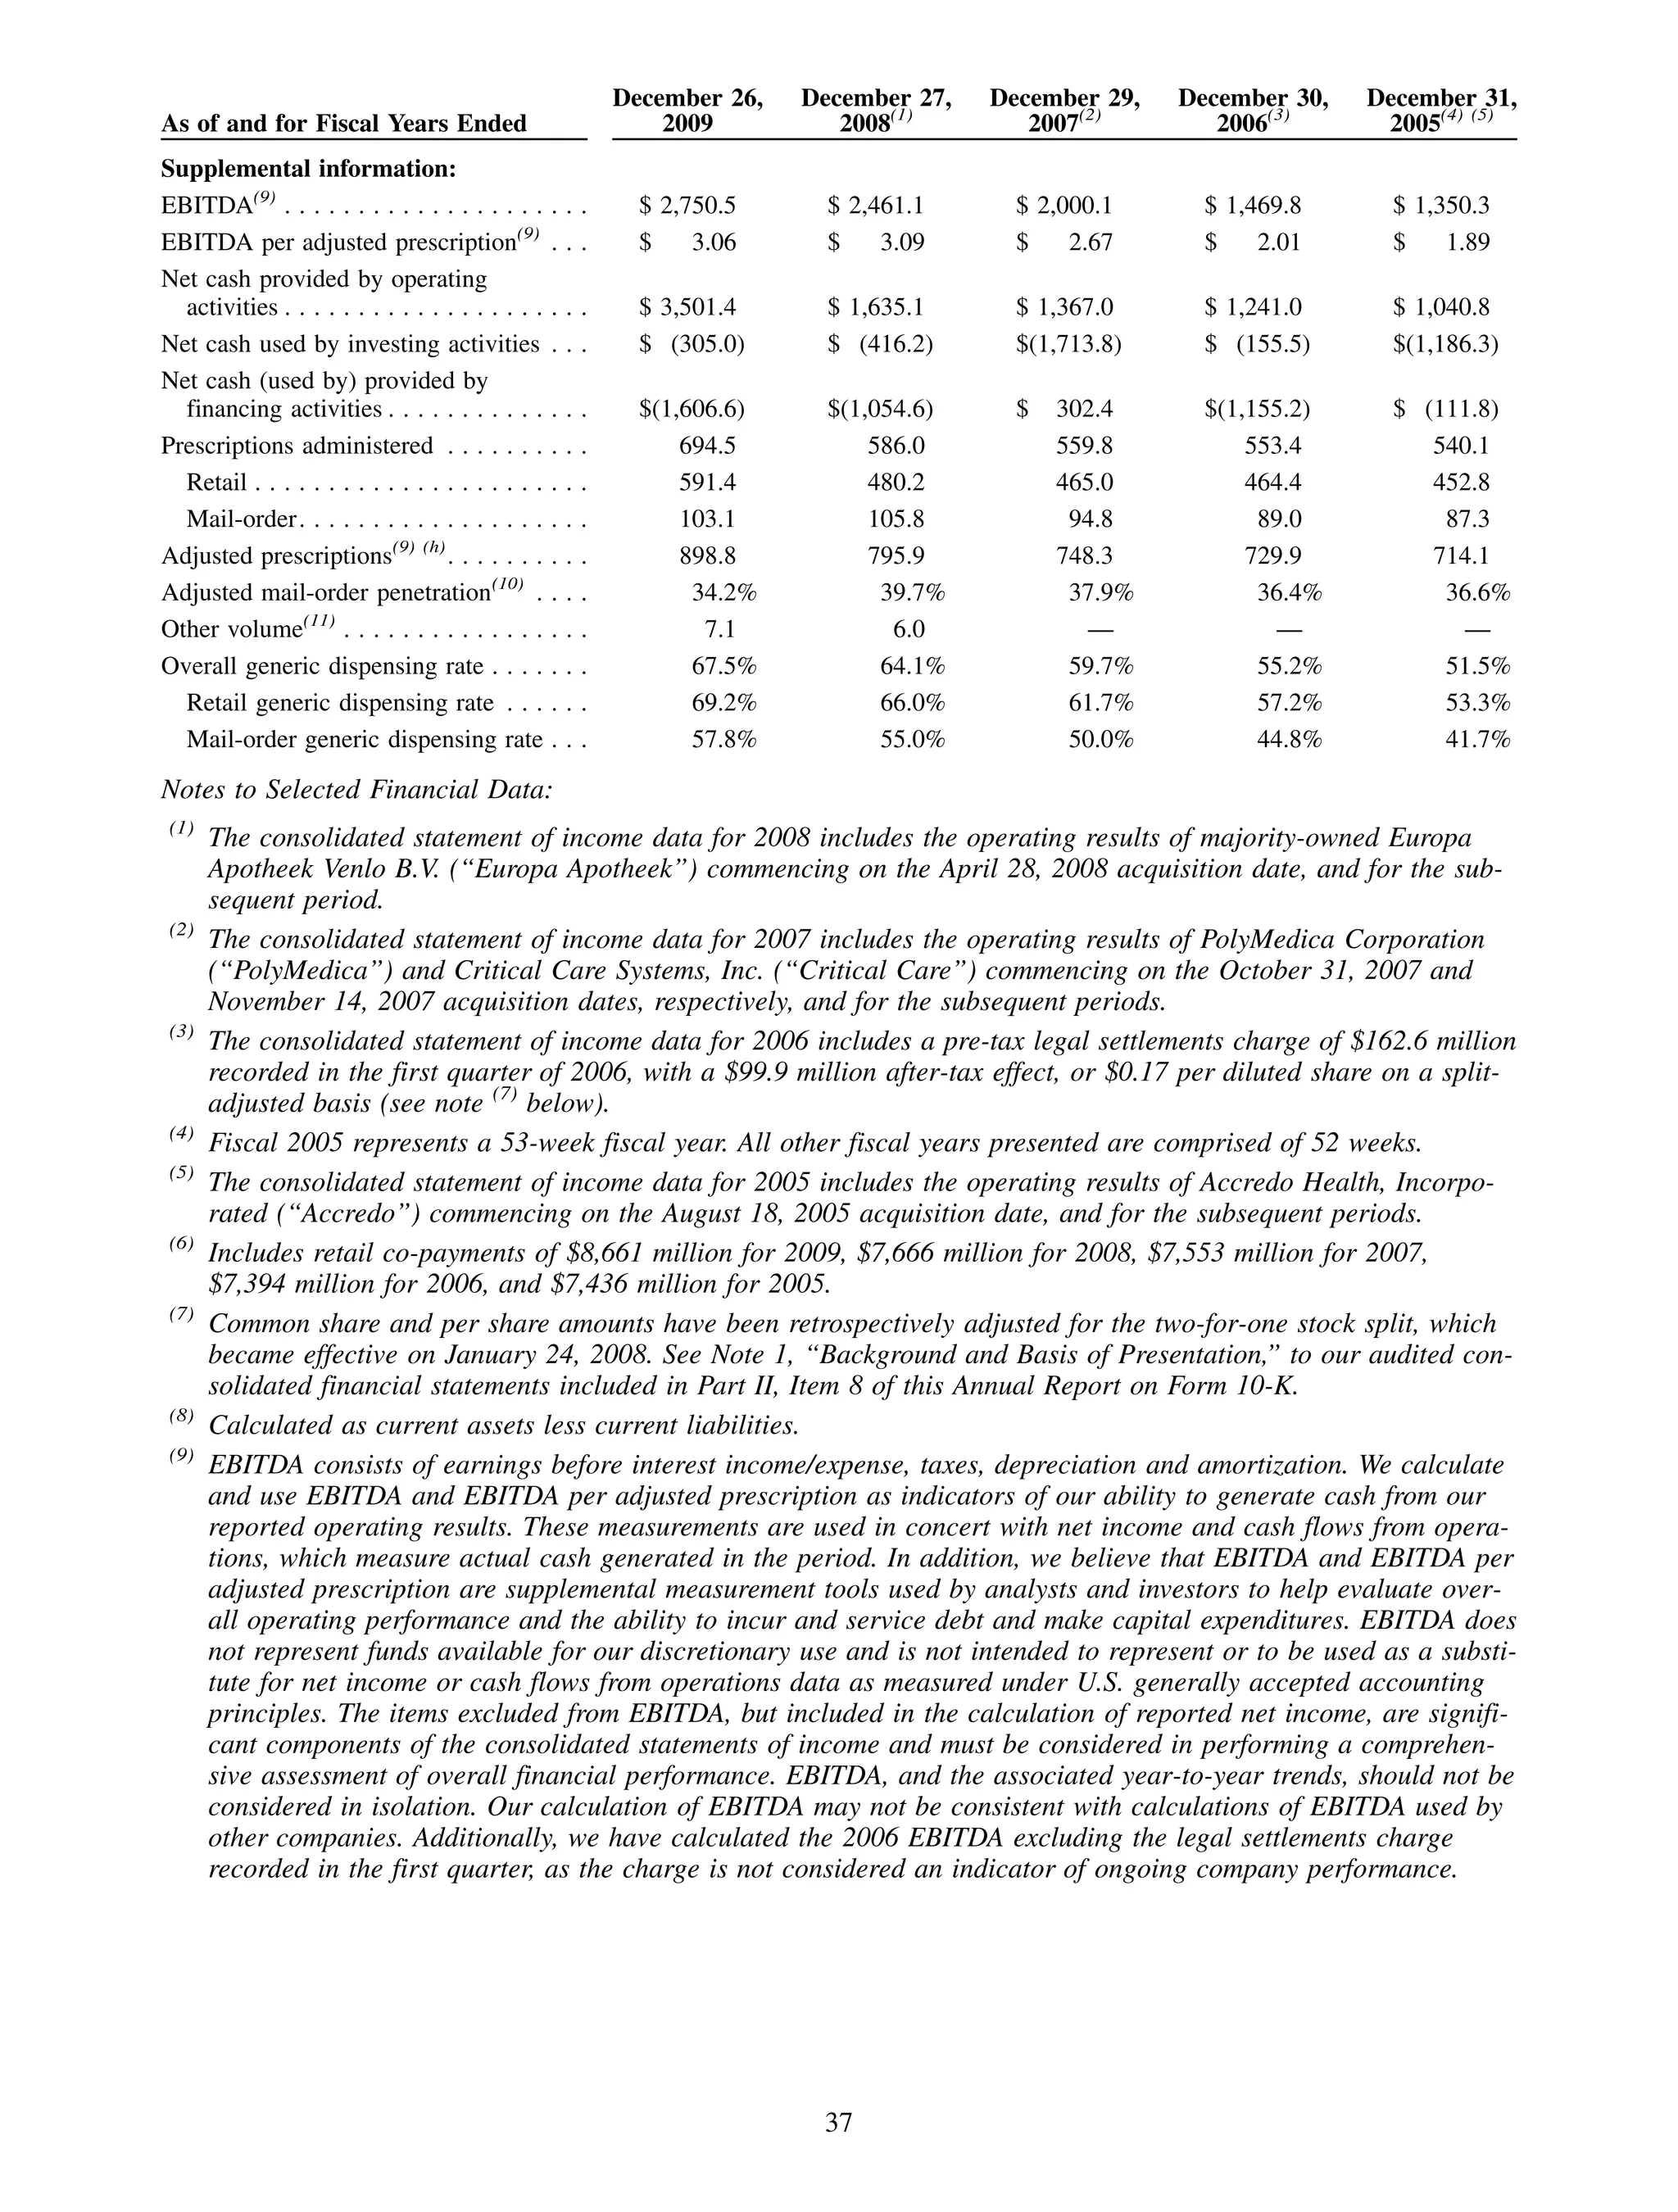
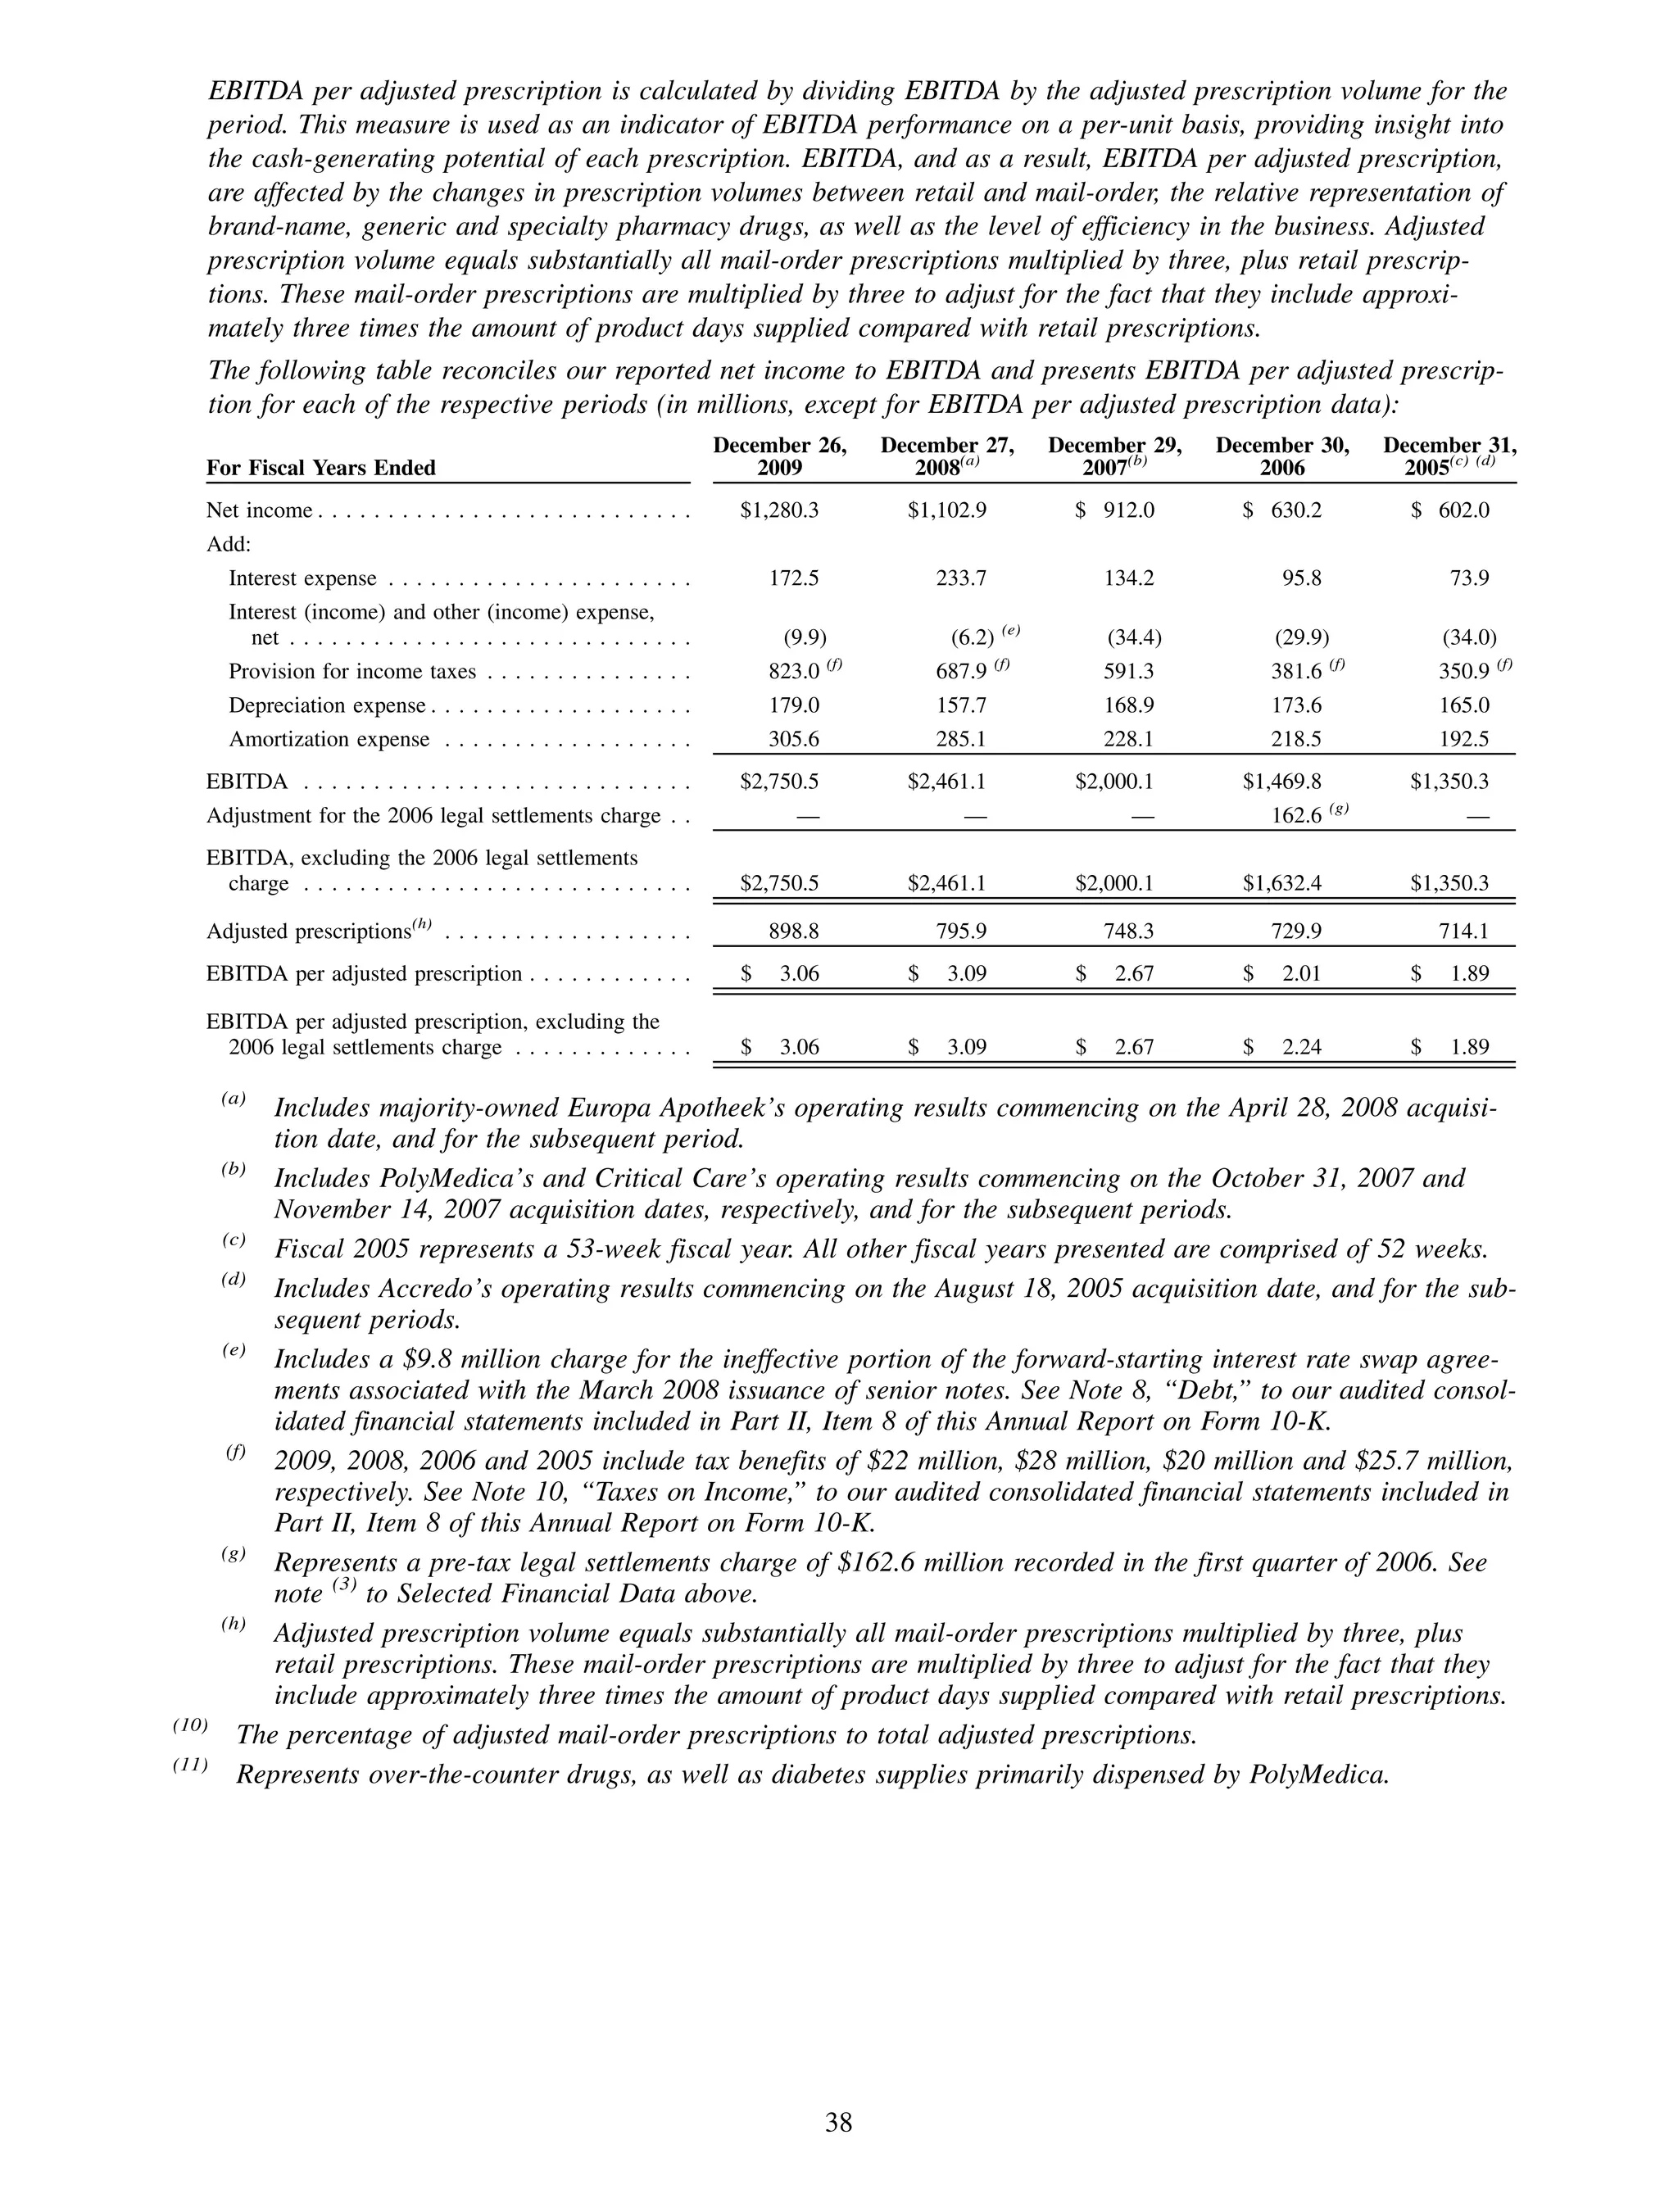
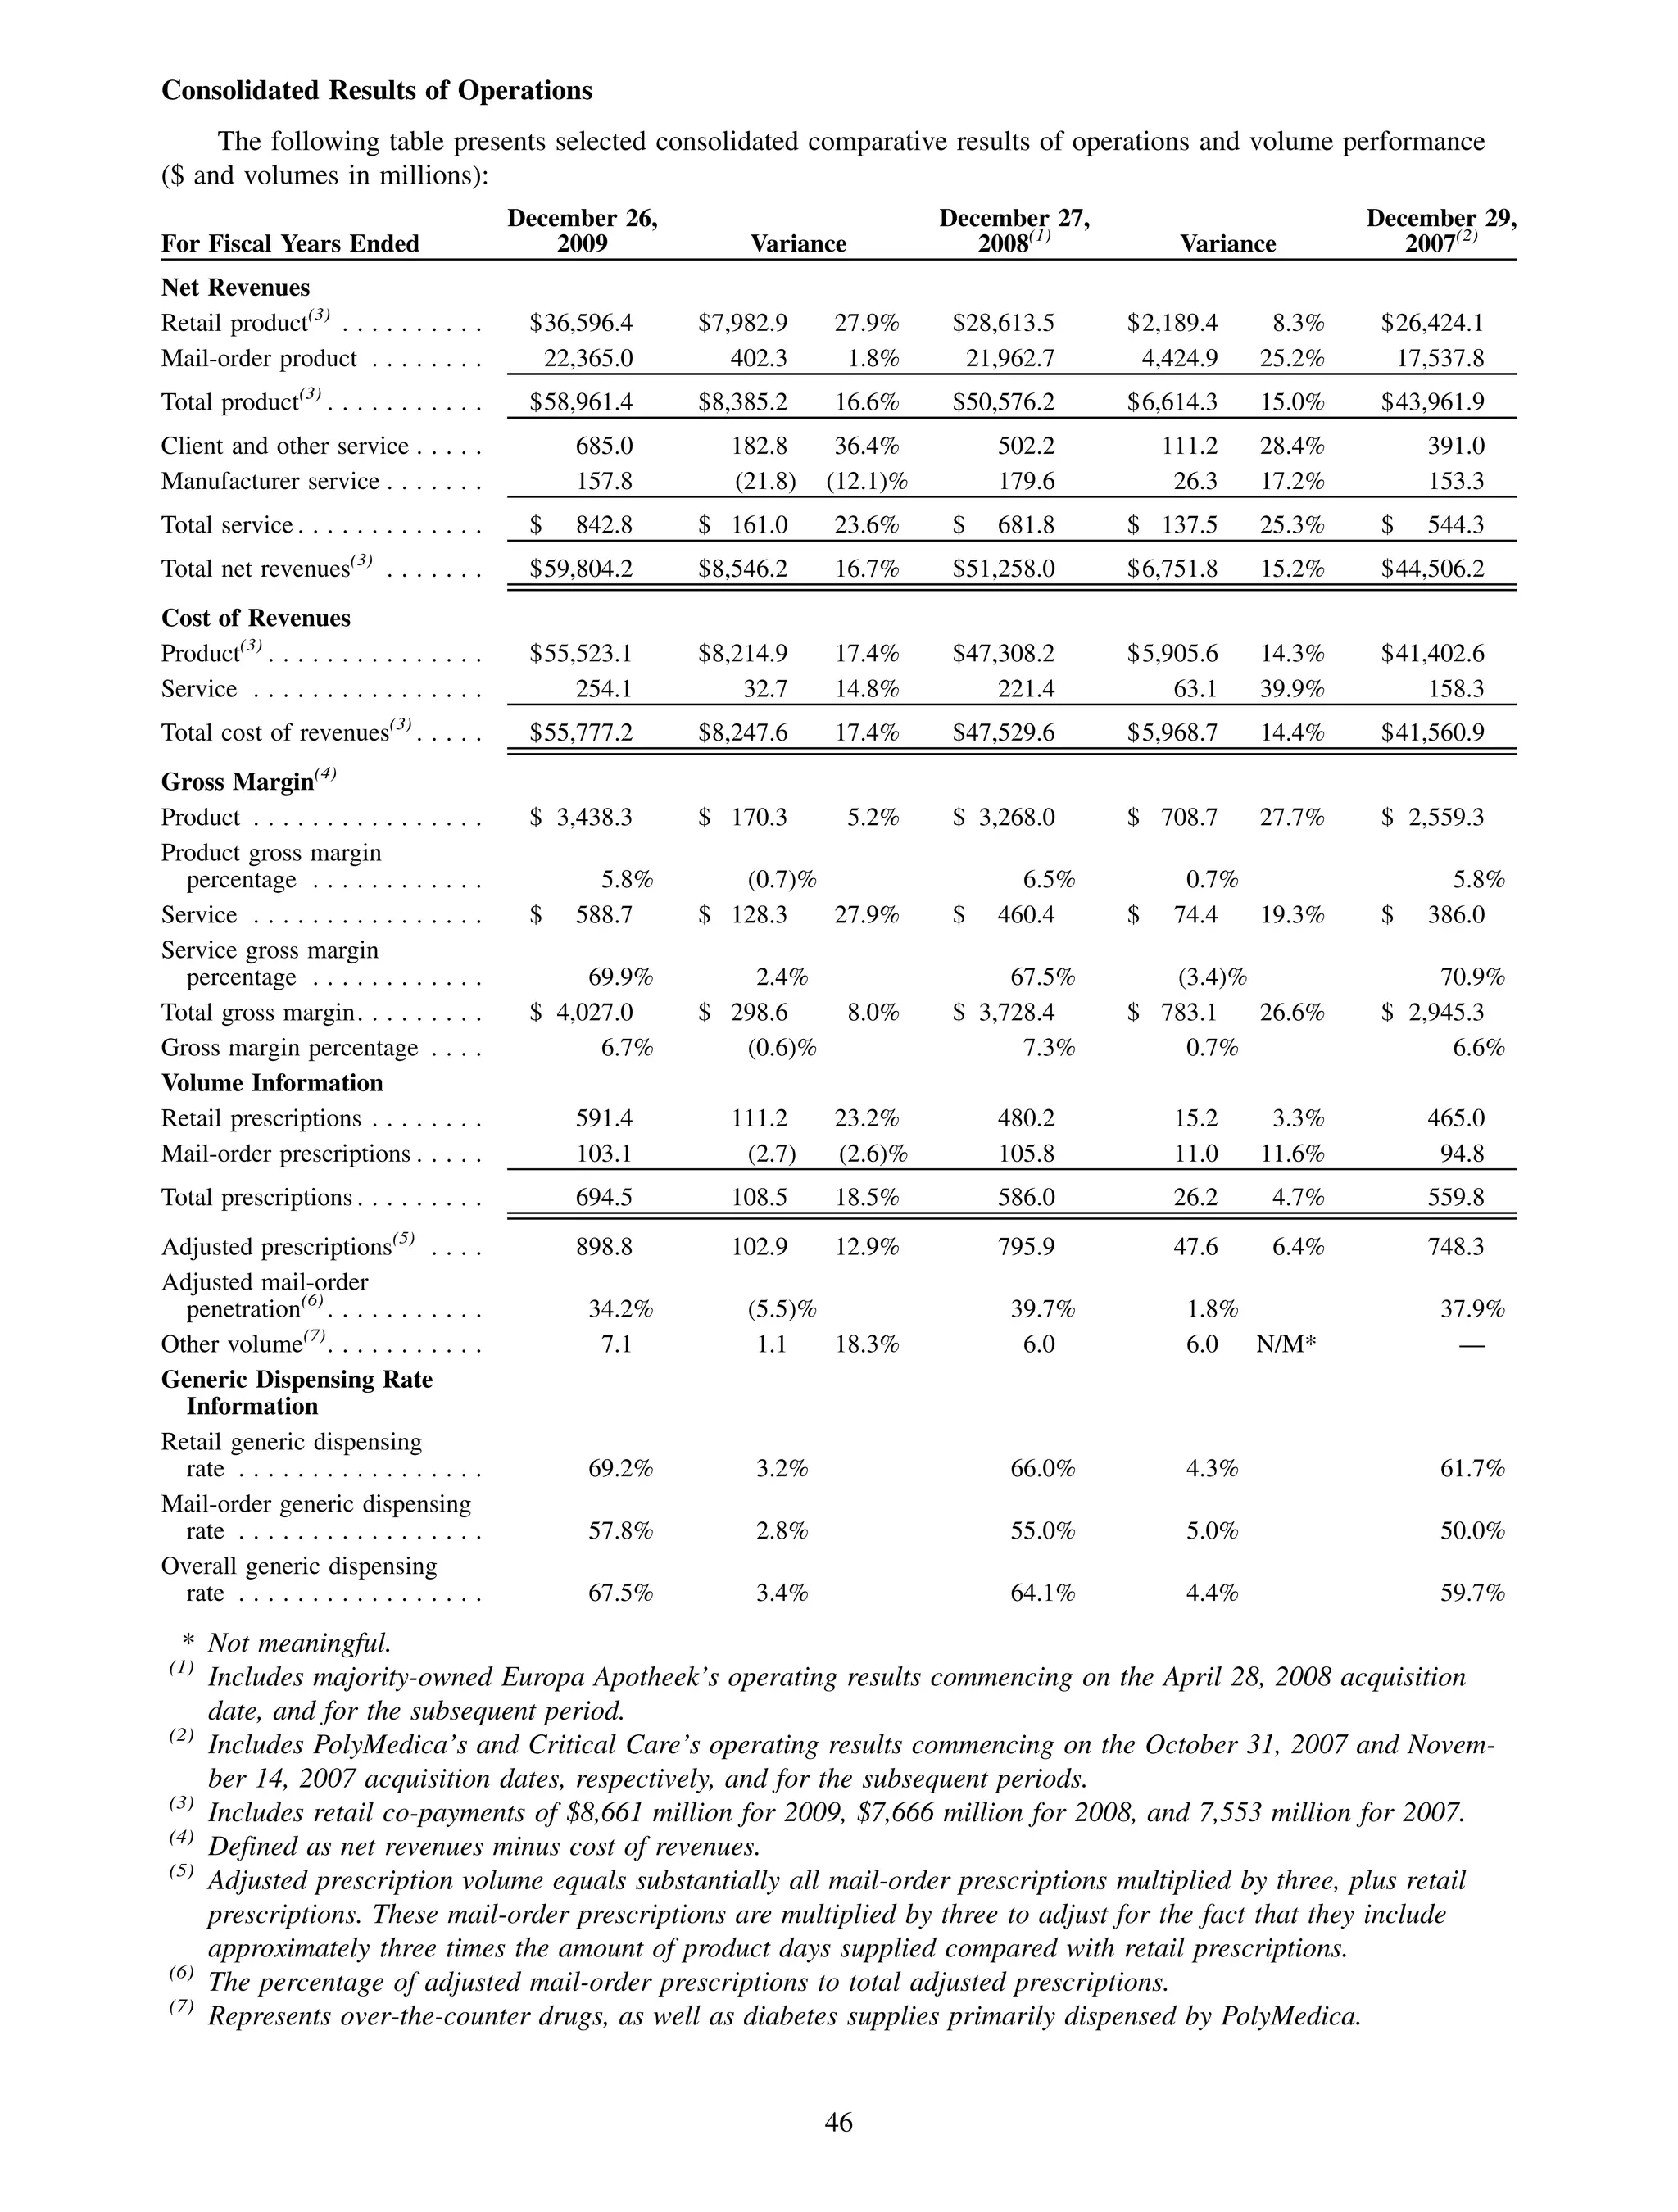
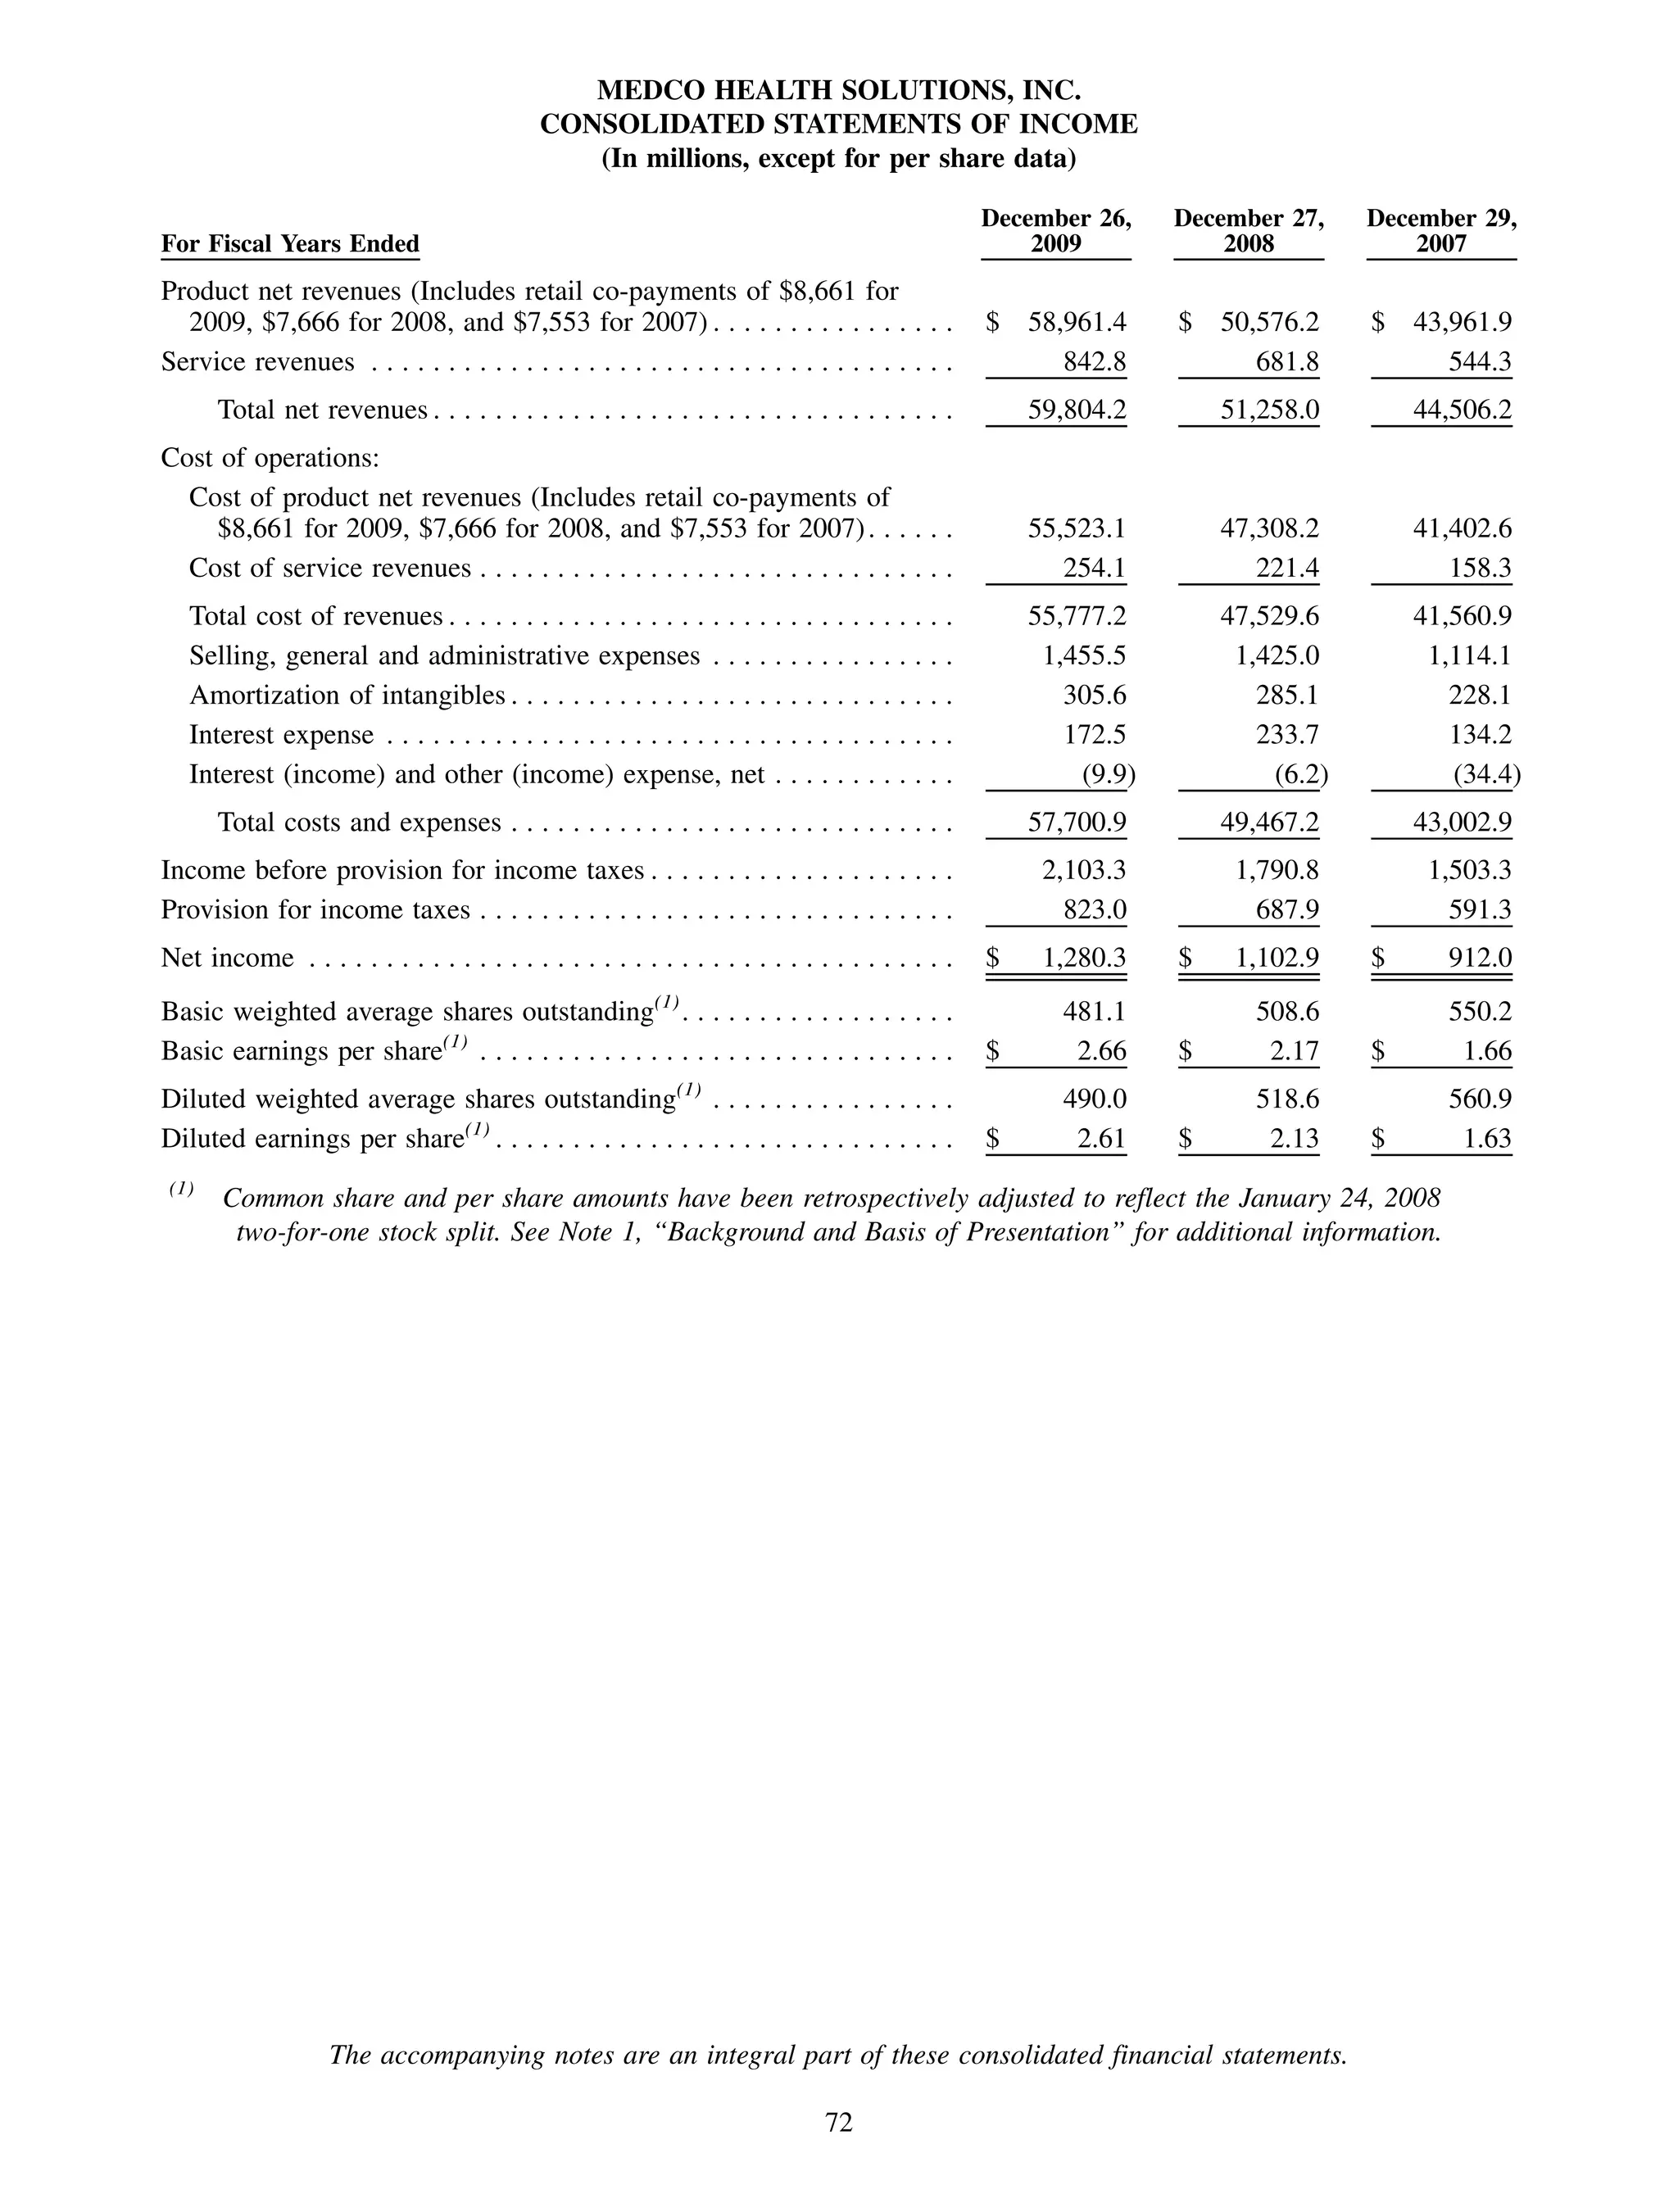
2009 ANNUAL REPORT
MEDCO HEALTH SOLUTIONS, INC.


                                                 TM


                       It’s what we do. It’s who we are. It’s in our DNA.
                                      .
DELIVERING
                                               SMARTER MEDICINE
   MANAGING                                      THROUGH THE
                                               MEDCO PHARMACY
                                                                       TM

SMARTER MEDICINE
  THROUGH THE
   MEDCO PBM


                                                                                SHARING
                                                                            SMARTER MEDICINE
                                                                              THROUGH THE
                         ADVANCING                                          MEDCO FOUNDATION
                                                                                                       TM


                      SMARTER MEDICINE
                        THROUGH THE
                   MEDCO RESEARCH INSTITUTE
                                          TM


                                                Cover: Rakhee Patel, R.Ph.
                                                Medco Cardiovascular Specialist Pharmacist
                                                Access to Medco’s prescription and evidence-based protocol information
                                                systems helps Rakhee drive better health outcomes by educating members
                                                about the importance of medication adherence.
WE’RE MAKING MEDICINE SMARTER


            At Medco,
       innovation, precision,
         and advocacy are
           in our DNA.

         We strive to make
      all of medicine smarter
           and, as a result,
      make healthcare better.
2 0 0 9 A N N UA L R E PO RT


                                                             David B. Snow, Jr.
                                                      Chairman & Chief Executive Officer


          DEAR SHAREHOLDERS, CLIENTS, MEMBERS, AND EMPLOYEES:

          Making medicine smarter is more than a theme for an               Record cash flows from operations of $3.5 billion,
          annual report. It’s our calling.                                  up 114.1 percent
                                                                            Record Specialty Pharmacy revenues of over
          It describes the value that nearly 23,000 Medco
                                                                            $9.5 billion, up 19.5 percent
          people are committed to delivering every day for the
                                                                            Record generic dispensing rate of 67.5 percent,
          benefit of our clients and members.                               up 3.4 percentage points
          It’s leveraging the power of advanced pharmacy to                 Record adjusted prescription volume of
          redefine the standards of clinical excellence as we               898.8 million, up 12.9 percent
          drive down overall healthcare costs.                           Beyond this exceptional performance in 2009, and
                                                                         despite the ongoing global economic uncertainty, our
          It’s also the reason why, since 2008, we’ve won more
                                                                         ability to deliver value-driven solutions to our clients
          than $21 billion in new business and exceeded
                                                                         and members gives us the confidence to continue to
          virtually every metric used to gauge our success.
                                                                         expect strong earnings growth into the future.
          We’ve also delivered value to our shareholders as
                                                                         We will remain vigilant around expense control and
          Medco stock reached a series of new all-time highs
                                                                         continue to re-architect our organization for greater
          throughout 2009—appreciating more than 436
                                                                         speed and agility, even as we add millions of lives to
          percent since we became an independent public
                                                                         our book of business.
          company a little more than 6 years ago.
                                                                         Our transformation into a clinically focused
          It’s my privilege to share the highlights of our
                                                                         pharmacy leader has made us a winner in the
          full-year 2009 performance:
                                                                         marketplace and a key partner with our clients,
              Record 2009 annualized new-named sales of
                                                                         helping them to drive total healthcare costs lower.
              over $10.0 billion
                                                                         Medco’s influence has extended beyond our
              Record net-new sales of over $8.0 billion
                                                                         industry. Last year Forbes named Medco to its 100
              Record net revenues of $59.8 billion, up 16.7 percent      “Most Trustworthy” list; and for the third consecutive
              Record GAAP diluted EPS of $2.61, up 22.5 percent          year, Fortune listed Medco as among the world’s
                                                                         “Most Admired” companies.
              Record EBITDA of over $2.75 billion, up 11.8 percent

2. |
M E D C O H E A LT H S O L U T I O N S , I N C .


NARROWING THE CLINICAL GAP                                             With real-time prescription drug and integrated
                                                                       medical databases, and guided by nationally
Medco’s focus is innovation. Our investments in                        accepted, evidence-based protocols, the
building a protocol-driven, evidence-based pharmacy                    Medco Pharmacy™closed more than 1.5 million
practice to address the needs of patients with chronic                 gaps in clinical care in 2009, representing a projected
and complex conditions—and our ability to document                     $700 million in total healthcare cost savings.
and publish our results—have revealed the clinical
                                                                       As a result of our technologically advanced
quality gap that extends the Medco advantage
                                                                       pharmacy environment and use of Six Sigma®
compared to other PBMs and traditional pharmacies.
                                                                       techniques, Medco measures virtually every aspect
When we trained more than one thousand Medco                           of pharmacy-related care and treatment, allowing
Specialist Pharmacists and organized them into                         for continuous improvement. This wired
Medco Therapeutic Resource Centers®, each focused                      environment creates efficiencies and visibility, which
on handling a specific condition, such as diabetes or                  are at the heart of driving meaningful healthcare
cardiovascular disease, we developed the clinical                      reform—delivering better health outcomes, while at
capacity to identify and correct medication-related                    the same time lowering costs.
issues for millions of higher-risk, higher-cost patients.

Six of our 15 Therapeutic Resource Centers
represent some of the largest patient practices
of their kind in the United States—with 5 million
patients under treatment for diabetes, more
than 10 million patients under care for
neurological and psychiatric conditions, and
11 million being treated for cardiovascular issues.


     CLOSING

     1.5M
     GAPS IN CARE
                                 $700M
                                 PROJECTED
                                 HEALTHCARE
                                 SAVINGS


                              Rahul Purohit, R.Ph.
                              Medco Cardiovascular Specialist Pharmacist


                                                                                                                                                         | 3.
2 0 0 9 A N N UA L R E PO RT


          SMARTER MEDICINE MAKES A                                   While an averted cardiovascular event could save a
          MEANINGFUL DIFFERENCE                                      client $20,000 or more in hospital costs, this clinical
                                                                     quality gap in care is not just about lowering costs—
          Our work as a clinical trailblazer is already changing
                                                                     for members, it could save a life.
          the way medicine is practiced and delivered in the
          United States.                                             Late last year, Medco and one of our clients launched
                                                                     what we believe will become the most far-reaching
          As just one example in a growing compendium, late in
                                                                     experimental partnership of its kind—uniting our
          2008 Medco research reported a correlation between
                                                                     advanced pharmacy with local community-based
          the use of certain heartburn medicines in tandem with
                                                                     pharmacies in a coordinated and wired initiative to
          the widely used anticlotting agent, Plavix® (clopidogrel
                                                                     close medication-related gaps in healthcare. This pilot
          bisulfate). This often-prescribed combination
                                                                     project is designed to determine the effectiveness of
          counteracts the protective effects of Plavix and is
                                                                     training community pharmacists who have access to
          associated with a greater than 50 percent higher risk of
                                                                     Medco data to identify issues and provide interventions
          heart attack, stroke, and other negative cardiovascular
                                                                     to help improve the health of patients with chronic
          events. Following this report and the work of other
                                                                     and complex conditions, and lowering their cost of
          investigators, the Food and Drug Administration (FDA)
                                                                     care. If successful, this program could redefine the
          revised the Plavix product information and
                                                                     retail pharmacy practice paradigm.
          subsequently issued a public health advisory warning
          consumers of the potentially dangerous interaction         To help accelerate the transfer of critical knowledge from
          between Plavix and certain heartburn medicines,            research discovery to mainstream medical practice,
          including some over-the-counter versions.                  we have formed the Medco Research Institute™.
                                                                     This new Medco subsidiary will coordinate, extend,
         PROOF TO           Based on these findings, Medco
                                                                     and amplify our internal genomics research
         PRACTICE IN        quickly placed safety warnings in
         12 MONTHS                                                   initiatives and further the growing number of
                            its system to alert pharmacists
                                                                     collaborations with institutions and organizations,
                            and physicians to the potential
         33%                danger. In 12 months, and to the
         REDUCTION IN benefit of our clients, this resulted
                                                                     such as the Mayo Clinic, LabCorp, Harvard University,
                                                                     Indiana University School of Medicine, and the FDA,
         A POTENTIALLY                                               among other leading research institutions, in
         DANGEROUS in a 33 percent reduction in the                  addition to forging new relationships as we create
         INTERACTION dispensing of these medicines, in
                                                                     catalysts for discovery and innovation.
         combination, for patients using the Medco Pharmacy.
         For the safety of all members, we are working to
         help retail pharmacies achieve the same high
         standards set by the Medco Pharmacy.


4. |
M E D C O H E A LT H S O L U T I O N S , I N C .


EXTENDING OUR REACH;                                       In the United Kingdom, we announced a joint
ACCELERATING OUR GROWTH                                    venture to offer quality in-home care to specialty
                                                           pharmacy patients served by the National Health
By improving generic and mail-order dispensing
                                                           Service (NHS), enabling greater independence and
rates for our current clients and members, we could
                                                           reducing cost pressures on the public health system.
maintain healthy growth even if we never added a
single new member. However, in addition to record          In Germany, we extended our market presence with
new business and earning a greater share of wallet         the acquisition of shop-apotheke.com, a leading
across our book of business, we are pursuing               website for healthcare and over-the-counter products.
opportunities that move far beyond the current             This adds channel depth to our existing prescription
boundaries of the historical PBM.                          drug and specialty subsidiary, Europa Apotheek Venlo.

In mid-2009, we launched the Medco Health Store™,          In Sweden, the first nationwide wired safety net
extending the drug utilization review safety protections   providing drug utilization review (DUR)—developed
that have been a mainstay for prescription medicines       through a Medco joint partnership with the
to cover the growing number of nonprescription             government of Sweden—was deployed to protect
medicines, vitamins, and dietary supplements.              patients from harmful drug interactions.

Offering more than 22,000 healthcare products,             We also asserted our pioneering leadership in
organized by therapeutic condition, the Medco              pharmacogenomics—the science of personalized
Health Store complements the prescription-based            medicine—enrolling more than 200 clients,
services we provide patients through our                   representing nearly 8 million lives, in our growing
Therapeutic Resource Centers. The store has quickly        portfolio of gene-based testing programs.
surpassed 1 million registered users. Our research
                                                           It’s estimated that nearly one in four Medco patients
demonstrates that Medco members find compelling
                                                           currently takes a drug with gene-based indications listed
value in the store’s combination of safety,
                                                           within the product labeling. However, a survey we
convenience, quality, and affordability.
                                                           conducted in partnership with the American Medical
Medco also furthered its international initiatives—        Association revealed that fewer than 25 percent of
leveraging our innovation, technologies, and               doctors have received education on pharmacogenomics,
solutions to transcend geographic, political, and          and only half of them feel informed about genetic
cultural healthcare conventions in addressing              testing. Our extensive series of research initiatives and
quality and cost issues abroad.                            growing slate of published findings are designed to
                                                           change that; as In Vivo recently noted, “Medco is steadily
                                                           becoming the go-to organization” for assessing the
                                                           impact of pharmacogenomic tests on improving
                                                           patient outcomes.


                                                                                                                                            | 5.
2 0 0 9 A N N UA L R E PO RT


          Our capabilities will be enhanced through our recent        SMARTER MEDICINE—THE MODEL FOR
          acquisition of DNA Direct, a leader in providing            REAL HEALTHCARE REFORM
          guidance and decision support to payors, physicians,
                                                                      Healthcare reform has many faces.
          and patients, on a range of complex issues related to
          genomic medicine. This will enable us to build a new        As the debate in Washington commanded headlines
          generation of solutions to deliver on the promise of        throughout 2009, Medco was actively engaged in
          what we’re calling “precision medicine.”                    the process, contributing expertise, sharing research,
                                                                      and advocating for solutions that improve the
          Our newly launched Genetics for Generics™ initiative will
                                                                      quality of care for patients, reduce costs for payors,
          help physicians determine whether individual patients
                                                                      and broaden access to all.
          require expensive branded medicines when they may be
          best served by proven generic therapies, which are also     We also established the Medco Foundation™, a
          less expensive. This is a critical consideration as new     nonprofit organization whose mission is to support
          branded drugs are soon expected to reach the market         activities aimed at educating and informing the
          as patents expire on some of the world’s most widely        general public about health, wellness, and medicine
          used medicines treating the same conditions.                safety issues; providing low-income, disadvantaged,
                                                                      and other distressed populations and communities
          Most recently, the Medco Research Institute and
                                                                      with access to medicine and information about their
          Mayo Clinic announced the results of the first
                                                                      care; and fostering and promoting opportunities for
          national prospective comparative effectiveness study
                                                                      volunteerism and civic engagement through our
          examining patient outcomes when incorporating
                                                                      corporate social-responsibility programs.
          genetic testing to the usual management of
          warfarin, the world’s most prescribed blood thinner.        But most importantly, through our focused approach to
          Hospitalization rates for heart patients taking warfarin    the needs of our clients and members, Medco is today
          dropped by approximately 30 percent when genetic            reforming healthcare by pursuing our four-point strategy:
          information was available to prescribers. This study           Managing smarter medicine through the
          validates that genetic testing to reveal a patient’s           Medco PBM
          unique sensitivity to warfarin can significantly improve      Delivering smarter medicine through the
          the drug’s safety and effectiveness.                          Medco Pharmacy
                                                                        Advancing smarter medicine through the
          Consistent with our clinical leadership, Medco has
                                                                        Medco Research Institute
          put in place the first pharmacogenomics-specific
                                                                        Sharing smarter medicine through the
                              drug utilization rules to provide
                                                                        Medco Foundation
                                  alerts that warn when a
                                     prescribed medication is         It’s not only what we do. It’s who we are. We are Medco.
                                     incompatible with a              And we are making medicine smarter for our clients
                                  patient’s genomic profile based     and members every day.
                                 on data stored in our HIPAA-
                                compliant secure database.                             Sincerely,

                               Gene-based prescribing is the
                             technology of the future. Medco is
                          speeding these innovations to
                    mainstream pharmacy practice today.                                David B. Snow, Jr.
                                                                                       Chairman & Chief Executive Officer
6. |
MEDCO HEALTH SOLUTIONS, INC.


                                                                                                                                                 FINANCIAL HIGHLIGHTS


(In millions, except for per share data)                                                              2009                         2008              % Increase/(Decrease)

       CONSOLIDATED STATEMENT OF INCOME HIGHLIGHTS
       Total net revenues                                                                        $ 59,804.2                     $ 51,258.0                    16.7 %
       Income before provision for income taxes                                                  $ 2,103.3                      $ 1,790.8                      17.5 %
       Net income                                                                                $ 1,280.3                      $ 1,102.9                     16.1 %
       Net income per diluted share(a)                                                           $     2.61                     $      2.13                   22.5 %

       CONSOLIDATED BALANCE SHEET HIGHLIGHTS
       Cash and cash equivalents                                                                 $     2,528.2                  $ 938.4                     169.4 %
       Working capital(e)                                                                        $      1,810.9                 $ 1,299.5                    39.4%
       Total assets                                                                              $     17,915.5                 $ 17,010.9                     5.3 %
       Total debt                                                                                $     4,015.9                  $ 4,602.9                    (12.8 %)

       NET CASH PROVIDED BY OPERATING ACTIVITIES                                                 $      3,501.4                 $ 1,635.1                    114.1 %

       PRESCRIPTION VOLUMES
       Adjusted prescription volume(d)                                                                   898.8                       795.9                    12.9 %
       Total prescriptions administered                                                                  694.5                       586.0                    18.5 %
         Retail                                                                                           591.4                      480.2                    23.2 %
         Mail order                                                                                       103.1                      105.8                    (2.6 %)


(a)   Per share amounts have been retrospectively adjusted for a two-for-one stock split, which was effected in the form of a 100% stock dividend and distributed on January 24, 2008,
      to shareholders of record at the close of business on January 10, 2008.
(b)   For a reconciliation of reported net income to EBITDA and a presentation of EBITDA per adjusted prescription, refer to page 58 of Management’s Discussion and Analysis
      included in our Annual Report on Form 10-K.
(c)   The consolidated statement of income data for 2006 includes a pre-tax legal settlements charge of $162.6 million recorded in the first quarter of 2006.
(d)   Adjusted prescription volume equals substantially all mail-order prescriptions multiplied by three, plus retail prescriptions. These mail-order prescriptions are multiplied by
      three to adjust for the fact that they include approximately three times the amount of product days supplied compared with retail prescriptions.
(e)   Calculated as current assets less current liabilities.
                                                                                                                                                                                         | 7.
“I’ve always been proud of the many ways
     in which Medco and its employees, in times of crisis,
have applied the values that are at the core of our organization,
along with our pharmacy expertise, to share smarter medicine
                   with those in great need.”
                                                    David B. Snow, Jr.


                      MEDCO RESPONDS TO THE
                     NATURAL DISASTER IN HAITI
          Within days after devastating earthquakes destroyed much
          of Haiti’s capital city, critical medicines valued at more than
          $5 million and donated through Medco pharmacies were
          en route to emergency responders. Within weeks, employee
          contributions, supplemented by a Medco corporate match
          and totaling more than $400,000, were heading to agencies
          that were speeding relief to the island. Meantime, Medco
          pharmacists, doctors, and nurses came forward to volunteer
          for assignments serving aboard the USNS Comfort,
          a naval vessel that became the island’s most advanced
          critical-care facility for earthquake victims.
UNITED STATES
                             SECURITIES AND EXCHANGE COMMISSION
                                                      Washington, D.C. 20549

                                                          FORM 10-K
                            ANNUAL REPORT PURSUANT TO SECTION 13 OR 15(d)
                               OF THE SECURITIES EXCHANGE ACT OF 1934
                                          For the fiscal year ended December 26, 2009
                                                   Commission File Number: 1-31312

               MEDCO HEALTH SOLUTIONS, INC.    (Exact name of Registrant as specified in its charter)
                            Delaware                                                                    22-3461740
           (State or other jurisdiction of incorporation)                                    (I.R.S. Employer Identification No.)
          100 Parsons Pond Drive, Franklin Lakes, NJ                                                    07417-2603
              (Address of principal executive offices)                                                   (Zip Code)
                                 Registrant’s telephone number, including area code: 201-269-3400
                                     Securities registered pursuant to Section 12(b) of the Act:
                         Title of Each Class                                        Name of Each Exchange on Which Registered
                  Common Stock, par value $0.01                                                  New York Stock   Exchange
                   7.25% Senior Notes Due 2013                                                   New York Stock   Exchange
                  6.125% Senior Notes Due 2013                                                   New York Stock   Exchange
                  7.125% Senior Notes Due 2018                                                   New York Stock   Exchange
                                Securities registered pursuant to Section 12(g) of              the Act: None
     Indicate by check mark if the Registrant is a well-known seasoned issuer, as defined in Rule 405 of the Securities
Act. Yes ¥ No n
      Indicate by check mark if the Registrant is not required to file reports pursuant to Section 13 or Section 15(d) of the Exchange
Act. Yes n No ¥
      Indicate by check mark whether the Registrant: (1) has filed all reports required to be filed by Section 13 or 15(d) of the
Securities Exchange Act of 1934 during the preceding 12 months (or for such shorter period that the Registrant was required to
file such reports), and (2) has been subject to such filing requirements for the past 90 days. Yes ¥ No n
      Indicate by check mark whether the Registrant has submitted electronically and posted on its corporate Web site, if any, every
Interactive Data File required to be submitted and posted pursuant to Rule 405 of Regulation S-T (§232.405 of this chapter) during
the preceding 12 months (or for such shorter period that the Registrant was required to submit and post such files). Yes ¥ No n
      Indicate by check mark if disclosure of delinquent filers pursuant to Item 405 of Regulation S-K is not contained herein and
will not be contained, to the best of Registrant’s knowledge, in definitive proxy or information statements incorporated by reference
in Part III of this Form 10-K or any amendment to this Form 10-K. n
      Indicate by check mark whether the Registrant is a large accelerated filer, an accelerated filer, a non-accelerated filer, or a
smaller reporting company. See the definitions of “large accelerated filer,” “accelerated filer” and “smaller reporting company” in
Rule 12b-2 of the Exchange Act.
Large accelerated filer ¥           Accelerated filer n                   Non-Accelerated filer n                 Smaller reporting company n
     Indicate by check mark whether the Registrant is a shell company (as defined in Rule 12b-2 of the Exchange
Act). Yes n No ¥
    The aggregate market value of the Registrant’s voting stock held by non-affiliates as of June 27, 2009 was $21,559,406,368.
The Registrant has no non-voting common equity.
    As of February 17, 2010, the Registrant had 464,060,676 shares of common stock outstanding.
                                      DOCUMENTS INCORPORATED BY REFERENCE
     Portions of Medco Health Solutions, Inc.’s Proxy Statement for its 2010 Annual Meeting of Shareholders are incorporated by
reference in this Annual Report on Form 10-K in response to Part III (Items 10 through 14).
MEDCO HEALTH SOLUTIONS, INC.
                                                       ANNUAL REPORT ON FORM 10-K
                                                                 TABLE OF CONTENTS

Form 10-K Item Number:                                                                                                                                       Page No.

PART I

Item   1.       Business. . . . . . . . . . . . . . . . . . . . . . . . . . . . . . . . . . . . . . . . . . . . . . . . . . . . . . . . . . . . . . .    .         1
Item   1A.      Risk Factors . . . . . . . . . . . . . . . . . . . . . . . . . . . . . . . . . . . . . . . . . . . . . . . . . . . . . . . . . . . .     .        21
Item   1B.      Unresolved Staff Comments . . . . . . . . . . . . . . . . . . . . . . . . . . . . . . . . . . . . . . . . . . . . . . . .                .        29
Item   2.       Properties . . . . . . . . . . . . . . . . . . . . . . . . . . . . . . . . . . . . . . . . . . . . . . . . . . . . . . . . . . . . . .   .        29
Item   3.       Legal Proceedings . . . . . . . . . . . . . . . . . . . . . . . . . . . . . . . . . . . . . . . . . . . . . . . . . . . . . . .          .        29
Item   4.       Submission of Matters to a Vote of Security Holders . . . . . . . . . . . . . . . . . . . . . . . . . . . . . .                          .        29
                Executive Officers of the Company . . . . . . . . . . . . . . . . . . . . . . . . . . . . . . . . . . . . . . . . . . .                  .        29

PART II

Item 5.  Market for Registrant’s Common Equity, Related Shareholder Matters and Issuer Purchases
         of Equity Securities . . . . . . . . . . . . . . . . . . . . . . . . . . . . . . . . . . . . . . . . . . . . . . . . . . . . . . .                       33
Item 6.  Selected Financial Data . . . . . . . . . . . . . . . . . . . . . . . . . . . . . . . . . . . . . . . . . . . . . . . . . . . .                          36
Item 7.  Management’s Discussion and Analysis of Financial Condition and Results of Operations . . .                                                              39
Item 7A. Quantitative and Qualitative Disclosures About Market Risk . . . . . . . . . . . . . . . . . . . . . . . . .                                             69
Item 8.  Financial Statements and Supplementary Data . . . . . . . . . . . . . . . . . . . . . . . . . . . . . . . . . . . .                                      69
Item 9.  Changes in and Disagreements with Accountants on Accounting and Financial Disclosure . . .                                                              107
Item 9A. Controls and Procedures . . . . . . . . . . . . . . . . . . . . . . . . . . . . . . . . . . . . . . . . . . . . . . . . . . . .                         107
Item 9B. Other Information. . . . . . . . . . . . . . . . . . . . . . . . . . . . . . . . . . . . . . . . . . . . . . . . . . . . . . . . .                      107

PART III

Item 10.        Directors, Executive Officers and Corporate Governance . . . . . . . . . . . . . . . . . . . . . . . . . . . .                                   108
Item 11.        Executive Compensation . . . . . . . . . . . . . . . . . . . . . . . . . . . . . . . . . . . . . . . . . . . . . . . . . . . .                   108
Item 12.        Security Ownership of Certain Beneficial Owners and Management and Related Shareholder
                Matters . . . . . . . . . . . . . . . . . . . . . . . . . . . . . . . . . . . . . . . . . . . . . . . . . . . . . . . . . . . . . . . .          108
Item 13.        Certain Relationships and Related Transactions, and Director Independence . . . . . . . . . . . . . .                                            110
Item 14.        Principal Accounting Fees and Services . . . . . . . . . . . . . . . . . . . . . . . . . . . . . . . . . . . . . . . .                           110

PART IV

Item 15.        Exhibits, Financial Statement Schedules . . . . . . . . . . . . . . . . . . . . . . . . . . . . . . . . . . . . . . . .                          111

Signatures . . . . . . . . . . . . . . . . . . . . . . . . . . . . . . . . . . . . . . . . . . . . . . . . . . . . . . . . . . . . . . . . . . . . . . .         116
PART I

Item 1.   Business.
Overview
     We are a leading healthcare company that is pioneering the world’s most advanced pharmacy» and our clinical
research and innovations are part of Medco making medicine smarterTM for approximately 65 million members.
Medco provides clinically-driven pharmacy services designed to improve the quality of care and lower total
healthcare costs for private and public employers, health plans, labor unions and government agencies of all sizes,
and for individuals served by Medicare Part D Prescription Drug Plans. Our unique Medco Therapeutic Resource
Centers», which conduct therapy management programs using Medco specialist pharmacists who have expertise in
the medications used to treat certain chronic conditions, and Accredo Health Group, Medco’s Specialty Pharmacy,
represent innovative models for the care of patients with chronic and complex conditions.
      Our business model requires collaboration with retail pharmacies, physicians, the Centers for Medicare &
Medicaid Services (“CMS”) for Medicare, pharmaceutical manufacturers and, particularly in Specialty Pharmacy,
collaboration with state Medicaid agencies, and other third-party payors such as health insurers. Our programs and
services help control the cost and enhance the quality of prescription drug benefits. We accomplish this by providing
pharmacy benefit management (“PBM”) services through our national networks of retail pharmacies and our own
mail-order pharmacies, as well as through Accredo Health Group, which we believe is the nation’s largest specialty
pharmacy based on revenues. Medco’s Therapeutic Resource Center focused on diabetes was augmented with the
2007 acquisition of PolyMedica Corporation (“PolyMedica”), through which we believe we became the largest
diabetes pharmacy care practice based on covered patients. In 2008, we also extended our capabilities abroad when
we acquired a majority interest in Europa Apotheek Venlo B.V. (“Europa Apotheek”), a privately held company
based in the Netherlands that primarily provides mail-order pharmacy services in Germany. See Note 3, “Acquisi-
tions of Businesses,” to our audited consolidated financial statements included in Part II, Item 8 of this Annual
Report on Form 10-K for more information. In 2009, Medco advanced its European healthcare initiatives through a
joint venture with United Drug plc, a pan-European healthcare leader, to provide home-based specialty pharmacy
care services in the United Kingdom for patients covered by the country’s National Health Service. Additionally, our
commitment to advancing the science of personalized medicine is further demonstrated by our January 2010
acquisition of DNA Direct, Inc., a leader in providing guidance and decision support to payors, physicians and
patients, on a range of complex issues related to genomic medicine.
     Our clients are generally entities that provide prescription drug benefits to their underlying membership, such
as members of their benefit plans or their employees. We operate in a competitive environment as clients and other
payors seek to control the growth in the cost of providing prescription drug benefits and leverage prescription drug
therapy to lower overall medical costs. Our business model is designed to reduce the level of drug cost increase,
also known as drug trend, but also to close gaps in pharmacy care to improve patient health and reduce total medical
spending levels. We do this primarily through programs that: maximize the substitution rate of expensive brand-
name drugs for lower-cost clinically equivalent generic drugs; drive competitive discounts from brand-name and
generic drug pharmaceutical manufacturers, including rebates from brand-name pharmaceutical manufacturers;
secure discounts from retail pharmacies; and apply our sophisticated service innovations and efficiently administer
prescription dispensing through our mail-order pharmacies.
     Traditional prescription drug programs include the dispensing of pills primarily in capsule or tablet form. These
medicines are produced by brand-name and generic pharmaceutical manufacturers, and are not as complicated to
dispense or administer as specialty products. Specialty pharmacy drugs are generally manufactured by biopharma-
ceutical or biotechnology companies and tend to be more expensive than traditional medicines and can cost as much
as several hundred thousand dollars per patient per year. These specialty drugs are often infusible or injectable and
require special handling, temperature control and ancillary equipment, as well as a higher level of individualized
patient care as compared to traditional medicines. Disease states treated by specialty drugs, including for example
hemophilia and autoimmune disorders, are often the most complex to manage.


                                                          1
The advanced technologies we have developed are instrumental to our ability to drive growth, improve service
and reduce costs. Our technology platform is designed to seamlessly integrate prescription management at both mail
order and retail with our client and member services. The cornerstone of our mail-order pharmacy technology is our
single networked information technology platform, which connects prescription ordering functions at our prescription
order processing pharmacies with our state-of-the-art automated dispensing pharmacies in Willingboro, New Jersey
and Las Vegas, Nevada, and our soon to be connected third automated dispensing pharmacy in Whitestown, Indiana,
which is expected to be operational in 2010. At our call center pharmacies and our work-at-home locations, our
experienced customer service representatives and consulting pharmacists use advanced technology to speed service
and provide members with specialized prescription and health information. Our Internet and integrated voice-
response phone technologies allow members to easily and quickly manage their prescription drug benefits. These
technologies also allow members to enroll in mail-order pharmacy service, submit a refill or renewal mail-order
prescription for processing, track the status of a mail-order prescription, price a medication and locate in-network
retail pharmacies in their area, along with other features.
      Our proprietary Internet-based solutions improve client and member service by facilitating prescription ordering
and by providing important healthcare information. We support distinct websites for clients, members, physicians
and pharmacists that provide critical benefit information and interactive tools aimed at helping members to take
their medications as prescribed, to use lower cost drugs and to simplify benefit administration.
     Advanced imaging technology enables service representatives to access an online image of a member’s
prescription to address a member’s needs more efficiently. Our data center links our mail-order pharmacy operations,
including our call center pharmacies and work-at-home sites, our websites, and the retail pharmacies in our
networks. The data center enables us to efficiently receive, process and administer claims, and dispense prescription
drugs with speed and accuracy in a secure environment. It also allows us to easily detect potential adverse drug
events and alert the patients and prescribing physicians of potentially harmful drug interactions. We also have
reliability, change management and implementation programs that help drive excellence in execution across our
operations, reducing our time to market with new capabilities and increasing our ability to implement timely, error-
free updates and deliver client-oriented solutions.
     Our innovative and flexible programs and services have enabled us to deliver effective drug trend management
for our clients and offer a portfolio of initiatives designed to improve the quality of care for members. Our services
focus on:
    • Offering the cost-saving and clinical advantages of mail order to our clients. Our clients realize lower
      overall drug costs as a result of operating efficiencies derived from our high degree of automation, the value
      from our scale in purchasing drugs at competitive discounts, and our ability to offer up to a 90-day supply
      of medicine at mail compared to a 30-day supply for most retail programs. Members benefit from the
      convenience of mail order, the extended supply, and generally lower co-payments.
    • Actively identifying opportunities to increase the use of lower-cost generic drugs as alternatives to brand-
      name medicines.
    • Offering a broad base of specialty medicines at competitive prices, and with a comprehensive service model
      designed to ensure patient safety, product integrity, and proper drug administration.
    • Enhancing formulary compliance through physician, client and member communications and education
      programs, including therapeutic brand-to-“preferred-brand” interchange programs. The use of multi-tiered
      co-payment and other cost-sharing payment structures, and the increased use of mail order further enhance
      formulary compliance. In addition, our Internet-based tool called My Rx Choices» provides members with a
      simplified and personalized menu of medication choices, including generics and preferred brand-name
      medications, based upon their personal drug benefit coverage. Higher levels of formulary compliance,
      combined with our purchasing scale, allow us to generate higher rebates on a per-prescription basis from
      brand-name pharmaceutical manufacturers. Most of the value of these rebates is currently shared with our
      clients, which helps us manage their drug trend.


                                                           2
• Providing high quality clinical care to members with chronic and complex conditions through access to
      Medco specialist pharmacists, housed in Medco Therapeutic Resource Centers» who have expertise in the
      medications used to treat certain chronic conditions. Our advanced clinical services benefit our members
      from an overall healthcare management perspective, and also assist them in making educated decisions
      regarding their prescription healthcare and associated costs.
    • Providing customized plan design. We offer ongoing consulting services and model clinical and financial
      outcomes for clients based on a broad range of plan design and formulary choices. Our advanced
      information technologies allow our professionals to design with clients the plan structure that best meets the
      clients’ benefit cost objectives while providing an optimized benefit to members of the clients’ plans. These
      include EXPERxT Advisor», an automated tool that provides real-time plan design modeling capability for
      our clients, as well as RationalMed», through which medical data is integrated to support better overall
      health outcomes for members. Recognizing the diverse plan design and administrative needs of different
      payors, our account teams are organized by industry-specific customer groups designed to ensure we provide
      customized solutions that satisfy the distinctive needs of our clients and their respective membership.
    • Providing a flexible array of Medicare Part D Prescription Drug Program (“Medicare Part D”) products to
      our clients and to individual Medicare-eligible consumers nationwide that: support their unique Prescription
      Drug Program (“PDP”) and facilitate benefits under a federal subsidy of traditional retiree programs, or
      through Medco’s own PDP offerings.
    • Effectively managing drug utilization, a key factor in reducing drug trend, through a wide range of trend
      management tools, including drug utilization review programs and rules governing the conditions under
      which drugs are covered, according to the requirements established by our clients. We also offer clinically
      based programs that identify waste related to particular categories of questionable drug claims representing
      unnecessary prescription use and potential abuse.
     In 2009, we administered 695 million prescriptions; recorded net revenues of $59.8 billion and net income of
$1.3 billion; and reported earnings before interest income/expense, taxes, depreciation and amortization, or EBITDA,
of nearly $2.8 billion. See Part II, Item 6, “Selected Financial Data,” for a definition and calculation of EBITDA
and EBITDA per adjusted prescription. Our net income is driven by our ability to generate favorable discounts on
generic prescription drugs dispensed from our mail-order pharmacies; earn discounts and rebates on brand-name
drugs; negotiate competitive client pricing, including rebate sharing terms, administrative fees and price discounts,
as well as negotiate favorable retail pharmacy reimbursement rates; provide competitively priced specialty pharmacy
products and services; and deliver innovative services in a cost-efficient manner.
     Business segment information and geographic financial information is set forth in Part II, Items 7, 7A and 8
(Note 13, “Segment and Geographic Data” to our audited consolidated financial statements included in Part II, Item 8
of this Annual Report on Form 10-K) of this Annual Report on Form 10-K.
     When we use “Medco,” “we,” “us” and “our,” we mean Medco Health Solutions, Inc., a Delaware corporation,
and its consolidated subsidiaries. When we use the term “mail order,” we mean inventory dispensed through
Medco’s mail-order pharmacy operations.


                                                         3
Special Note About Forward-Looking Statements
      We have made forward-looking statements in this Annual Report on Form 10-K, including in the sections
entitled “Business,” “Risk Factors,” “Legal Proceedings,” “Management’s Discussion and Analysis of Financial
Condition and Results of Operations,” and “Quantitative and Qualitative Disclosures about Market Risk,” that are
based on our management’s beliefs and assumptions and on information currently available to our management.
Forward-looking statements are not historical facts, but rather are based on current expectations, estimates,
assumptions and projections about the business and future financial results of the PBM and specialty pharmacy
industries, and other legal, regulatory and economic developments. Forward-looking statements include, among
others, information concerning our possible or assumed future results of operations, business strategies, financing
plans, competitive position, potential growth opportunities, potential operating performance improvements, the
effects of competition, and the effects of future legislation or regulations. We use words such as “anticipates,”
“believes,” “plans,” “expects,” “projects,” “future,” “intends,” “may,” “will,” “should,” “could,” “estimates,” “pre-
dicts,” “potential,” “continue” and similar expressions to identify these forward-looking statements.
      Forward-looking statements involve risks, uncertainties, and assumptions. Actual results may differ materially
from those expressed in these forward-looking statements. You should not put undue reliance on any forward-
looking statements. We do not have any intention or obligation to update forward-looking statements after we file
this report except as required by law.
     The risk factors discussed in “Risk Factors” and other risks identified in the Annual Report on Form 10-K
could cause our actual results to differ materially from those expressed in forward-looking statements. There may be
other risks and uncertainties that we are unable to predict at this time or that we currently do not expect to have a
material adverse effect on our business.

Industry Overview
     PBMs emerged in the 1980s, primarily to provide cost-effective drug distribution and claims processing for the
healthcare industry. The PBM industry further evolved in response to the significant escalation of healthcare costs in
the 1990s, as benefit plan sponsors sought to more aggressively contain costs. PBMs developed strategies to
effectively influence both supply and demand. On the supply side, PBMs leverage their buying power to negotiate
purchase discounts and rebates from manufacturers, and discounts from distributors and retail pharmacies. On the
demand side, PBMs educate clients, members and physicians on cost-effective prescription medications and apply
various techniques to encourage members to make cost-effective choices, such as the use of less expensive generic
drugs and the more efficient mail-order channel. Generic substitution for drugs on which patents have expired is a
significant and growing factor in reducing costs.

Business Strategy
     Medco’s strategy for continued success and profitability includes the following key growth drivers and other
business initiatives:

  Key Growth Drivers
     • Generics: Optimizing the value of generics in light of significant brand-name patent expirations expected
       over the next several years, and continued development of programs designed to further reduce the cost of
       prescription healthcare.
     • Mail Order: Maximizing the mail-order prescription opportunity for chronic and complex disease through
       enhanced communication and plan design.


                                                           4
• Specialty Pharmacy: Expanding our specialty pharmacy model by providing new and creative services that
    reduce drug cost, simplify the administrative process and further enhance patient safety and convenience,
    including home-based and ambulatory specialty infusion services.
  • New Business and Renewals: Retaining existing clients and winning new clients by providing quality
    service, engaging members, leveraging technology and delivering new products and services, all of which
    deliver value to our clients and members and are critical to our business strategy.
  • Clinical Innovation: Executing a next-generation clinical strategy that is designed to establish a new
    benchmark for pharmacy healthcare by engaging members and modeling behaviors to improve clinical
    outcomes and reduce costs. In 2007, we re-engineered our pharmacy model around Medco Therapeutic
    Resource Centers». Through these centers, Medco specialist pharmacists — who have expertise in the
    medications used to treat certain chronic conditions — help achieve better clinical outcomes for patients
    with chronic and complex conditions by closing gaps in care.
  • Solutions for Seniors: Developing innovative and flexible approaches that assist our health plan and
    employer clients in successfully managing a range of opportunities available to seniors through Medicare
    Part D and other retiree programs.
  • Pioneering Research: Pharmacogenomics represents an opportunity to enhance our clinical programs by
    identifying a patient’s genetic profile through laboratory testing, which guides prescribing physicians to
    more accurately and quickly select the best medicine and the most appropriate dose optimized to an
    individual’s unique genotype, improving health outcomes and reducing overall healthcare costs. Through our
    acquisition of PolyMedica, we acquired CLIA (Clinical Laboratory Improvement Amendments) — certified
    laboratory capabilities and we have established collaborations with various organizations, including the
    Mayo Clinic, LabCorp, Harvard University, Indiana University School of Medicine and the FDA (Food and
    Drug Administration), and have been independently recognized for our research as a leader in pharmacoge-
    nomics. In addition, in 2009 we established the Medco Research InstituteTM, a new subsidiary that will
    coordinate, extend and amplify Medco’s research initiatives.

Other Business Initiatives
  • New Products and Markets: Making acquisitions, forming strategic alliances, and expanding into comple-
    mentary adjacent markets. In March 2008, we launched a collaboration with Sweden’s government-operated
    retail pharmacy authority, Apoteket, to develop and test the first automated electronic prescription review
    system to improve clinical and financial outcomes for Swedish patients and the country’s healthcare system.
    In April 2008, we acquired a majority interest in Europa Apotheek, a privately held company based in the
    Netherlands, which primarily provides mail-order pharmacy services in Germany. In 2009, we formed a
    joint venture with United Drug plc, a pan-European healthcare leader, to provide home-based pharmacy care
    services in the United Kingdom for patients covered by the country’s National Health Service. We believe
    these ventures leverage our proven proprietary technologies and ability to deliver customized solutions to
    meet the unique challenges of managing healthcare costs and improving clinical care abroad — transcending
    geography, political structures, and systemic healthcare structures.
  • Medco Health StoreTM: Providing a virtual channel for patients to purchase non-prescription products
    online, substantially extending our service with the convenience of mail delivery, while addressing the
    increasing safety concerns related to interactions between prescription and over-the-counter drugs, vitamins
    and supplements.
  • Financial Strategy: Delivering earnings growth and building shareholder value through a series of
    strategies, including: disciplined selling, general and administrative expense control; accelerating cash flow
    generation; managing debt levels; driving improvements in return on invested capital; and share repurchases.


                                                       5
In order for our strategy to be successful, we must anticipate and respond to both the common and unique
needs of our clients and other payors, and we must continue to deliver scalable yet flexible capabilities and solutions
that are affordable for payors and profitable for us. This includes delivering high-quality client and member service;
leveraging our significant technology investments to drive growth; reducing costs; actively pursuing sources of
growth from new clients and increasing our clients’ use of our value-added services, including our mail-order
pharmacies.
     We believe we have unique clinical and technological competitive advantages that enable us to deliver enhanced
services to clients and members, and effectively manage drug trend, ultimately reducing the total cost of healthcare.
These advantages include our specialized Therapeutic Resource Centers; our automated mail-order pharmacy
capability; our specialty pharmacy; our investments in other systems technologies including the Internet; our
extensive value-added programs and services offerings; our ability to generate significant discounts and rebates that
translate into client and member savings; and the cost-saving potential from our comprehensive generic substitution
programs.
    See “—Competition” below for a description of competition in the PBM industry.

Products and Services
     To support our efforts to control prescription drug costs for our clients while supporting the appropriate use of
prescription drugs, we offer a wide range of programs and services that help manage the cost, improve the quality
and streamline the administration procedures for traditional and specialty drugs.

  Plan Design
      Our client teams take a consultative approach to assisting clients in the development and implementation of
plan designs that suit their specific needs. Each client has access to the skills of various Medco professionals,
including experienced clinical, financial and information technology specialists. Each client’s success in achieving
the business objectives of their specific pharmacy benefit strategy ultimately depends on the design of their benefit
plan. These customized plan designs take into account formulary structure, retail pharmacy management, mail-order
initiatives, specialty pharmacy, drug coverage and exclusion, cost-share options, and generic drug utilization
initiatives.
     Integrating Medicare Part D considerations into plan designs is increasingly important to clients with Medicare-
eligible members. We support clients by managing several options they may select from: the Retiree Drug Subsidy
program, which is offered by CMS to reimburse municipalities, unions and private employers for a portion of their
eligible expenses for retiree prescription drug benefits; the Medco Employer Group Waiver Plan, a group-enrolled
Medicare Part D option for employers and labor groups; as well as serving as the “PBM inside” for a number of
Medicare Part D sponsors that offer drug-only and integrated medical and Medicare Part D drug benefits. Medco
also offers an individual prescription drug plan, and the Medco Medicare Prescription Plan», which is offered to
beneficiaries in all 34 Medicare regions across the U.S., as well as Puerto Rico.
     As an integral part of our consultative approach, our account teams use proprietary software tools that we have
developed to model the effects of different plan designs based on historical data, including Medco’s EXPERxT
Advisor», which provides real-time plan design modeling capability for our clients. Clients can use these models to
judge the impact of specific plan design elements before they are implemented.

  Clinical Management
     We capitalize on our clinical expertise and advanced information technology infrastructure to help reduce client
costs for prescription drugs in a medically appropriate manner, while striving to improve safety and the quality of
care for members. We do this by delivering evidence-based clinical programs and services for our commercial
clients based on clinical rationale reviewed by either the independent Pharmacy and Therapeutics Committee, or by
our National Practice Leaders for programs delivered from our Therapeutic Resource Centers.


                                                           6
Our Pharmacy and Therapeutics Committee makes decisions independently, and is comprised of a distinguished
independent group of clinicians. This independent advisory body guides us in maintaining a consistent and
therapeutically appropriate approach to the clinical content of certain programs and services, including, for example,
the development of formularies and coverage criteria.
      We offer coverage management and utilization management programs, including drug utilization review, which
is a systematic evaluation of individual and population use of prescription drugs, to identify and address over-use,
under-use, and misuse of prescription drugs. As a result of these evaluations, we alert pharmacists, physicians and
patients to possible issues, such as drug-drug interactions, and opportunities to consider alternate therapies including
generics and formulary preferred drugs.
      Our clients have the option of integrating our programs into their pharmacy benefit plan. To monitor our
activity under these programs, if requested by the client, we regularly report on the success of our programs, review
clinical and financial data, and identify opportunities for improvement.
     We have also introduced a complete portfolio of innovative clinical solutions. Among them is our proprietary
RationalMed» service, an advanced patient safety program designed to improve patient care and lower total
healthcare costs. RationalMed» analyzes patients’ available prescriptions, inpatient and outpatient medical and
laboratory claim records to detect gaps and errors in care, and then engages physicians, pharmacists and patients in
making appropriate changes. Clients who make the decision to participate in RationalMed» can save money by
reducing inappropriate and unsafe prescription use, reducing gaps in care and avoiding unnecessary medical costs.
We offer RationalMed» as a program to health plans and plan sponsors, regardless of whether they are clients of our
PBM business.
     For Medicare Part D plans, Medco offers a robust Medication Therapy Management program, designed to
ensure that covered Medicare Part D medications prescribed to targeted beneficiaries are appropriately utilized to
optimize therapeutic outcomes. Medco uses the Chronic Disease Score, a proprietary software algorithm, to identify
beneficiaries who meet the criteria established by CMS.
      Optimal Health» is Medco’s health and care support solution, offered through our 10-year alliance with
Healthways, Inc. Optimal Health» offers plan sponsors health improvement solutions across the entire population of
at-risk members with chronic and complex conditions which extends our therapy management capabilities to include
disease management services for those clients looking for a more comprehensive healthcare service for their
members. Through innovative engagement capabilities, Optimal Health» helps patients to understand their health
risks and take action with confidence to lead healthier lives. Clients who participate in Optimal Health» can save
money by increasing the percent of their covered population living healthier lifestyles — improving compliance with
evidence-based care guidelines for chronic conditions and avoiding unnecessary medical costs, particularly
hospitalizations.
      Our clinical expertise will be further enhanced by our emerging pharmacogenomics capabilities. As
pharmacogenomics becomes a more prominent component of prescription guidelines, our ability to build a new
generation of solutions to deliver precision medicine will result in improving safety and efficacy while enhancing
clinical outcomes and lowering costs.

  Clinical Services, Specialty Pharmacy
     Where appropriate, we work with the patient and the patient’s physician to implement the prescribed plan of
care. Each patient is typically supported by a team consisting of a pharmacist, a customer service representative and
a reimbursement specialist, and with certain therapies, a registered nurse. Generally, each patient’s team members
specialize in that patient’s disease and work with payors and providers in that patient’s geographic region. We assist
patients and their families in coping with a variety of difficult emotional and social challenges presented by their
diseases, and in some cases participate in patient advocacy organizations, assist in the formation of patient support
groups, and advocate legislation to advance patient interests.


                                                           7
Pharmacy Management
     One of the core features of our PBM service is the management of prescription claims.
     Mail-Order Service. The Medco PharmacyTM, our mail-order service, is the industry’s largest pharmacy based
on the number of prescriptions dispensed. In 2009, the Medco PharmacyTM filled 103.1 million prescriptions. Mail
order is most appropriate for chronic and complex maintenance medications. Typically, mail order reduces costs for
clients as a result of Medco’s purchasing scale, high levels of automation and efficiency, increased generic
dispensing and higher rebates through enhanced formulary compliance. Many members prefer mail order for
maintenance medications because they can receive up to a 90-day supply instead of the commonly dispensed 30-day
supply at retail pharmacies. Members also benefit from generally lower co-payments at mail order and the
convenience of receiving their prescriptions delivered to their home. Members can place first-fill, refill and renewal
orders through the mail or they can request refill or renewal orders easily online through our member website,
medco.com», or our integrated voice-response phone system. Additionally, physicians can fax first-fill prescriptions
to the Medco Pharmacy or use point-of-care technologies.
     Our PBM mail-order pharmacy operations consist of seven prescription order processing pharmacies that are
located throughout the United States, one of which also performs mail-order dispensing, and our two automated
dispensing pharmacies in Willingboro, New Jersey and Las Vegas, Nevada. Additionally, we expect to commence
operations in our third automated dispensing pharmacy in Whitestown, Indiana in 2010.
      In our prescription order processing pharmacies, our pharmacists, technicians and other staff focus on pharmacy
activities such as reviewing, recording and interpreting incoming prescriptions, screening for interactions based on
each patient’s drug history profile, resolving benefit issues with rules that are determined by plan sponsors, resolving
clinical or prescription clarification issues with physicians and collecting the copayment from the patient. Once these
processes are completed, the prescriptions are approved for dispensing and electronically routed to one of our mail-
order dispensing pharmacies. We use image-based technology, which provides for quick access to prescription orders
and promotes efficient processing. All of our Medco mail-order pharmacies are networked into one integrated
systems platform. This approach to mail-order operations frees the time of our professional pharmacists so they can
remain focused on patient care; it also optimizes the efficiency of the dispensing function, improving safety and
reducing costs.
      In our dispensing pharmacies, the focus is on fulfillment and distribution of medications to patients. Our
dispensing pharmacies use state-of-the-art, patented automated technology to dispense tablets and capsules, as well
as items dispensed in original packaging. The dedicated teams of pharmacists and pharmacy personnel achieve Six
Sigma quality levels and embrace Six Sigma process control and continuous improvement principles to ensure
patients get the right medication at the right time. Through the efforts of our high-performing people and technology,
we are able to use optimal dispensing methodologies to dispense prescriptions and then combine and sort orders for
shipment to reduce delivery times and place the medication in the hands of the patient as quickly and efficiently as
possible.
     PolyMedica provides diabetes testing supplies, prescriptions and related products to patients with diabetes
through its Liberty brand. PolyMedica meets the needs of diabetes patients by providing delivery of supplies through
locations in Florida and Virginia. For these services, PolyMedica bills Medicare, other government agencies and/or
private insurance companies directly, for those diabetes-related supplies.
     Medco Therapeutic Resource Centers». These centers, located within our mail-order pharmacy operations, are
designed around the theory that specialization leads to better pharmacy care for members with chronic and complex
conditions. To better serve these members and their plans, our pharmacists receive additional specialized training in
the chronic conditions that are generally associated with significant gaps in care and significant costs, such as
diabetes, heart disease and asthma. Medco specialist pharmacists of a given specialty practice together in centers
dedicated to the pharmacy care of people with needs in that disease category. Our scale and technology allow us to
dedicate entire pharmacy practices to a single specialty and bring the services of our Medco specialist pharmacists
to the members who need them, as they need them. Our acquisition of PolyMedica in 2007 complemented our
Therapeutic Resource Center strategy, focusing on the rapidly growing diabetes patient base, enabling an end-to-end
solution for members with diabetes who are able to order the supplies they need, along with their medications, to
manage their condition.


                                                           8
Specialty Pharmacy Management. Accredo Health Group provides an enhanced level of care to patients taking
specialty medicines to treat complex or chronic conditions. Accredo Health Group focuses on dispensing infused,
injectable, inhaled, and oral drugs that require a higher level of patient services and support compared to what
typically is available from traditional pharmacies. Many specialty drugs have FDA safety and monitoring
requirements. Accredo Health Group’s therapy teams may include specialty-trained pharmacists, nurses and patient
service representatives. Accredo Health Group patients receive counseling and education services and access to
nurses and pharmacists who are available around the clock to assist patients in managing critical aspects of care.
Accredo Health Group typically dispenses a 30- to 90-day supply of specialty medications directly to the patient or
the patient’s physician, with packaging and temperature-controlled handling and shipping as appropriate to maintain
product integrity. The shipment may contain ancillary supplies required for administration in the patient’s home. A
majority of products are dispensed and shipped from three specialty pharmacy facilities in Memphis, Tennessee;
Nashville, Tennessee; and Warrendale, Pennsylvania. Accredo Health Group also maintains branch and infusion
pharmacies across the United States.
     Retail Pharmacy Networks. We have contractual relationships covering approximately 60,000 independent and
chain retail pharmacies that have agreed to participate in one or more of our retail networks. A network offers
members access to a choice of pharmacies, while providing clients with contracted discount rates that we negotiate
with retail pharmacies. In general, these rates for brand-name drugs are at a discount to the average wholesale price
of the drug, which is the current standard pricing unit used in the industry. In addition, we determine a maximum
allowable cost for most generic drugs. Our retail pharmacy network agreements also include professional dispensing
fees paid to the retail pharmacy. Clients generally select a retail pharmacy network based on the number and
location of pharmacies in the network and the competitiveness of the discounts that the network offers. Pharmacies
in a network also agree to follow our policies and procedures designed to enhance specific performance standards
regarding patient safety and service levels.
      Call Center Pharmacies. We operate call center pharmacies, each of which is licensed as a pharmacy in the
state in which it is located and is staffed by pharmacists and service representatives. Personnel at our call center
pharmacies are available to answer questions and provide information and support to members 24 hours a day, seven
days a week, for members using either our mail-order service or our retail pharmacy networks. Our call center
pharmacies also provide information and services to physicians and pharmacists who provide service to our clients’
members. We also have a substantial number of work-at-home call center representatives, which allows flexibility in
providing appropriate coverage and contingency planning. The majority of our call center representatives are Medco
employees. We have, on a limited basis, outsourced some call handling capabilities to third-party vendors, including
the management of inbound calls from retail pharmacies.
      Reimbursement Services. With Accredo Health Group’s focus on specialty drugs to treat specific chronic
diseases, significant expertise has been developed in managing reimbursement issues related to the patient’s
condition and treatment program. Due to the long duration and high cost of therapy generally required to treat these
chronic disorders, the availability of adequate health insurance is a constant concern for chronically ill patients.
Generally, the payor, such as an insurance provider under a medical benefit, is contacted prior to each shipment to
determine the patient’s health plan coverage and the portion of costs that the payor will reimburse. Reimbursement
specialists review matters such as pre-authorization or other prior approval requirements, lifetime limits, pre-existing
condition clauses, and the availability of special state programs. By identifying coverage limitations as part of an
initial consultation, we can assist the patient in planning for alternate coverage, if necessary. In addition, we accept
assignment of benefits from numerous payors, which substantially eliminates the claims submission process for most
patients. Historically, drugs were primarily reimbursed by the patient’s health insurance plan through a medical
benefit. This has evolved where, based on the type of drug dispensed, an increasing percentage of transactions are
reimbursed through a prescription card benefit, which typically accelerates reimbursement.


                                                           9
Physician Services
     Helping physicians to prescribe more cost-effective therapies and providing easy physician access to our mail-
order pharmacy services are key Medco objectives. We offer a number of programs designed to meet these goals,
from our Physician’s Service Center, which is dedicated to answering physician questions and accepting phone
prescriptions, to products like RationalMed» and Physician Practice Summaries, which inform physicians about
prescribing options and patterns for their Medco patients.
    We encourage physicians to prescribe electronically through a number of initiatives including through our
founding role in Surescripts», which promotes a standardized platform to route prescriptions from prescribers to
pharmacies, and our involvement in regional initiatives that promote electronic prescribing such as the Southeast
Michigan ePrescribing Initiative (SEMI) undertaken by Medco and the three largest U.S. auto makers.
     Our approach to the physician community includes the establishment of a department for Physician Advocacy &
Strategy, which considers the physician viewpoint in the development of our products and services. We use market
research with practicing physicians and their staff to better understand the needs of the physician office in working
with Medco effectively.

  Internet-Based Services
      Our Internet-based services have been recognized as the most advanced and comprehensive in the PBM
industry. Not only do we offer what we believe is the industry’s leading consumer website for members, we also
offer sites for clients and retail pharmacists that provide interactive tools aimed at improving compliance with plan
goals, simplifying benefit administration, and providing critical benefit and medical information. Our My Rx
Choices» prescription savings program provides members with greater transparency around their benefits and
facilitates more informed patient-physician dialogue. It is designed to lead to lower costs for our clients and their
members.
     Member-Oriented Web Services. Our member website capabilities allow members to self-manage their
prescription benefits, while encouraging the use of safe, effective therapies that comply with their plan’s provisions.
Our member website, medco.com», was the first Internet pharmacy site to be certified by the National Association
of Boards of Pharmacy.
      Medicare Part D Web Services. Our member website also supports pre-enrollment and post-enrollment activities
on behalf of our Medicare PDP and programs serving multiple clients. Prospective Medicare PDP participants and
their caregivers can use the pre-enrollment site’s Plan Compare tool to accurately project costs for all their
medications. The post-enrollment site allows members who have signed up to receive a Medicare Part D benefit
from either Medco or one of our clients to securely manage all aspects of their prescription program.
     Client-Oriented Web Services. Our client website provides online access to Medco’s proprietary tools for
reporting, analyzing and modeling data, clinical-utilization management and decision-support, plan administration,
including eligibility and claims reviews, the latest industry news, and easy submission and tracking of service
requests. Clients who perform their own member service can use our client website to update eligibility data and
counsel members on all aspects of their pharmacy benefit, formularies, co-payments and coverage provisions,
including the location of retail network pharmacies. Clients also have the ability to view detailed, consolidated
claims for retail and mail-order service and issue prior-authorization approval. We can tailor access to the specific
needs of different users involved in managing the pharmacy benefit within the client organization, limiting access
only to authorized individuals.
     Pharmacist-Oriented Web Services. Our Pharmacist Resource Center offers online support for retail pharmacies
that participate in our national networks. This service provides pharmacists with the latest information on new
benefit plans, plan design changes, pricing information, drug recalls and alerts, as well as online access to our
pharmacy services manual. Pharmacists can use this service to check patient eligibility, determine coverage and
review claims status for plan members. The center also gives participating pharmacies e-mail access to our pharmacy
services help desk.


                                                          10
Contractual Relationships
      Clients. Our net revenues are principally derived from contracting with clients to provide prescription drugs to
their members through our mail-order pharmacies and our networks of retail pharmacies. Our PBM client contracts
provide that a client will pay for drugs dispensed to its members at specified discounts to average wholesale prices
or other industry benchmarks, plus the applicable dispensing fee. Both the specified discounts to average wholesale
prices and the applicable dispensing fee vary based on whether the drug dispensed is a brand-name drug, generic
drug or a specialty drug, and whether the prescription is dispensed through our mail-order pharmacies or a pharmacy
in our retail network. Clients may also pay an administrative fee or other fees for various services we provide. These
services include claims processing, eligibility management, benefits management, formulary compliance manage-
ment, clinical and retail pharmacy network management, and other related services. Client contracts may also
provide that we will share with clients some or all of the rebates we receive from pharmaceutical manufacturers for
that client’s utilization.
     Additionally, many of our contracts with clients contain provisions that guarantee the level of service we will
provide to the client, the minimum level of rebates or discounts the client may receive, closure of gaps in care, or
guaranteed savings levels. These clients may be entitled to performance penalties if we fail to meet a service or cost
guarantee. The majority of our clients are party to these types of contracts, and our clients are generally entitled to
audit our compliance with their contracts.
     CMS. Our product net revenues also include premiums associated with our Medicare PDP risk-based product
offerings. These products involve prescription dispensing for beneficiaries enrolled in the CMS-sponsored Medicare
Part D prescription drug benefit. Our two insurance company subsidiaries have been operating under contracts with
CMS since 2006, and currently offer several Medicare PDP options. The products involve underwriting the benefit,
charging enrollees applicable premiums, providing covered prescription drugs and administering the benefit as filed
with CMS. We provide three Medicare drug benefit plan options for beneficiaries, including (i) a “standard Part D”
benefit plan as mandated by statute, and (ii) two benefit plans with enhanced coverage, that exceed the standard
Part D benefit plan, available for an additional premium. We also offer numerous customized benefit plan designs to
employer group retiree plans under the Medicare Part D prescription drug benefit.
     Pharmaceutical Manufacturers. Our contracts with pharmaceutical manufacturers provide us with rebates and
fees for prescription drugs dispensed through our mail-order pharmacies and retail pharmacy networks, discounts for
prescription drugs we purchase and dispense from our mail-order pharmacies, and performance-based service fees
associated with certain specialty drugs. Rebates and fees are generally calculated as a percentage of the aggregate
dollar value of a particular drug that we dispensed, based on the manufacturer’s published wholesale price for that
drug. Rebates and fees are generally invoiced to the pharmaceutical manufacturer and paid to us on a quarterly
basis. We share the majority of rebates with our clients, which are based on the provisions of the applicable client
contract, and may also guarantee a minimum rebate per prescription dispensed to the client’s members.
      Retail Pharmacies. We have contractual relationships covering approximately 60,000 independent and chain
retail pharmacies that have agreed to participate in one or more of our retail networks. See “— Products and
Services — Retail Pharmacy Networks” above for more information.

Clients
     We have clients in a broad range of industry categories, including various Blue Cross/Blue Shield plans;
managed care organizations; insurance carriers; third-party benefit plan administrators; employers; federal, state and
local government agencies; and union-sponsored benefit plans. For the fiscal year ended December 26, 2009, our ten
largest clients based on revenue accounted for approximately 49% of our net revenues, including UnitedHealth
Group Incorporated (“UnitedHealth Group”), our largest client, which represented approximately $11,300 million, or
19%, of our net revenues. The UnitedHealth Group account has a lower than average mail-order penetration and,
because of its size, steeper pricing than the average client, and consequently generally yields lower profitability as a
percentage of net revenues than smaller client accounts. In addition, with respect to mail-order volume, which is an
important contributor to our overall profitability, the mail-order volume associated with this account represented less
than 10% of our overall mail-order volume for the fiscal year ended December 26, 2009. Under our current
agreement with UnitedHealth Group, we are providing pharmacy benefit services through December 31, 2012. None
of our other clients individually represented more than 10% of our net revenues in 2009, 2008 or 2007.


                                                          11
Mail-Order Inventory Suppliers
     We maintain inventory in our mail-order pharmacies primarily representing a broad range of brand-name,
generic and specialty pharmaceuticals. If a drug is not in our inventory, we can generally obtain it from a supplier
within one or two business days. We purchase our pharmaceuticals either from our primary wholesaler,
AmerisourceBergen Corp., which accounted for approximately 62% of our overall 2009 drug purchases, or directly
from pharmaceutical manufacturers. Most of the purchases from our primary wholesaler were for brand-name
medicines. Specialty and generic drugs are generally purchased directly from manufacturers. We believe that
alternative sources of supply for most generic and brand-name pharmaceuticals are readily available, except to the
extent that brand-name drugs are available to the market exclusively through the manufacturer.
     Accredo also has supply agreements with specialty product manufacturers. In addition, our agreements with
certain biopharmaceutical manufacturers may contain minimum purchasing volume commitments. Certain biophar-
maceutical manufacturers may also make selected biopharmaceuticals available to only a limited number of specialty
pharmacies.

Competition
     Competition among providers of services similar to those that we provide is intense. We compete primarily on
the basis of our ability to design and administer innovative programs and services that provide a flexible, high
quality prescription drug benefit management offering to our clients and their members at competitive pricing to the
plan sponsor. We believe the following factors are critical to our ongoing competitiveness:
    • Ability to differentiate ourselves in the marketplace with our innovative member engagement model, which
      includes the specialized practice of pharmacy and services accessed through Medco Therapeutic Resource
      Centers», our initiatives in the field of pharmacogenomics and the innovative Medco Research InstituteTM.
      Collectively these programs and initiatives are designed to improve clinical outcomes and reduce the total
      cost of healthcare for plan sponsors;
    • Ability to effectively provide innovative plan designs focused on the specific and changing needs of clients,
      patients and other payors, as well as effectively administer new programs, such as those associated with
      Medicare Part D;
    • Broad capabilities, and regional and national scale to provide a fully integrated prescription benefit model,
      including effective mail order, retail access, specialty pharmacy, and customer service;
    • Quality and breadth of clinical services designed to provide a high level of care and compliance;
    • Proven history in effectively managing drug trend, including the ability to negotiate favorable discounts
      from pharmaceutical manufacturers and retail pharmacies, rebates from brand-name pharmaceutical manu-
      facturers, and the ability to encourage the use of lower cost generics, all of which return value to the plan
      sponsor;
    • Use of technology to deliver information and services to clients and members; and
    • Financial strength.


                                                         12
We compete with a wide variety of market participants, including national, regional and local PBMs, Blue
Cross/Blue Shield plans, insurance companies, managed care organizations, large retail pharmacy chains, large retail
stores and supermarkets with in-store pharmacy operations and Internet pharmacies. Our competitors include many
profitable and well-established companies that have significant financial, marketing and other resources. Some of
our specialty pharmacy and clinical service offerings compete with similar services provided by smaller companies
in niche markets. Our main competitors include Aetna Inc., CIGNA Corporation, CVS Caremark Corporation,
Express Scripts, Inc., Humana Inc., UnitedHealth Group, Walgreen Co. and Wal-Mart Stores, Inc.
     Consolidation of client entities within the markets we serve, as well as the consolidation of our competitors, or
suppliers could impair our ability to attract and retain clients. We believe, however, that our efficient and integrated
business model, our differentiating clinical programs, our innovative services and the alignment of our business
model with the demands of clients and members, will enable us to compete effectively.

Corporate Compliance and Government Regulation
  Corporate Compliance and Ethics Program
     We have always been committed to the highest levels of integrity in our business operations, insisting on ethical
behavior and compliance with statutory, regulatory and other legal requirements. Medco’s Corporate Compliance
and Ethics Program (“Compliance and Ethics Program”) is designed to maintain a culture at Medco that promotes
our core value of business with integrity and the prevention, detection and resolution of potential violations of laws
or Company policies. To achieve this goal, we are committed to an effective compliance and ethics program tailored
to our business and working environment. The Compliance and Ethics Program is dynamic, involving regular review
and assessment to ensure that it is responsive to our changing business strategy and utilizes a broad risk management
framework for planning and decision-making.
      The Compliance and Ethics Program supports a broad set of standards of business conduct designed to reduce
the prospect of criminal and other improper conduct and to promote compliance with federal and state laws and
regulations, including statutes, regulations and written directives of Medicare, Medicaid and all other federal and
state programs in which we participate. These standards are embodied in our Code of Conduct, Conflict of Interest,
Use and Disclosure of Individual Health Information and other key policies. These standards are delivered through
our Standards of Business Conduct, which provide information about the Compliance and Ethics Program and
summarize key policies, and through training to employees and contingent workers regarding the specific rules,
regulations, policies and procedures that must be followed. In addition, the Compliance and Ethics Program
encourages adherence to business unit and departmental procedures created to effect safe and efficient delivery of
our products and services while operating our business within a compliant environment.
     Our Compliance and Ethics Program addresses the following elements of an effective program:
       •     Establishing and communicating compliance-related policies and procedures;
       •     Creating a high-level structure to oversee and implement compliance efforts;
       •     Educating and training employees and consultants;
       •     Internal reporting mechanisms;
       •     Regular monitoring and auditing;
       •     Effective performance and disciplinary standards; and
       •     Procedures for promptly responding to potential misconduct.
    Oversight responsibility for our Compliance and Ethics Program is assigned to our Audit Committee of the
Board of Directors, along with our Corporate Compliance Committee, consisting of members of senior management.
Our Corporate Compliance Officer has day-to-day responsibility for ensuring that we maintain an effective
compliance and ethics program.


                                                           13
Employees are encouraged to raise concerns about improper, illegal, or unethical conduct, as well as specific
instances of non-compliance. Our Compliance and Ethics Office is an available resource, either directly or via the
Compliance and Ethics Line, for all employees to report compliance concerns or to raise questions about any
business practices. Other reporting mechanisms are available through the Accredo Compliance Office, the
PolyMedica Compliance Office, the Medicare Compliance Office or the Privacy Office. Once raised, we immedi-
ately review, investigate, and resolve all concerns about non-compliant behavior and report them through the
Corporate Compliance Officer in a consolidated presentation to the Corporate Compliance Committee and the Audit
Committee of the Board of Directors.

  Government Regulation
     Federal and state laws and regulations govern many aspects of our business: our administration of prescription
drug benefits and our drug and health education programs and services; the activities of our mail-order pharmacies;
the provision of nursing services; and the operations of laboratories. We believe we are in substantial compliance
with all existing legal and regulatory requirements material to the operation of our business. We have standard
operating procedures and controls designed to assist in ensuring compliance with existing contractual requirements
and state and federal law. We diligently monitor and audit our adherence to these procedures and controls, and we
take prompt corrective and disciplinary action when appropriate. However, we cannot predict how courts or
regulatory agencies may interpret existing laws or regulations or what additional federal or state legislation or
regulatory initiatives may be enacted in the future regarding healthcare or the PBM industry and the application of
complex standards to the operation of our business creates areas of uncertainty.
    Among the federal and state laws and regulations that affect aspects of our business are the following:
     Regulation of Our Pharmacy, Nursing, Home Health Agency, and Laboratory Operations. Our mail-order
pharmacies deliver prescription drugs and supplies to individuals in all 50 states. The practice of pharmacy is
generally regulated at the state level by state boards of pharmacy. Each of our dispensing pharmacies, prescription
processing centers and call center pharmacies must be licensed in the state in which it is located. In some of the
states where our dispensing pharmacies are located, state regulations require compliance with standards promulgated
by the United States Pharmacopeia (“USP”). The USP creates standards in the packaging, storage and shipping of
pharmaceuticals. Also, many of the states where we deliver pharmaceuticals, including controlled substances, have
laws and regulations that require out-of-state mail-order pharmacies to register with that state’s board of pharmacy
or similar regulatory body. In addition, some states have proposed laws to regulate online pharmacies, and we may
be subject to this legislation if it is passed. Furthermore, those of our pharmacies that dispense durable medical
equipment items, such as infusion pumps, and that bear a federal legend requiring dispensing pursuant to a
prescription, are also regulated by applicable state and federal durable medical equipment laws. Accredo Health
Group also operates wholesale pharmacy operations, which are subject to state licensure.
      Federal agencies further regulate our pharmacy operations. Pharmacies must register with the U.S. Drug
Enforcement Administration and individual state controlled substance authorities in order to dispense controlled
substances. In addition, the FDA (Food and Drug Administration) inspects facilities in connection with procedures
to effect recalls of prescription drugs. The FTC (Federal Trade Commission) also has requirements for mail-order
sellers of goods. The U.S. Postal Service (“USPS”) has statutory authority to restrict the transmission of drugs and
medicines through the mail to a degree that could have an adverse effect on our mail-order operations. If the USPS
restricts our ability to deliver drugs through the mail, alternative means of delivery are available to us. However,
alternative means of delivery could be significantly more expensive. The Department of Transportation has
regulatory authority to impose restrictions on drugs inserted in the stream of commerce. These regulations generally
do not apply to the USPS and its operations.
     In addition, in those states that require home health or nursing licensure to provide in-home patient education
or in-home administration of the pharmaceuticals we dispense, we are also regulated by those states’ Department of
Health. Some states also require Certificates of Need in order to be granted home health agency licensure. Finally,
our molecular genetics laboratory has received all necessary licenses including federal CLIA (Clinical Laboratory
Improvement Amendments) and State of Florida Agency for Health Care Administration approval to allow us to
perform and report the results for certain diagnostic tests.


                                                         14
We believe that our operations have the appropriate licenses required under the laws of the states in which they
are located and that we conduct our pharmacy, laboratory and nursing operations in accordance with the laws and
regulations of these states.
      Third-Party Administration and Other State Licensure Laws. Many states have licensure or registration laws
governing companies that perform third-party administration, or TPA, services on behalf of others. The definition of
a TPA required to register and comply with these laws varies from state to state. In addition, many states have laws
or regulations that govern ancillary healthcare organizations, including preferred provider organizations and
companies that provide utilization review and related services. The scope of these laws differs significantly from
state to state, and the application of these laws to the activities of PBMs is often unclear. These regulations generally
require annual or more frequent reporting and licensure renewals and impose other restrictions or obligations
affecting PBM services. We have registered under these laws in states in which we have concluded, after discussion
with the appropriate state agency, that registration is required.
     Consumer Protection Laws. Most states have consumer protection laws designed to ensure that information
provided to consumers is adequate, fair and not misleading. We believe that our practices conform to the
requirements of state consumer protection laws. However, we may be subject to further scrutiny under these laws as
they are often interpreted broadly.
      Network Access Legislation. As part of our PBM services, we form and manage pharmacy networks by entering
into contracts with retail pharmacies. A significant number of states have adopted legislation that may affect our
ability to limit access to our retail pharmacy networks or to remove retail pharmacies from a network. This type of
legislation, commonly known as “any willing provider” legislation, may require us or our clients to admit into our
networks and retain any retail pharmacy willing to meet the price and other terms of our clients’ plans. To date,
these statutes have not had a significant impact on our business. We will admit any licensed pharmacy that meets
our network’s terms, conditions and credentialing criteria.
     Proposals for Direct Regulation of PBMs. Legislation directly regulating PBM activities in a comprehensive
manner has been introduced in a number of states. In addition, legislation has been proposed in some states seeking
to impose fiduciary obligations or disclosure requirements on PBMs. If enacted in a state in a form that is applicable
to the operations we conduct there, this type of legislation could materially adversely impact us. Maine and the
District of Columbia have each enacted a statute imposing fiduciary and disclosure obligations on PBMs. Other
states, including Maryland, have enacted PBM regulation laws that differ from the Maine and District of Columbia
laws, and are generally less onerous.
     ERISA Regulation. We provide PBM services to a number of different corporations and other sponsors of health
plans that are subject to ERISA (the Employee Retirement Income Security Act of 1974). ERISA regulates
employee pension benefit plans and employee welfare benefit plans, including health benefit and medical plans.
     ERISA imposes duties on any person that is a fiduciary with respect to a plan that is subject to ERISA. We
administer pharmacy benefit plans according to the plan design choices made by the plan sponsor. We believe that
our activities are sufficiently limited that we are not a fiduciary except in those instances in which we have
expressly contracted to act as a fiduciary for the limited purpose of addressing benefit claims and appeals, including
our program to meet the U.S. Department of Labor (“DOL”) regulations for claims payment and member appeals.
      In addition, the DOL has recently issued proposed regulations under the provisions of ERISA that regulate plan
contracts with service providers, including PBMs. We anticipate that the DOL will issue amended regulations in the
first quarter of 2010. The proposed regulations mandate specific disclosure by service providers. Failure to comply
with the regulations could also result in a prohibited transaction. The DOL has solicited comments on the proposed
regulations and we anticipate that they will change before they are finalized. As a result, we are not yet able to
assess the impact on our business. We will comply with the regulations when they are finalized.


                                                           15
A number of lawsuits have been filed against us, alleging that we should be treated as a “fiduciary” under
ERISA and that we have breached our fiduciary obligations under ERISA in connection with our development and
implementation of formularies, preferred drug listings and intervention programs. For further information on this
litigation and the proposed settlement, see Note 14, “Commitments and Contingencies — Legal Proceedings,” to our
audited consolidated financial statements included in Part II, Item 8 of this Annual Report on Form 10-K.

  Fraudulent Billing, Anti-Kickback, Stark, Civil Monetary Penalties, and False Claims Laws and Regulations.
     Billing. Our operations participate in federal and state programs such as Medicare and Medicaid, where we are
subject to extensive government regulation including numerous state and federal laws and corresponding regulations
directed at preventing fraud and abuse and regulating reimbursement. The government’s Medicare and Medicaid
regulations are complex and sometimes subjective and therefore may require management’s interpretation. Our
compliance with Medicare and Medicaid regulations may be reviewed by federal or state agencies, including the
United States Department of Health and Human Services’ Office of the Inspector General (“OIG”), CMS, the
Department of Justice (“DOJ”), and the FDA. To ensure compliance with Medicare, Medicaid and other regulations,
government agencies conduct periodic audits of us to ensure compliance with various supplier standards and billing
requirements. Similarly, regional health insurance carriers routinely conduct audits and request patient records and
other documents to support claims submitted by us for payment.
     Anti-Kickback Laws and Regulations. Federal law prohibits the payment, offer, receipt or solicitation of any
remuneration that is knowingly and willfully intended to induce the referral of Medicare, Medicaid or other federal
healthcare program beneficiaries for the purchase, lease, ordering or recommendation of the purchase, lease or
ordering of items or services reimbursable under federal healthcare programs. These laws are commonly referred to
as anti-remuneration or anti-kickback laws. Several states also have similar laws, known as “all payor” statutes,
which impose anti-kickback prohibitions on services not covered by federal healthcare programs. Anti-kickback laws
vary between states, and courts have rarely interpreted them.
     Courts, the OIG, and some administrative tribunals have broadly interpreted the federal anti-kickback statute
and regulations. Courts have ruled that a violation of the statute may occur even if only one of the purposes of a
payment arrangement is to induce patient referrals or purchases. It is possible that our practices in the commercial
sector may not be appropriate in the government payor sector.
      The Ethics in Patient Referrals Law (Stark Law). Federal law prohibits physicians from making a referral for
certain health items or services if they, or their family members, have a financial relationship with the entity
receiving the referral. No bill may be submitted in connection with a prohibited referral. Violations are punishable
by civil monetary penalties upon both the person making the referral and the provider rendering the service. Such
persons or entities are also subject to exclusion from Medicare and Medicaid. Many states have adopted laws similar
to the Stark Law, which restrict the ability of physicians to refer patients to entities with which they have a financial
relationship.
      The False Claims Act. The Federal False Claims Act prohibits the submission of a false claim or the making of
a false record or statement in order to secure a reimbursement from a government-sponsored program. In recent
years, the federal government has launched several initiatives aimed at uncovering practices that violate false claims
or fraudulent billing laws. Civil monetary penalties may be assessed for many types of conduct, including conduct
that is outlined in the statutes above and other federal statutes in this section. Under the Deficit Reduction Act of
2005 (“DRA”), states are encouraged to pass State False Claims Act laws similar to the Federal statute.
     Sanctions for fraudulent billing, kickback violations, Stark Law violations or violations of the False Claims Act
include criminal or civil penalties. If we are found to have violated any state or federal kickback, Stark Law or
False Claims Act law, we could be liable for significant damages, fines or penalties and potentially be ineligible to
participate in federal payor programs.


                                                           16
Regulation of Financial Risk Plans. We own two insurance companies: Medco Containment Life Insurance
Company (“Life”) and Medco Containment Insurance Company of New York (“NY”). On a combined basis, these
subsidiary insurance companies are licensed in 50 states, the District of Columbia and the Commonwealth of Puerto
Rico and are subject to extensive regulatory requirements imposed under the insurance laws of the states in which
they are domiciled, as well as those in which they have obtained licenses to transact insurance business. Since 2006,
the Life and NY companies have been operating under contracts with CMS and currently offer several Medicare
PDP options. These products involve prescription dispensing for beneficiaries enrolled in the CMS-sponsored
Medicare Part D prescription drug benefit. The products involve underwriting the benefit, charging enrollees
applicable premiums, providing covered prescription drugs and administering the benefit as filed with CMS. We
provide three Medicare drug benefit plan options for beneficiaries, including (i) a “standard Part D” benefit plan as
mandated by statute, and (ii) two benefit plans with enhanced coverage, that exceed the standard Part D benefit
plan, available for an additional premium. We also offer numerous customized benefit plan designs to employer
group retiree plans under the CMS Medicare Part D prescription drug benefit.
      Regulation Relating to Data Transmission and Confidentiality of Patient Identifiable Information. Dispensing of
prescriptions and management of prescription drug benefits require the ability to utilize patient-specific information.
Government regulation of the use of patient identifiable information has grown substantially over the past several
years. At the federal level, Congress enacted the Health Insurance Portability and Accountability Act of 1996, or
HIPAA, and the Department of Health and Human Services, or HHS, has adopted extensive regulation, governing
the transmission, use and disclosure of health information by all participants in healthcare delivery, including
physicians, hospitals, insurers and other payors (“Privacy Standards”). Our pharmacy operations are covered entities
under the Privacy Standards and are directly subject to these requirements. In our role as a manager of the
prescription benefit, we are a business associate of health plan clients, which are covered entities subject to the
Privacy Standards. In February 2009, the American Recovery and Reinvestment Act of 2009 (P.L. 111-16) was
signed into law, which includes several changes to the HIPAA privacy and security rules, including an increase in
penalties for HIPAA violations and making business associates directly subject to the Privacy Standards. In addition,
many states have passed or are considering laws addressing the use and disclosure of health information. These
proposals vary widely, some relating to only certain types of information, others to only certain uses, and yet others
to only certain types of entities. These laws and regulations have a significant impact on our operations, products
and services, and compliance with them is a major operational requirement. Regulations and legislation that severely
restrict or prohibit our use of patient identifiable information could materially adversely affect our business.
     Sanctions for failing to comply with HIPAA standards include criminal and civil penalties. If we are found to
have violated any state or federal statute or regulation with regard to the confidentiality, dissemination or use of
patient medical information, we could be liable for significant damages, fines or penalties.
     Regulation Applicable to Clients. We provide services to insurers, managed care organizations, Blue Cross/Blue
Shield plans and many others whose ability to offer a prescription benefit may be subject to regulatory requirements
and constraints under a number of federal or state regulations. While we may not be directly subject to these
regulations, they can have a significant impact on the services we provide our clients.
    • Formulary Restrictions. A number of states have enacted laws that regulate the establishment of formularies
      by insurers, Health Maintenance Organizations (“HMOs”) and other third-party payors. These laws relate to
      the development, review and update of formularies; the role and composition of pharmacy and therapeutics
      committees; the availability of formulary listings; the disclosure of formulary information to health plan
      members; and a process for allowing members to obtain non-preferred drugs without additional cost-sharing
      where the non-preferred drugs are medically necessary and the formulary drugs are determined to be
      inappropriate. Increasing regulation of formularies by states could significantly affect our ability to develop
      and administer formularies on behalf of our insurer, HMO and other health plan clients.
    • Industry Standards for PBM, Pharmacy, and Home Health Functions. The National Committee on Quality
      Assurance, the American Accreditation Healthcare Commission, known as URAC, the Joint Commission on
      Accreditation of Healthcare Organizations and other quasi-regulatory and accrediting bodies have developed
      standards relating to services performed by PBMs and specialty pharmacies, including mail order, formulary,
      drug utilization management, specialty pharmacy and nursing care. While the actions of these bodies do not have
      the force of law, PBMs and many clients for PBM services seek certification from them, as do other third parties
      with which our subsidiaries may contract for services. These bodies may influence the federal government or
      states to adopt requirements or model acts that they promulgate. The federal government and some states
      incorporate accreditation standards of these bodies, as well as the standards of the National Association of
      Insurance Commissioners and the National Association of Boards of Pharmacy, into their drug utilization review
      regulation. Future initiatives of these bodies are uncertain, and resulting standards or legislation could impose
      restrictions on us or our clients in a manner that could significantly impact our business.
    • Currently, Congress is considering a variety of healthcare reform proposals that may affect both PBMs and
      our clients. The result of this effort is uncertain, and we are evaluating appropriate actions if such legislation
      were to be enacted.


                                                          17
Legislation and Regulation Affecting Drug Prices and Potentially Affecting the Market for Prescription Benefit
Plans and Reimbursement for Durable Medical Equipment. Recently, the federal government has increased its focus
on methods drug manufacturers employ to develop pricing information, which in turn is used in setting payments
under the Medicare and Medicaid programs. One element common to many payment formulas, the use of “average
wholesale price,” or AWP, as a standard pricing unit throughout the industry, has been criticized as not accurately
reflecting prices actually charged and paid at the wholesale or retail level. The DOJ is currently conducting, and the
House Energy and Commerce Committee has conducted, an investigation into the use of AWP for federal program
reimbursement, and whether the use of AWP has inflated drug expenditures by the Medicare and Medicaid
programs. Federal and state proposals have sought to change the basis for calculating reimbursement of certain drugs
by the Medicare and Medicaid programs.
     The DRA revised the formula used by the federal government to set the Federal Upper Limit (FUL) for
multiple source drugs by adopting 250 percent of the average manufacturer’s price (“AMP”) without regard to
customary prompt pay discounts to wholesalers for the least costly therapeutic equivalent. In July 2006, HHS
published a Final Rule for the Medicaid Prescription Drug Program implementing the DRA in which AMP was
defined to exclude discounts and rebates to PBMs and include sales to mail-order and specialty pharmacies in the
AMP calculation by manufacturers. Congress postponed implementation of the new definition for AMP until
September 2009 through the Medicare Improvements for Patients and Providers Act of 2008 (“MIPPA”) enacted in
July 2008.
     These proposals and other legislative or regulatory adjustments that may be made to the program for
reimbursement of drugs by Medicare and Medicaid, if implemented, could affect our ability to negotiate discounts
with pharmaceutical manufacturers. They could also impact the reimbursement our specialty pharmacies receive
from government payors. In addition, they may affect our relationships with pharmacies and health plans. In some
circumstances, they might also impact the reimbursement that we receive from managed care organizations that
contract with government health programs to provide prescription drug benefits or otherwise elect to rely on the
revised pricing information. Furthermore, private payors may choose to follow the government’s example and adopt
different drug pricing bases. This could affect our ability to negotiate with plans, manufacturers and pharmacies
regarding discounts and rebates.
     Relative to our diabetes testing supplies business, the Durable Medical Equipment, Prosthetics, Orthotics and
Supplies (DMEPOS) Competitive Bid Program (the “Program”) provides for a phased-in program for competitive
bidding of certain durable medical equipment items, including mail-order diabetes testing supplies. The first round
of bidding under the Program was delayed in 2007, which resulted in a 9.5% reimbursement rate reduction for the
Program product categories effective January 1, 2009 and also provided for no annual payment updates for 2009.
The Program was re-initiated effective October 21, 2009 and the first round of bidding closed on December 21,
2009. Winning bids along with the applicable reimbursement rates are anticipated to be announced during the
summer of 2010, with new reimbursement rates becoming effective in January 2011 for a limited number of
geographic areas. Moreover, Congressional action has provided CMS with additional authority to use pricing
information gathered during the Program for purposes of establishing reimbursement rates in geographic areas not
subject to competitive bidding.
     Medicare Part D and Part B. The Medicare Prescription Drug, Improvement and Modernization Act of 2003
(P.L.108-173) (the “Act”) also offers far-reaching changes to the Medicare program. Important to us, the Act
established a new Medicare Part D outpatient prescription drug benefit for over 40 million Americans who are
eligible for Medicare. Qualified beneficiaries, including senior citizens and disabled individuals, have had the
opportunity to enroll in Medicare Part D since January 1, 2006.


                                                         18
Medco’s insurance subsidiaries have been approved by CMS to participate in the Medicare Part D program as a
national PDP sponsor, and Medco pharmacies may also be providers of prescription drugs and diabetes supplies to
those of our patients who are covered under Medicare Part B. In addition, we have been supporting a significant
number of Medco clients who have elected to continue to offer a prescription drug benefit to their Medicare retirees
as primary coverage outside of the Medicare Part D benefit and receive a government subsidy. Furthermore, we
support our clients with their Medicare Advantage programs that now include the Medicare Part D benefit, and with
their PDP programs as the pharmacy benefit manager.
     State Prescription Drug Assistance Programs. Many states have expanded state prescription drug assistance
programs to increase access to drugs by those currently without coverage and/or supplement the Medicare Part D
benefit of those with coverage to offer options for a seamless benefit. In accordance with applicable CMS
requirements, we have entered into agreements with a number of state prescription drug assistance programs and
collaborated to coordinate benefits with Medicare Part D plans. This endeavor supports the coordination of benefits
of our clients’ Medicare Part D offerings.
      Prompt Pay Regulations. Many states have adopted prompt pay regulations that require health plans to pay or
deny claims within a certain timeframe. These laws generally apply to insurers and/or HMOs, although some recent
initiatives have included PBMs directly. Medco currently pays pharmacies on an established two-week cycle basis as
defined in the Participating Pharmacy Agreement. Pharmacies receive payment within 30 days for 100% of
successful point-of-sale (POS) claims processed in a two-week cycle. Prompt pay requirements for Medicare Part D
prescription drug plan claims went into effect on January 1, 2010.
      Drug Importation. In the face of escalating costs for plan sponsors providing a prescription drug benefit for their
employees, and uninsured individuals seeking to lower their drug costs, the issue of importing drugs from Canada or
other foreign countries has received significant attention. Drug importation, sometimes called drug re-importation, occurs
when prescription medicines from other countries are imported for personal use or commercial distribution. Our clients
have expressed interest in the potential for drug importation to reduce their drug benefit costs. Individual importation
activities are generally prohibited under U.S. law, and the FDA has issued warnings and safety alerts to a number of
entities seeking to promote or facilitate systematic importation activities. However, there has been considerable
legislative and political activity seeking to change the FDA requirements to enable drug importation, and we are
evaluating appropriate actions if such legislation were to be enacted.
     Health Management Services Regulation. All states regulate the practice of medicine and the practice of
nursing. We believe our nurses in our Specialty Pharmacy business are properly licensed in the state in which they
practice. We believe that the activities undertaken by specialty pharmacy nurses comply with all applicable laws or
rules governing the practice of nursing or medicine. However, a federal or state regulatory authority may assert that
some services provided by a PBM constitute the practice of medicine or the practice of nursing and are therefore
subject to federal and state laws and regulations applicable to the practice of medicine and/or the practice of
nursing.

Employees
     As of year-end 2009, we had approximately 21,900 full-time employees and approximately 950 part-time
employees, for a total of 22,850 employees worldwide. Approximately 30% of these employees are represented by
labor organizations. Approximately 24% of employees are subject to the terms of 13 collective bargaining agreements,
each of which has separate expiration dates and terms, with the United Steel, Paper and Forestry, Rubber,
Manufacturing, Energy, Allied Industrial & Service Workers International Union, AFL-CIO (American Federation of
Labor — Congress of Industrial Organizations) (USW); approximately 1.5% are represented by the independent union,
Association of Managed Care Pharmacists (AMCP); 0.5% are represented by the Guild For Professional Pharmacists;
0.5% are represented by the International Union of Operating Engineers, AFL-CIO (IUOE); and 3.5% are represented
by the Retail, Wholesale and Department Store Union, United Food and Commercial Workers (RWDSU, UFCW).
Collective bargaining agreements covering these employees expire at various dates through December 2013. Six
collective bargaining agreements with various labor organizations will expire during 2010. We consider our relations
with our employees and their unions to be good. Accredo, Critical Care and PolyMedica employees are not represented
by a labor union. Employees of our majority-owned subsidiary, Europa Apotheek based in the Netherlands, are covered
by a Works Council.


                                                           19
Available Information
     Medco files annual, quarterly and current reports, proxy and information statements and other information with
the United States Securities and Exchange Commission (“SEC”). You may read and copy any document Medco files
with the SEC at the SEC’s Public Reference Room at 100 F Street, N.E. Washington, DC 20549. You may obtain
information regarding the operation of the Public Reference Room by calling the SEC at 1-800-SEC-0330.
      The SEC maintains an Internet site that contains annual, quarterly and current reports, proxy and information
statements and other information regarding issuers that file electronically with the SEC. Medco’s electronic SEC
filings are available to the public at http://www.sec.gov.
    Medco’s SEC filings are also available to the public through The New York Stock Exchange (“NYSE”),
20 Broad Street, New York, New York 10005. Medco’s common stock is listed on the NYSE and trades under the
symbol “MHS.”
      Medco’s public Internet site is http://www.medcohealth.com. Medco makes available free of charge, through
the Investor Relations page of its Internet site at http://www.medcohealth.com/investor, its annual reports on
Form 10-K, quarterly reports on Form 10-Q, current reports on Form 8-K and amendments to those reports filed or
furnished pursuant to Section 13(a) or 15(d) of the Securities Exchange Act of 1934, as amended (the “Exchange
Act”), as soon as reasonably practicable after it electronically files such material with, or furnishes it to, the SEC.
Medco also makes available, through the Investor Relations page of its Internet site, statements of beneficial
ownership of Medco’s equity securities filed by its directors, officers, 10% or greater shareholders and others under
Section 16 of the Exchange Act. In addition, Medco makes available on the Investor Relations page of its Internet
site, its most recent proxy statements and its most recent annual reports to stockholders. Medco uses the Investor
Relations page of its Internet site at http://www.medcohealth.com/investor to disclose important information to the
public.
     Information contained on Medco’s Internet site, or that can be accessed through its Internet site, does not
constitute a part of this Annual Report on Form 10-K. Medco has included its Internet site address only as an
inactive textual reference and does not intend it to be an active link to its Internet site. Our corporate headquarters
are located at 100 Parsons Pond Drive, Franklin Lakes, New Jersey 07417 and the telephone number at this location
is (201) 269-3400.

Stock Split
     In the first quarter of 2008, we completed a two-for-one stock split, which was effected in the form of a 100%
stock dividend and distributed on January 24, 2008, to shareholders of record at the close of business on January 10,
2008. All share and per share amounts have been adjusted for the increase in issued and outstanding shares after
giving effect to the stock split. For more information, see Note 1, “Background and Basis of Presentation,” to our
audited consolidated financial statements included in Part II, Item 8 of this Annual Report on Form 10-K.

Corporate History
     Medco was originally incorporated in Delaware in June 1983. Medco became an independent publicly traded
enterprise on August 19, 2003.


                                                           20
Item 1A. Risk Factors.
    The risks described below are not the only ones facing us. Additional risks not currently known to us or that
we currently believe are immaterial also may impair our business operations, financial condition, and liquidity.

  Competition in the PBM, specialty pharmacy and the broader healthcare industry is intense and could impair
  our ability to attract and retain clients.
     Competition among providers of PBM services is intense. We compete with a wide variety of market
participants, including national, regional and local PBMs, Blue Cross/Blue Shield plans, insurance companies,
managed care organizations, large retail chains, large retail stores and supermarkets with in-store pharmacy
operations and Internet pharmacies. Our competitors include many profitable and well-established companies that
have significant financial, marketing and other resources. Some of our specialty pharmacy and clinical service
offerings compete with similar services provided by smaller companies in niche markets. Our main competitors
include Aetna Inc., CIGNA Corporation, CVS Caremark Corporation, Express Scripts, Inc., Humana Inc.,
UnitedHealth Group Incorporated (“United Health Group”), Walgreen Co. and Wal-Mart Stores, Inc.
     We compete based on innovation and service, as well as on price. To attract new clients and retain existing
clients, we must continually develop new products and services to assist clients in managing their pharmacy benefit
programs. There is no guarantee that the investments we make will result in innovative products and services that
are attractive to clients, or that we will be able to execute on our strategy for such products and services. Moreover,
although we need to continue to expend significant resources to develop, acquire and implement new products and
services in the future, we may not be able to do so. We cannot be sure we will continue to remain competitive, nor
can we be sure that we will be able to market our PBM services to clients successfully at our current levels of
profitability.
     Part of our ability to remain profitably competitive in winning and retaining business relies on our securing
competitive retail pharmacy reimbursement rates, and decreased competition among retail pharmacies may impact
our ability to achieve competitive rates from retail pharmacies.
    Consolidation of client entities within the markets we serve, as well as the consolidation of our competitors, or
suppliers could impair our ability to attract and retain clients.

  Failure to retain key clients and their members, either as a result of economic conditions, increased competition
  or other factors, could result in significantly decreased revenues, harm to our reputation and decreased
  profitability.
     Our largest client, UnitedHealth Group, represented approximately $11,300 million, or 19%, of our net revenues
during 2009. Under our current agreement with UnitedHealth Group, we are providing pharmacy benefit services
through December 31, 2012. Although none of our other clients individually represented more than 10% of our net
revenues in 2009, our top 10 clients as of December 26, 2009, including UnitedHealth Group, represented
approximately 49% of our net revenues during 2009. The loss of one or more of these clients could lead to a
negative reaction in the investment community or otherwise cause harm to our reputation, resulting in stock price
declines or other adverse effects.
     If several of our large clients terminate, cancel or do not renew their agreements with us or stop contracting
with us for some of the services we provide because they accept a competing proposal or because they are involved
in a merger or acquisition, and we are not successful in generating new sales with comparable operating margins to
replace the lost business, our revenues and results of operations could suffer.
     In addition, although we believe our current liquidity and prospects for strong cash flows from operations limit
the effects on our business from the weaker economy, our business may not be immune to the general risks and
uncertainties affecting many other companies, such as overall U.S. and non-U.S. economic and industry conditions,
global economic slowdown or geopolitical events. Our revenues and results of operations could suffer, for example,
if employers drop healthcare coverage for some or all of their employees, including retirees, as a result of weakness
in the economy, changes in law, or rising costs.


                                                          21
Government efforts to reduce healthcare costs and alter healthcare financing practices could lead to a
  decreased demand for our services or to reduced profitability.
     During the past several years, the U.S. healthcare industry has been subject to an increase in governmental
regulation at both the federal and state levels. Efforts to control healthcare costs, including prescription drug costs,
are underway at the federal and state government levels. Congress frequently considers proposals that can affect the
U.S. healthcare system. These proposals may increase governmental involvement in healthcare and PBM services
and may otherwise change the way we and our clients conduct business. For example, if passed, proposed healthcare
reform legislation could make the value of the federal Retiree Drug Subsidy less valuable to our clients. As a result,
our clients may choose to drop or limit retiree prescription drug coverage. Further, healthcare organizations may
react to government healthcare reform proposals and the uncertainty surrounding them by reducing or delaying the
purchase of our PBM services. We cannot accurately predict the impact of proposed healthcare reform legislation,
but these proposals could lead to a decreased demand for our services and other outcomes that could adversely
impact our business and financial results.
     In addition, federal and several state-government entities are expected to consider legislation to increase
regulation of managed care plans and decrease reimbursement of Medicare managed care and fee-for-service plans
and Medicaid fee-for-service programs. Some of these initiatives would, among other things, require that health plan
members have greater access to drugs not included on a plan’s formulary and in some instances give health plan
members the right to sue their health plans for malpractice when they have been denied care. The scope of the
reform proposals under consideration by Congress and state legislatures and enacted by states to date vary greatly,
and we cannot predict the extent of future legislation. However, these initiatives could limit our business practices
and impair our ability to serve our clients.

  Failure in continued execution of our retiree strategy, including the potential loss of Medicare Part D-eligible
  members, could adversely impact our business and financial results.
     Our retiree strategy is multi-faceted and includes the provision of products and services in support of our
clients’ Medicare Part D plans or federal Retiree Drug Subsidy. In addition, our strategy includes managing the
potential loss of Medicare-eligible members covered under our programs with our PBM clients. Lastly, we
participate in the Medicare Part D benefit with our own PDP. We have made substantial investments in the personnel
and technology necessary to administer our retiree strategy.
     In time, the Medicare Part D prescription benefit could have the effect of rendering existing prescription drug
benefit plans less valuable to our clients and their members, which would reduce the total market for PBM services.
In addition, some of our clients could decide to discontinue providing traditional prescription drug benefits to their
Medicare-eligible members. If this occurs, the adverse effects of the loss of these members may outweigh any
opportunities for new business generated by the Medicare Part D benefit through our clients’ Medicare Part D plans
and our own PDP. Because of this uncertainty, we cannot accurately predict the long-term impact of these risks on
our business, financial condition or results of operations.
    Additionally, we have various contractual and regulatory compliance requirements associated with participating
in Medicare Part D. Similar to our requirements with other clients, our policies and practices associated with
executing our PDP are subject to audit. If material contractual or regulatory non-compliance was to be identified,
monetary penalties and/or applicable sanctions, including suspension of enrollment and marketing or debarment
from participation in Medicare programs, may be imposed.
     Like many aspects of our business, the administration of the Medicare Part D program is complex. Any failure
to execute the provisions of the Medicare Part D program, as well as our overall retiree strategy may have an
adverse effect on our financial position, results of operations or cash flows. Proposed healthcare reform legislation,
if passed, could also have a financial impact on our CMS-approved PDP. For a description of this risk, see
“—Government efforts to reduce healthcare costs and alter healthcare financing practices could lead to a decreased
demand for our services or to reduced profitability.”


                                                          22
If we fail to comply with complex and evolving laws and regulations domestically and internationally, we could
  suffer penalties, be required to pay substantial damages and/or make significant changes to our operations.
     We are subject to numerous federal and state regulations. If we fail to comply with existing or future applicable
laws and regulations, we could suffer civil or criminal penalties, including the loss of our licenses to operate our
mail-order pharmacies, and our ability to participate in federal and state healthcare programs. As a consequence of
the severe penalties we may face, we must devote significant operational and managerial resources to comply with
these laws and regulations. Although we believe we are substantially compliant with all existing statutes and
regulations applicable to our business, different interpretations and enforcement policies related to these laws and
regulations could subject our current practices to allegations of impropriety or illegality, or require us to make
significant changes to our operations. In addition, we cannot predict the impact of future legislation and regulatory
changes on our business or ensure we will be able to obtain or maintain the regulatory approvals required to operate
our business. Our international business is also susceptible to a changing political and regulatory landscape. Changes
in laws or interpretations in countries in which we operate may impair our ability to serve these customers and
adversely impact the financial condition, liquidity and operating results of our international operations.

  If we do not continue to earn and retain purchase discounts, rebates and service fees from manufacturers at
  current levels, our gross margins may decline.
      We have contractual relationships with pharmaceutical manufacturers and wholesalers providing us with
purchase discounts on drugs dispensed from our mail-order pharmacies, and service fees for activities performed for
certain specialty products and, in the case of many pharmaceutical manufacturers, rebates on specified brand-name
prescription drugs dispensed through mail order and retail. Most of these discounts and rebates are generally passed
on to clients in the form of steeper price discounts and rebate pass-backs. Manufacturer rebates often depend on our
ability to meet contractual market share or other requirements.
     Our clients often have contractual rights relating to their formulary structure, and while our programs aim to
maximize savings to clients, clients are often making specific choices regarding which drugs to place on their
formularies. Our profitability can be impacted by these client decisions. In addition, the pharmaceutical industry
(both manufacturers of brand-name drugs, as well as generic drugs) continues to consolidate and this may impact
our drug purchasing costs and our profitability.
      Changes in existing federal or state laws or regulations or in their interpretation by courts and agencies or the
adoption of new laws or regulations relating to patent term extensions, purchase discount and rebate arrangements
with pharmaceutical manufacturers, as well as some of the formulary and other services we provide to pharmaceu-
tical manufacturers, could also reduce the discounts or rebates we receive and adversely impact our business,
financial condition, liquidity and operating results.

  From time to time we engage in transactions to acquire other companies or businesses and if we are unable to
  effectively integrate acquired businesses into ours, our operating results may be adversely affected. Even if we
  are successful, the integration of these businesses has required, and will likely continue to require, significant
  resources and management attention.
      From time to time we engage in transactions to acquire or otherwise align with other companies or businesses.
In order to realize the intended benefits of both past and future transactions, we must effectively integrate these
business activities into ours. If we fail to successfully integrate these business activities or if they fail to perform as
we anticipated, our revenue and operating results could be adversely affected. If the due diligence of the operations
of these acquired businesses performed by us or by third parties on our behalf were inadequate or flawed, or if we
later discover unforeseen financial or business liabilities, the acquired businesses may not perform as expected.
Operating costs, customer loss and business disruption (including difficulties in maintaining relationships with
employees, customers, clients or suppliers) may be greater than we anticipated. Finally, difficulties assimilating
acquired operations and products could result in the diversion of capital and management’s attention away from
other business issues and opportunities. International operations are also subject to additional risks, which could
include variation in local economies, export and import restrictions, currency fluctuations, trade barriers, the burden
of complying with a variety of international laws, and political and economic instability.


                                                            23
New legislative or regulatory initiatives that restrict or prohibit the PBM industry’s ability to use patient
  identifiable information could limit our ability to use information critical to the operation of our business.
     Many of our products and services rely on our ability to use patient identifiable information. In addition to
electronically reviewing hundreds of millions of prescriptions each year, we collect and process confidential
information through many of our programs and alliances, including RationalMed» and point-of-care initiatives.
There is currently substantial regulation at the federal and state levels addressing the use and disclosure of patient
identifiable medical and other information. In February 2009, the American Recovery and Reinvestment Act of 2009
(P.L. 111-16) was signed into law, which adds additional requirements under the HIPAA privacy and security rules.
Failure to comply with standards issued pursuant to state or federal statutes or regulations may result in criminal
penalties and civil sanctions. See Item 1, “Business — Government Regulation,” above. These and future regulations
and legislation severely restricting or prohibiting our use of patient identifiable medical and other information could
limit our ability to use information critical to the operation of our business. If we violate a patient’s privacy or are
found to have violated any state or federal statute or regulation with regard to the confidentiality, dissemination or
use of patient medical information, we could be liable for significant damages, fines or penalties.

  Our Specialty Pharmacy business is highly dependent on our relationships with a limited number of suppliers
  and the loss of any of these relationships, or limitations on our ability to provide services to these suppliers,
  could significantly impact our ability to sustain and/or improve our financial performance.
      We derive a substantial percentage of our Specialty Pharmacy segment revenue and profitability from our
relationships with a limited number of suppliers. Our agreements with these suppliers may be short-term and
cancelable by either party without cause on 30 to 365 days prior notice. These agreements may limit our ability to
provide services for competing drugs during the term of the agreement and allow the supplier to distribute through
channels other than us. Further, certain of these agreements allow pricing and other terms of these relationships to
be periodically adjusted for changing market conditions or required service levels. A termination or modification to
any of these relationships could have a material adverse effect on our business, financial condition and results of
operations.

  Our ability to grow our Specialty Pharmacy business could be limited if we do not expand our existing base of
  drugs or if we lose patients.
     Our Specialty Pharmacy segment focuses on complex and expensive drugs that serve relatively small patient
populations. Due to the limited patient populations utilizing the drugs our Specialty Pharmacy business handles, our
future growth relies in part on expanding our base of drugs or penetration in drug categories, such as oncology.
Further, a loss of patient base or reduction in demand for any reason for the drugs we currently dispense could have
a material adverse effect on our business, financial condition and results of operations.

  Our Specialty Pharmacy business, certain revenues from diabetes testing supplies and our Medicare Part D
  offerings expose us to increased credit risk. Additionally, current economic conditions may expose us to
  increased credit risk.
     A portion of our Specialty Pharmacy business is funded through medical benefit coverage, the majority of
which is provided by private insurers, as well as reimbursement by government agencies. These Specialty Pharmacy
claims are generally for very high-priced medicines, and collection of payments from insurance companies, patients
and other payors generally takes substantially longer than for those claims administered through a PBM benefit.
Because of the high cost of these claims, and the nature of the medical benefit coverage determination process,
these accounts receivable are characterized by higher risk in collecting the full amounts due.


                                                          24
Revenues from the sale of diabetes testing supplies under the Liberty brand depend on the continued availability
of reimbursement by government and private insurance plans. The government’s Medicare regulations are complex
and, as a result, the collection process is time-consuming and typically involves the submission of claims to multiple
payors whose payment of claims may be contingent upon the payment of another payor. Because of the coordination
with multiple payors and the complexity in determining reimbursable amounts, these accounts receivable have
higher risk in collecting the full amounts due.
      Our Medicare Part D product offerings require premium payments from members for the ongoing benefit, as
well as amounts due from CMS. As a result of the demographics of the consumers covered under these programs
and the complexity of the calculations for amounts due from CMS, these accounts receivable are subject to
realization risk in excess of what is experienced in the core PBM business.
    Additionally, we may be subject to increased credit risk associated with state and local government agencies
experiencing increased fiscal challenges. As a result of these aforementioned risks, we may be required to record
bad debt expenses potentially impacting our results of operations and liquidity.

  Changes in reimbursement rates, including competitive bidding for durable medical equipment suppliers, could
  negatively affect our revenues and profits.
     A portion of our Accredo Health Group revenues and the majority of our PolyMedica Corporation
(“PolyMedica”) revenues are tied to the continued availability of reimbursement by government and private
insurance plans. Any reduction in Medicare or other government program or private plan reimbursements currently
available for our products would reduce our revenues. Without a corresponding reduction in the cost of such
products, our profits would also be reduced. Additionally, our profits could be affected by the imposition of more
stringent regulatory requirements for Medicare or other government program reimbursement or adjustments to
previously reimbursed amounts, and due to potential budget limitations being experienced by many states, we could
experience reductions in our Medicaid reimbursement for certain drugs dispensed by our specialty pharmacies under
our Accredo brand.
     Specifically in regard to our revenues and profits associated with our diabetes testing supplies business, the
Durable Medical Equipment, Prosthetics, Orthotics and Supplies (DMEPOS) Competitive Bid Program (the
“Program”) provides for a phased-in program for competitive bidding of certain durable medical equipment items,
including mail-order diabetes testing supplies. The first round of bidding under the Program was delayed in 2007,
which resulted in a 9.5% reimbursement rate reduction for the Program product categories effective January 1, 2009
and also provided for no annual payment updates for 2009. The Program was re-initiated effective October 21, 2009
and the first round of bidding closed on December 21, 2009. Winning bids along with the applicable reimbursement
rates are anticipated to be announced during the summer of 2010, with new reimbursement rates becoming effective
in January 2011 for a limited number of geographic areas.
     Moreover, Congressional action has provided CMS with additional authority to use pricing information gathered
during the Program for purposes of establishing reimbursement rates in geographic areas not subject to competitive
bidding. Our operating results could be negatively affected if CMS uses this authority to impose lower reimburse-
ment rates in geographic areas that would otherwise have been excluded from the impact of competitive bidding.

  Prescription volumes may decline, and our net revenues and profitability may be negatively impacted, if the
  safety risk profiles of drugs increase or if drugs are withdrawn from the market, including as a result of
  manufacturing issues, or if prescription drugs transition to over-the-counter products.
     We dispense significant volumes of brand-name and generic drugs from our mail-order pharmacies and through
networks of retail pharmacies, which are the basis for our net revenues and profitability. When increased safety risk
profiles or manufacturing issues of specific drugs or classes of drugs result in utilization decreases, physicians may
cease writing or otherwise reduce the numbers of prescriptions for these drugs. Additionally, negative press
regarding drugs with higher safety risk profiles may result in reduced global consumer demand for such drugs. On
occasion, products are withdrawn by their manufacturers or transition to over-the-counter products. In cases where
there are no acceptable prescription drug equivalents or alternatives for these prescription drugs, or for
over-the-counter products that are not recaptured in the Medco Health StoreTM, our volumes, net revenues,
profitability and cash flows may decline.


                                                          25
PBMs could be subject to claims under ERISA if they are found to be a fiduciary of a health benefit plan
  governed by ERISA.
     PBMs typically provide services to corporations and other sponsors of health benefit plans subject to the
Employee Retirement Income Security Act of 1974 (“ERISA”). ERISA regulates employee pension benefit plans
and employee welfare benefit plans, including health and medical plans. The U.S. Department of Labor (“DOL”),
which is the agency that enforces ERISA, could assert that the fiduciary obligations imposed by the statute apply to
some or all of the services provided by a PBM where the PBM had not agreed to accept fiduciary responsibility. We
are party to several lawsuits which claim we are a fiduciary under ERISA. See Note 14, “Commitments and
Contingencies—Legal Proceedings,” to our audited consolidated financial statements included in Part II, Item 8 of
this Annual Report on Form 10-K. If a court were to determine, in litigation brought by a private party or in a
proceeding arising out of a position taken by the DOL, that we were a fiduciary in connection with services for
which we had not agreed to accept fiduciary responsibility, we could potentially be subject to claims for breaching
fiduciary duties and/or entering into certain “prohibited transactions” that could have a material adverse effect on
our business, financial condition, liquidity and results of operations.

  Pending litigation could adversely impact our business practices and have a material adverse effect on our
  business, financial condition, liquidity and operating results.
     We are party to various legal proceedings and are subject to litigation risks. The most significant legal
proceedings to which Medco is a party are described in detail in Note 14, “Commitments and Contingencies—Legal
Proceedings,” to our audited consolidated financial statements included in Part II, Item 8 of this Annual Report on
Form 10-K. Although we believe we have meritorious defenses in each of the matters described therein, we could in
the future incur judgments or enter into settlements of claims that could have a material adverse effect on our
business, financial condition, liquidity and results of operations in any particular period.

  Changes in industry pricing benchmarks could adversely affect our financial performance.
     Contracts in the prescription drug industry generally use certain published benchmarks to establish pricing for
prescription drugs. Most of Medco’s PBM client contracts and Accredo and PolyMedica’s commercial contracts and
most of its governmental participating provider agreements use the Average Wholesale Price, or AWP, standard.
Recently, First DataBank, the company that reports AWP data to Medco, announced it would discontinue publishing
AWP some time in 2011. Currently, we do not know what other pricing benchmark(s) will be adopted. Medco’s
customer contracts contain terms Medco believes will enable it to mitigate any adverse effects resulting from a
change in the pricing benchmark.
     Legislation may lead to changes in the pricing for Medicare and Medicaid programs. See Item 1, “Business—
Government Regulation—Legislation and Regulation Affecting Drug Prices and Potentially Affecting the Market for
Prescription Benefit Plans and Reimbursement for Durable Medical Equipment,” included in this Annual Report on
Form 10-K. At least one Medicaid program has adopted, and other Medicaid programs, some states and some
commercial payors may adopt, those aspects of the Medicare Prescription Drug, Improvement and Modernization
Act of 2003 (P.L. 108-173) or the Deficit Reduction Act of 2005 (P.L. 109-171) that either result in or appear to
result in price reductions for drugs covered by such programs. Adoption of Average Sales Price (“ASP”) or Average
Manufacturer’s Price (“AMP”) in lieu of AWP as the measure for determining reimbursement by state Medicaid
programs for the drugs sold in our Specialty Pharmacy business could materially reduce the revenue and gross
margins of this business.


                                                         26
We are subject to a corporate integrity agreement and noncompliance may impede our ability to conduct
  business with the federal government.
     As part of a civil settlement with the Department of Justice (“DOJ”) and other federal government agencies, in
October 2006, Medco entered into a five-year corporate integrity agreement with the United States Department of
Health and Human Services’ Office of the Inspector General (“OIG”) and the U.S. Office of Personnel Management
Office of the Inspector General. The agreement is designed to ensure that Medco’s compliance program meets
certain requirements. The agreement provides for, among other things, that Medco continue to have a Compliance
Officer, a Compliance Committee, a Code of Conduct that is disseminated to employees, a toll-free number for
employees to report potential violations of Covered Federal Program requirements, written policies and procedures
(including the establishment of new databases), regular training for all employees with regard to Medco’s Code of
Conduct, and various auditing programs. Failure to comply with the obligations of this corporate integrity agreement
could result in debarment from participation in certain federal business arrangements, financial penalties and damage
to Medco’s reputation.

  The terms and covenants relating to our existing indebtedness could adversely impact our financial
  performance and liquidity.
     Like other companies that incur debt, we are subject to risks normally associated with debt financing, such as
the insufficiency of cash flow to meet required debt service payment obligations and the inability to refinance
existing indebtedness. Our credit facilities, accounts receivable financing facility and the indentures governing our
senior notes contain customary restrictions, requirements and other limitations on our ability to incur indebtedness,
including a maximum total debt-to-EBITDA ratio. Our continued ability to borrow under our credit facilities and
accounts receivable financing facility is subject to our compliance with such financial and other covenants. If we fail
to satisfy these covenants, we would be in default under the credit facilities, accounts receivable financing facility
and/or indentures, and may be required to repay such debt with capital from other sources or not be able to draw
down against our facility. Under such circumstances, other sources of capital may not be available to us, or be
available only on unattractive terms. See Note 8, “Debt,” to our audited consolidated financial statements included
in Part II, Item 8 of this Annual Report on Form 10-K.
     In addition, as of December 26, 2009, of our total outstanding borrowings of approximately $4.0 billion,
$2.2 billion is impacted by variable interest rates. Increases in interest rates on variable rate indebtedness would
increase our interest expense and could adversely affect our results of operations.

  We may be subject to liability claims for damages and other expenses not covered by insurance.
     Our commercial professional liability insurance policies are expected to cover up to $85 million per individual
claim. In addition to our commercial professional liability insurance policies, we have a retained liability component
requiring certain self-insurance reserves to cover potential claims. We currently process any claims included in self-
insured retention levels through a captive insurance company. A successful professional liability claim in excess of
our insurance coverage, or one for which an exclusion from coverage applies, could have a material adverse effect
on our financial condition and results of operations. We believe most of the claims described in Note 14,
“Commitments and Contingencies—Legal Proceedings,” to our audited consolidated financial statements included in
Part II, Item 8 of this Annual Report on Form 10-K, are unlikely to be covered by insurance.

  The success of our business depends on maintaining a well-secured pharmacy operation and technology
  infrastructure. Additionally, significant disruptions to our infrastructure or any of our facilities due to failure
  to execute security measures or failure to execute business continuity plans in the event of an epidemic or
  pandemic or some other catastrophic event could adversely impact our business.
     We are dependent on our infrastructure, including our information systems, for many aspects of our business
operations. A fundamental requirement for our business is the secure storage and transmission of personal health
information and other confidential data and we must maintain our business processes and information systems, and
the integrity of our confidential information. Although we have developed systems and processes that are designed
to protect information against security breaches, failure to protect such information or mitigate any such breaches
may adversely affect our operations. In the event we or our vendors experience malfunctions in business processes,
breaches of information systems, failure to maintain effective and up-to-date information systems or unauthorized
and non-compliant actions by any individual, this could disrupt our business operations or impact patient safety,
result in customer and member disputes, damage our reputation, expose us to risk of loss or litigation, regulatory
violations, increase administrative expenses or lead to other adverse consequences.


                                                           27
We have automated and other mail-order dispensing pharmacies, call centers, data centers and corporate
facilities. All of these facilities depend on the local infrastructure and the uninterrupted operation of our
computerized dispensing systems and our electronic data processing systems. Significant disruptions at any of these
facilities or our vendors’ facilities due to failure of technology or any other failure or disruption to these systems or
to the infrastructure due to fire, electrical outage, natural disaster, acts of terrorism or malice, an epidemic or
pandemic or some other catastrophic event could, temporarily or indefinitely, significantly reduce, or partially or
totally eliminate, our ability to process and dispense prescriptions and provide products and services to our clients
and members.

  We may be required to record a material non-cash charge to income if our recorded intangible assets or
  goodwill are impaired, or if we shorten intangible asset useful lives.
     We have over $2.4 billion of recorded intangible assets, net, on our consolidated balance sheet as of
December 26, 2009. For our PBM segment, our intangible assets primarily represent the value of client relationships
that had been pushed down to our consolidated balance sheets and existed when we became an independent,
publicly traded enterprise in 2003, and to a lesser extent, our acquisitions of PolyMedica in 2007 and a majority
stake in Europa Apotheek Venlo B.V. in 2008. For our Specialty Pharmacy segment, we have intangible assets
recorded primarily from our acquisition of Accredo in 2005. Under current accounting rules, intangible assets are
amortized over their useful lives. These assets may become impaired with events such as the loss of significant
clients or specialty product manufacturer contracts, or when other changes in circumstances indicate the carrying
amount may not be recoverable. For our intangible assets, if the carrying amount of the assets exceeds the
undiscounted pre-tax expected future cash flows from the lowest appropriate asset grouping, we would be required
to record a non-cash impairment charge to our consolidated statement of income in the amount the carrying value of
these assets exceeds the discounted expected future cash flows. In addition, while our intangible assets may not be
impaired, the useful lives are subject to continual assessment. This assessment may result in a reduction of the
remaining weighted average useful life of these assets, resulting in potentially significant increases to non-cash
amortization expense charged to our consolidated statement of income, which could have a material adverse effect
on our earnings.
      We also have over $6.3 billion of recorded goodwill on our consolidated balance sheet as of December 26,
2009. Goodwill is assessed for impairment annually for each of our segments’ reporting units. This assessment
includes comparing the fair value of each reporting unit to the carrying value of the assets assigned to that reporting
unit. If the carrying value of the reporting unit were to exceed our estimate of fair value of the reporting unit, we
would then be required to estimate the fair value of the individual assets and liabilities within the reporting unit to
ascertain the fair value of goodwill. If we determine that the fair value is less than our book value, we could be
required to record a non-cash impairment charge to our consolidated statement of income, which could have a
material adverse effect on our earnings.

  Anti-takeover provisions of the Delaware General Corporation Law (“DGCL”), our certificate of incorporation
  and our bylaws could delay or deter a change in control and make it more difficult to remove incumbent
  officers and directors.
     Our certificate of incorporation and bylaws and various provisions of the DGCL may make it more difficult to
effect a change of control of our company or remove incumbent officers and directors. The existence of these
provisions may adversely affect the price of our common stock, discourage third parties from making a bid to
acquire our company or reduce any premium paid to our shareholders for their common stock. Our Board of
Directors has authority to issue up to 10,000,000 shares of “blank check” preferred stock and to attach special rights
and preferences to this preferred stock. The issuance of this preferred stock may make it more difficult for a third
party to acquire control of us.


                                                           28
Moreover, as a result of our ownership of insurance companies, a third party attempting to effect a change of
control of our company may be required to obtain approval from the applicable state insurance regulatory officials.
The need for this approval may discourage third parties from making a bid for our company or make it more
difficult for a third party to acquire our company, which may adversely affect the price of our common stock.

Item 1B. Unresolved Staff Comments.
       None.

Item 2.        Properties.
      As of December 26, 2009, we own or lease 150 facilities throughout the United States and lease two properties
in Europe. We believe our facilities are well-maintained and in good operating condition and have adequate capacity
to meet our current business needs. Our existing facilities contain an aggregate of approximately 3,900,000 square
feet. Our corporate headquarters office is located in Franklin Lakes, New Jersey and accommodates our executive
and corporate functions.
     Our PBM mail-order pharmacy operations consist of seven prescription order processing pharmacies that are
located throughout the United States, one of which also performs mail-order dispensing, and our two automated
dispensing pharmacies in Willingboro, New Jersey and Las Vegas, Nevada. Additionally, we expect to commence
operations in our third automated dispensing pharmacy in Whitestown, Indiana in 2010. In addition, as a result of
our PolyMedica acquisition, we have two pharmacies that dispense diabetes supplies. We also have three Specialty
Pharmacy mail-order pharmacies and 78 specialty branch pharmacies.

Item 3.        Legal Proceedings.
     In the ordinary course of business, the Company is involved in litigation, claims, government inquiries,
investigations, charges and proceedings, including, but not limited to, those relating to regulatory, commercial,
employment, employee benefits and securities matters. Descriptions of certain legal proceedings to which the
Company is a party are contained in Note 14, “Commitments and Contingencies — Legal Proceedings,” to our
audited consolidated financial statements included in Part II, Item 8 of this Annual Report on Form 10-K and are
incorporated by reference herein.

Item 4.        Submission of Matters to a Vote of Security Holders.
       Not applicable.

Executive Officers of the Company
       The executive officers of the Company, and their ages and positions as of February 1, 2010 are as follows:
Name                                                                   Age                           Position

David B. Snow, Jr. . . . . . . . . . . . . . . . . . . . . . . . . . . 55     Chairman and Chief Executive Officer
Gabriel R. Cappucci . . . . . . . . . . . . . . . . . . . . . . . . . 47      Senior Vice President and Controller, Chief
                                                                              Accounting Officer
Mary T. Daschner . . . . . . . . . . . . . . . . . . . . . . . . . . . 51     Group President, Retiree Solutions
John P. Driscoll . . . . . . . . . . . . . . . . . . . . . . . . . . . . 50   President, New Markets
Robert S. Epstein . . . . . . . . . . . . . . . . . . . . . . . . . . . 54    Chief Medical Officer and President, Medco
                                                                              Research Institute
Steven R. Fitzpatrick . . . . .      ...................               50     President, Accredo Health Group, Inc.
Brian T. Griffin . . . . . . . . .   ...................               50     Group President, Health Plans
Kenneth O. Klepper . . . . . .       ...................               56     President and Chief Operating Officer
Laizer D. Kornwasser . . . . .       ...................               38     President, Liberty Medical and Senior Vice President,
                                                                              Channel and Generic Strategy
Thomas M. Moriarty. . . . . . . . . . . . . . . . . . . . . . . . . 46        General Counsel, Secretary and Senior Vice
                                                                              President, Pharmaceutical Strategies and Solutions
Karin V. Princivalle . . . . . . . . . . . . . . . . . . . . . . . . . 53     Senior Vice President, Human Resources
Richard J. Rubino . . . . . . . . . . . . . . . . . . . . . . . . . . . 52    Senior Vice President, Finance and Chief Financial
                                                                              Officer
Jack A. Smith. . . . . . . . . . . . . . . . . . . . . . . . . . . . . . 62   Senior Vice President, Chief Marketing Officer
Glenn C. Taylor . . . . . . . . . . . . . . . . . . . . . . . . . . . . 58    Group President, Key Accounts
Timothy C. Wentworth . . . . . . . . . . . . . . . . . . . . . . . 49         Group President, Employer Accounts


                                                                         29
David B. Snow, Jr. has served as Chief Executive Officer and as a director of the Company since March 2003.
Mr. Snow was appointed Chairman of the Company’s Board of Directors in June 2003 and also served as the
Company’s President from 2003 to 2006. Prior to joining the Company, Mr. Snow served as President and Chief
Operating Officer at WellChoice, Inc. (formerly Empire BlueCross BlueShield) where he held the position of
Executive Vice President and Chief Operating Officer beginning in 1999 and then held the position of President and
Chief Operating Officer from 2001 through 2003. From 1993 to 1998, Mr. Snow was an Executive Vice President of
Oxford Health Plans, a health maintenance organization, and was responsible for marketing, medical delivery
systems, medical management and government programs. Mr. Snow has served in executive leadership roles for a
number of other healthcare companies throughout his career, including American International Healthcare, Inc. and
US HealthCare, Inc. He also co-founded and served as President and CEO of Managed Healthcare Systems, Inc.,
which was later renamed AmeriChoice. Mr. Snow is currently a director of Pitney Bowes Inc. (Compensation
Committee; Technology Committee). Mr. Snow is also a director of various private companies and not-for-profit
charitable organizations.
      Gabriel R. Cappucci has served as Medco’s Senior Vice President and Controller, Chief Accounting Officer
since March 2008, and is directly responsible for accounting and financial reporting, financial systems, and client
rebate and performance guarantee reporting and analysis. Mr. Cappucci joined Medco in July 1993 and has held a
variety of accounting, financial reporting, and financial planning roles. Most recently, since June 2004, Mr. Cappucci
was Vice President, Financial Reporting with responsibility for Medco’s financial reporting and accounting
standards. Prior to joining the Company, Mr. Cappucci was a Senior Manager with KPMG LLP where he had been
employed since August 1985. Mr. Cappucci is a Certified Public Accountant and a member of the American
Institute of Certified Public Accountants.
     Mary T. Daschner has served as Group President, Retiree Solutions since September 2008 and in this role is
responsible for strategy and business results for Medco’s retiree and Medicare eligible population. The current
portfolio includes Medco’s National Prescription Drug Program, the Medco Medicare Prescription Plan» and
Employer Retiree Solutions including Employer Prescription Drug Plans, Enhanced Plans, Retiree Drug Subsidy and
secondary wraparound products. Ms. Daschner joined the Company in December 1999, initially serving as Senior
Director of Business and Product Development, and later as Vice President, Health Plans and Government Programs
since 2001, where she managed service and drug trend strategy supporting more than six million UnitedHealth
Group Incorporated (“UnitedHealth Group”) members, including Medicare, Managed Medicaid and commercial
fully insured populations. Ms. Daschner came to the Company from Senior Market Strategies, a healthcare
consulting business focused on reimbursement, outcomes and patient access in the over 50 marketplace, where she
served as President.
     John P. Driscoll has served as President, New Markets since April 2008, and in this role is responsible for the
Company’s consumer-driven programs, insured solutions and business development, both domestically and interna-
tionally. Mr. Driscoll joined the Company in June 2003 as Senior Vice President, Product and Business Development
and served as President, Insured and Emerging Markets from June 2006 to April 2008. Mr. Driscoll came to the
Company from Oak Investment Partners, a venture capital firm, where he served as an advisor on healthcare
investments from January 2002 through May 2003. Mr. Driscoll held the position of Executive Vice President of
Walker Digital from January 2000 to December 2001. Mr. Driscoll served in a number of senior positions at Oxford
Health Plans from 1991 through 1999, including, most recently, as its Corporate Vice President, Government
Programs.


                                                         30
Robert S. Epstein, M.D., M.S. has served as the Company’s Chief Medical Officer since 1997. In this
capacity, he is responsible for formulary development, clinical guidelines, drug information services, accreditation
oversight, and personalized medicine services. He is also responsible for analysis and reporting for Medco’s clients.
In addition, Dr. Epstein has served as President of the Medco Research Institute since December 2009. Dr. Epstein
was trained as an epidemiologist, and worked in public health and academia before joining the private sector. He is
past elected President of the International Society of Pharmacoeconomics and Outcomes Research, and has served
on the Board of Directors for the Drug Information Association. In 2008, Dr. Epstein was nominated and elected to
the Federal CDC EGAPP (Evaluation of Genomic Applications in Practice & Prevention) Stakeholder Committee,
and the AHRQ CERT (Centers for Education and Research on Therapeutics) Committee. He has published more
than 50 peer reviewed medical articles and book chapters, and serves as a reviewer for several influential medical
journals.
     Steven R. Fitzpatrick has served as President, Accredo Health Group, Inc., the Company’s specialty pharmacy
organization since June 2008. Mr. Fitzpatrick became an executive officer of the Company in October 2009.
Mr. Fitzpatrick joined Accredo Health Group, Inc., in 2001 as President of its subsidiary, Sunrise Health
Management, Inc., and was named President of Accredo Therapeutics, Inc., in February 2002. With the acquisition
of Accredo Health Group, Inc., by the Company in August 2005, Mr. Fitzpatrick assumed responsibility for both
Accredo Therapeutics and Accredo Specialty Care Services (formerly Medco Specialty Solutions). In March 2006,
he became Chief Operating Officer of Accredo Health Group, Inc. Prior to joining Accredo, Mr. Fitzpatrick held
senior management positions with Abbott Laboratories, Block Medical, PharmaThera, Inc., and Nations Healthcare.
     Brian T. Griffin has served as the Company’s Group President, Health Plans since January 2004. From January
1999 through December 2003 he served as Senior Vice President, Sales and was responsible for sales on a national
basis. From November 1995 to December 1998, Mr. Griffin led the Insurance Carrier customer group and was
responsible for sales within the Insurance Carrier Blue Cross/Blue Shield and Third-Party Administrator Markets.
Mr. Griffin joined the Company in 1987.
     Kenneth O. Klepper has served as President and Chief Operating Officer since March 2006. He joined the
Company in June 2003 and served as Executive Vice President, Chief Operating Officer from June 2003 through
March 2006. Mr. Klepper oversees the Company’s sales and account groups, the Company’s Retiree Solutions group,
information technology, customer service, pharmacy operations, and Accredo Health Group, Inc., the Company’s
specialty pharmacy organization. Mr. Klepper joined the Company from WellChoice, Inc. where he held the position
of Senior Vice President, Process Champion from March 1995 to August 1999, and then held the position of Senior
Vice President for Systems, Technology and Infrastructure from August 1999 to April 2003.
      Laizer D. Kornwasser has served as President of Liberty Medical since the Company’s acquisition of
PolyMedica Corporation in October 2007. In addition, Mr. Kornwasser has served as Senior Vice President, Channel
and Generic Strategy since August 2006, and oversees the Company’s mail and retail channels and generic strategy.
Mr. Kornwasser is responsible for developing and executing generic strategies and optimizing channel distribution to
significantly reduce client and member pharmacy costs. Mr. Kornwasser joined the Company in August 2003,
initially serving as Vice President of Business Development, and from 2005 as Senior Vice President of Business
Development and Retail Networks. Prior to joining the Company, Mr. Kornwasser was the founder and Managing
Partner of Edgewood Consulting LLC, a turnaround/strategic advisory firm. Mr. Kornwasser is a director of the
National Bank of California.
      Thomas M. Moriarty has served as General Counsel and Secretary since March 2008, and is responsible for
overseeing the Company’s legal affairs. In addition, he has served as Senior Vice President, Pharmaceutical
Strategies and Solutions since September 2007, with responsibility for negotiations with pharmaceutical manufactur-
ers, drug purchasing analysis and consulting with clients on formulary drug lists and plan design. He also served as
Senior Vice President, Business Development responsible for mergers and acquisitions and strategic alliances from
August 2006 until March 2008. Prior to that, he was Deputy General Counsel, Vice President and Managing
Counsel, responsible for mergers and acquisitions and client and commercial contracting from December 2005 until
August 2006. From November 2002 until December 2005, Mr. Moriarty served as Vice President and Counsel,
Client Contracting. Mr. Moriarty joined the Company in June 2000 as Assistant Counsel, Client Contracting. Prior
to joining the Company, Mr. Moriarty served as Assistant General Counsel, Pharma & North America for Merial
Limited (a Merck & Co., Inc. and Sanofi Aventis Company) and as Assistant Counsel for Merck & Co., Inc.


                                                         31
Karin V. Princivalle has served as Senior Vice President, Human Resources since joining the Company in
May 2001, and is responsible for company-wide human resource activities. Ms. Princivalle joined the Company
from TradeOut.com, an online business-to-business marketplace, where she served as Vice President for Human
Resources from February 2000 to May 2001. Previously, she served as Vice President of Human Resources for
Citigroup’s North America bankcards business from May 1998 to August 2000 and Vice President of Human
Resources for Citigroup’s Consumer Businesses in Central/Eastern Europe, Middle East, Africa and Asia from
March 1997 to May 1998.
     Richard J. Rubino has served as Senior Vice President, Finance and Chief Financial Officer since March
2008. Mr. Rubino has oversight responsibility for all financial activities, including accounting, reporting, accounts
receivable and reimbursement activities, treasury, tax, planning, analysis, procurement, audit, investor relations and
financial evaluation. Prior to this position he served as Senior Vice President and Controller, Chief Accounting
Officer since April 2005 and in that role was directly responsible for accounting and financial reporting, financial
systems, and client and pharmaceutical manufacturer accounts receivable. From June 1998 to April 2005, Mr. Rubino
served as Vice President and Controller with responsibility for accounting and financial reporting. His previous roles
with the Company include Vice President, Planning with responsibility for financial, business and strategic planning,
and Director of Planning. Prior to joining the Company, Mr. Rubino held various positions at International Business
Machines Corporation and Price Waterhouse & Co. Mr. Rubino is a Certified Public Accountant and a member of
the American Institute of Certified Public Accountants.
     Jack A. Smith has served as Senior Vice President, Chief Marketing Officer since joining the Company in
June 2003 and is responsible for all branding, corporate and product marketing and communications, medco.com»,
and related creative and production services. Mr. Smith served as the Senior Vice President, Chief Marketing Officer
for WellChoice, Inc. from August 1999 to November 2002, and was the Senior Vice President, Marketing Director
for RR Donnelley & Sons from June 1997 to July 1999. Mr. Smith worked as a consultant for the Gartner Group,
an information and consulting company, during 2003 prior to joining the Company. He has also held marketing
positions at The Readers Digest Association, Inc., Nestle USA and Unilever PLC.
     Glenn C. Taylor has served as Group President, Key Accounts since January 2004. From April 2002 through
December 2003, he served as Senior Vice President, Account Management. Mr. Taylor served as President of the
Company’s UnitedHealth Group Division from February 1999 to April 2002. From April 1997 to January 1999,
Mr. Taylor held positions with Merck & Co., Inc. as Regional Vice President of the Southeast and Central business
groups. From May 1993 to March 1997, Mr. Taylor was the Company’s Senior Vice President of Sales and Account
Management. Mr. Taylor joined the Company in May 1993 as a result of the Company’s acquisition of FlexRx, Inc.,
a pharmacy benefit manager in Pittsburgh, Pennsylvania, where Mr. Taylor was President.
      Timothy C. Wentworth has served as Group President, Employer Accounts since September 2008 and is
responsible for all activities related to Medco’s employer clients including sales, account management, marketing,
clinical and pricing areas. This group integrates the oversight of the National Accounts Group with Systemed. Prior
to this position he served as the President and Chief Executive Officer of Accredo Health Group, Inc. from March
2006 to September 2008. From January 2004 to March 2006, Mr. Wentworth served as the Company’s Group
President, National Accounts. From April 2002 through December 2003, he served as Executive Vice President,
Client Strategy and Service and was responsible for client relationships and developing and implementing strategies
to acquire and renew clients. Mr. Wentworth joined the Company as Senior Vice President, Account Management in
December 1998 from Mary Kay, Inc., where he spent five years, serving initially as Senior Vice President of Human
Resources and subsequently as President-International.


                                                         32
PART II

Item 5.   Market for Registrant’s Common Equity, Related Shareholder Matters and Issuer Purchases of
          Equity Securities.
Market Information
     The principal market for our common stock is the NYSE, where our common stock trades under the ticker
symbol “MHS.” The following table sets forth the range of high and low common stock market prices for fiscal
years 2009 and 2008:
                                                       Fourth Quarter     Third Quarter   Second Quarter   First Quarter
    2009
        High . . . . . . . . . . . . . . . . . .   .       $66.00            $56.82           $48.00          $48.95
        Low. . . . . . . . . . . . . . . . . . .   .       $53.11            $44.53           $37.93          $36.46
    2008
        High . . . . . . . . . . . . . . . . . .   .       $47.85            $51.15           $52.00          $54.63
        Low. . . . . . . . . . . . . . . . . . .   .       $29.80            $43.89           $42.85          $40.50
    On February 17, 2010, the closing market price of our common stock on the NYSE was $63.76.

Holders
    On February 17, 2010, there were 78,671 shareholders of record.

Dividend Policy
     The Company currently does not pay cash dividends and does not plan to pay cash dividends in the foreseeable
future.


                                                                    33
Comparative Stock Performance
     The following graph compares the cumulative total shareholder return on the Company’s common stock with
the cumulative total return (including reinvested dividends) of the Standard & Poor’s Healthcare Index and the
Standard & Poor’s 500 Index for the period December 31, 2004 to December 31, 2009. The graph assumes that
$100 was invested on December 31, 2004, in the Company’s common stock and in each index or composite. No
cash dividends have been declared on the Company’s common stock.


                          COMPARISON OF 5 YEAR CUMULATIVE TOTAL RETURN
                                       Among Medco Health Solutions, Inc., the S&P 500 Index
                                                 and the S&P Healthcare Index

                  $350

                  $300

                  $250

                  $200

                  $150

                  $100

                    $50

                     $0
                      12/04                     12/05                     12/06                    12/07             12/08            12/09


                                Medco Health Solutions, Inc.                                       S&P 500                   S&P Healthcare

                                                                                                        12/04    12/05    12/06    12/07      12/08    12/09
    Medco Health Solutions, Inc. . . . . . . . . . . . . . . . . . . . . . . . . . . . . . . .          100.00   134.13   128.46   243.75     201.49   307.26
    S&P 500 . . . . . . . . . . . . . . . . . . . . . . . . . . . . . . . . . . . . . . . . . . . . .   100.00   104.91   121.48   128.16      80.74   102.11
    S&P Healthcare . . . . . . . . . . . . . . . . . . . . . . . . . . . . . . . . . . . . . . . .      100.00   106.46   114.48   122.67      94.69   113.34

     The comparisons in the graph above are provided in response to disclosure requirements of the SEC and are
not intended to forecast or be indicative of future performance of the common stock.

Share Repurchase Program
    The Company is currently authorized to repurchase its shares under a $3 billion share repurchase program,
which expires in November 2010 (the “2008 Program”). The Company’s Board of Directors periodically reviews the
Company’s share repurchase programs and approves the associated trading parameters.


                                                                                     34
The following is a summary of the Company’s share repurchase activity for the three months ended
December 26, 2009 under the 2008 Program:

                                             Issuer Purchases of Equity Securities(1)
                                                                                       Total number of     Approximate
                                                                                      shares purchased    dollar value of
                                                                                         as part of a          shares
                                                                                           publicly      that may yet be
                                                   Total number          Average         announced       purchased under
                                                     of shares          price paid      program since     the program(4)
Fiscal Period                                       purchased          per share(2)      inception(3)     (in thousands)
Balances at September 26, 2009 . . . . .                                                 28,732,762         $1,792,905
September 27 to October 24, 2009 . . .                     —             $ —                     —          $1,792,905
October 25 to November 21, 2009 . . . .               809,500            $59.23             809,500         $1,744,960
November 22 to December 26, 2009 . .                2,901,928            $63.23           2,901,928         $1,561,458
      Fourth quarter 2009 totals . . . . . . . .    3,711,428            $62.36           3,711,428
(1)
       All information set forth in the table above relates to the Company’s 2008 Program. The 2008 Program was
       announced in November 2008 and pursuant to the 2008 Program, the Company is authorized to repurchase up
       to $3 billion of its common stock through November 2010.
(2)
       Dollar amounts include transaction costs. The total average price paid per share in the table above represents
       the average price paid per share for repurchases settled during the three months ended December 26, 2009. The
       average per-share cost for repurchases under the 2008 Program from inception through December 26, 2009 is
       $44.34.
(3)
       The Company repurchased all of the above-referenced shares of its common stock through its publicly
       announced 2008 Program.
(4)
       The balances at December 26, 2009 reflect the remaining authorized repurchases under the 2008 Program.
     From December 27, 2009 (the first day of the 2010 fiscal year) through February 19, 2010, the Company
repurchased 12.8 million shares at a total cost of $804 million with an average per-share cost of $62.94 and has
approximately $758 million remaining under its current authorization.
   During the fiscal year ended December 26, 2009, no equity securities of the Company were sold by the
Company that were not registered under the Securities Act of 1933, as amended.


                                                                  35
Item 6.       Selected Financial Data.
     The following table presents our selected historical consolidated financial and operating data. The selected
historical financial and operating data should be read in conjunction with, and is qualified in its entirety by reference
to, Part II, Item 7, “Management’s Discussion and Analysis of Financial Condition and Results of Operations,” and
our audited consolidated financial statements and notes thereto included in Part II, Item 8 of this Annual Report on
Form 10-K ($ and volumes in millions, except for per share data and EBITDA per adjusted prescription data):
                                                         December 26,     December 27,     December 29,     December 30,     December 31,
As of and for Fiscal Years Ended                             2009            2008(1)          2007(2)          2006(3)        2005(4) (5)
Consolidated statement of income
  data:
Total product net revenues(6) . . . . . . . . .           $58,961.4        $50,576.2        $43,961.9        $42,022.6        $37,455.0
Total service net revenues. . . . . . . . . . .               842.8            681.8            544.3            521.1            415.9
      Total net revenues(6) . . . . . . . . . . .             59,804.2         51,258.0         44,506.2         42,543.7         37,870.9
Cost of revenues:
  Cost of product net revenues(6) . . . . .                   55,523.1         47,308.2         41,402.6         40,012.5         35,827.8
  Cost of service revenues . . . . . . . . . .                   254.1            221.4            158.3            125.8            100.2
      Total cost of revenues(6) . . . . . . .        .        55,777.2         47,529.6         41,560.9         40,138.3         35,928.0
   Selling, general and administrative
      expenses . . . . . . . . . . . . . . . . . .   .         1,455.5          1,425.0          1,114.1          1,109.2           757.6
   Amortization of intangibles . . . . . . .         .           305.6            285.1            228.1            218.5           192.5
   Interest expense . . . . . . . . . . . . . . .    .           172.5            233.7            134.2             95.8            73.9
   Interest (income) and other (income)
      expense, net . . . . . . . . . . . . . . . .   .            (9.9)            (6.2)           (34.4)           (29.9)           (34.0)
      Total costs and expenses . . . . . . . .                57,700.9         49,467.2         43,002.9         41,531.9         36,918.0
Income before provision for income
  taxes . . . . . . . . . . . . . . . . . . . . . . .          2,103.3          1,790.8          1,503.3          1,011.8           952.9
Provision for income taxes(9) (f) . . . . . . .                  823.0            687.9            591.3            381.6           350.9
Net income . . . . . . . . . . . . . . . . . . . . .      $ 1,280.3        $ 1,102.9        $     912.0      $     630.2      $     602.0
Earnings per share data(7):
Basic earnings per share . . . . . . . . . . . .          $       2.66     $       2.17     $       1.66     $       1.06     $       1.04
Shares used in computing basic earnings
   per share . . . . . . . . . . . . . . . . . . . . .          481.1            508.6            550.2            594.5            576.1
Diluted earnings per share . . . . . . . . . .            $      2.61      $      2.13      $      1.63      $      1.04      $      1.03
Shares used in computing diluted
   earnings per share . . . . . . . . . . . . . .               490.0            518.6            560.9            603.3            587.1
Consolidated balance sheet data:
Working capital(8) . . . . . . . . . . . . . . . .        $ 1,810.9        $ 1,299.5        $ 1,173.5        $ 1,028.2        $ 1,300.1
Goodwill . . . . . . . . . . . . . . . . . . . . . .      $ 6,333.0        $ 6,331.4        $ 6,230.2        $ 5,108.7        $ 5,152.3
Intangible assets, net . . . . . . . . . . . . . .        $ 2,428.8        $ 2,666.4        $ 2,905.0        $ 2,523.1        $ 2,741.6
Total assets . . . . . . . . . . . . . . . . . . . . .    $17,915.5        $17,010.9        $16,217.9        $14,388.1        $14,447.7
Total debt . . . . . . . . . . . . . . . . . . . . . .    $ 4,015.9        $ 4,602.9        $ 3,494.4        $ 1,266.7        $ 1,469.4
Deferred tax liabilities . . . . . . . . . . . . .        $ 958.8          $ 1,065.3        $ 1,167.0        $ 1,161.3        $ 1,213.8
Total noncurrent liabilities . . . . . . . . . .          $ 5,180.6        $ 5,255.0        $ 4,213.4        $ 2,057.8        $ 2,218.0
Total stockholders’ equity. . . . . . . . . . .           $ 6,387.2        $ 5,957.9        $ 6,875.3        $ 7,503.5        $ 7,724.2


                                                                           36
December 26,   December 27,   December 29,   December 30,   December 31,
As of and for Fiscal Years Ended                                   2009          2008(1)        2007(2)        2006(3)      2005(4) (5)
Supplemental information:
EBITDA(9) . . . . . . . . . . . . . . . . . .      ...           $ 2,750.5      $ 2,461.1      $ 2,000.1      $ 1,469.8      $ 1,350.3
EBITDA per adjusted prescription(9)                ...           $    3.06      $    3.09      $    2.67      $    2.01      $    1.89
Net cash provided by operating
  activities . . . . . . . . . . . . . . . . . .   ...           $ 3,501.4      $ 1,635.1      $ 1,367.0      $ 1,241.0      $ 1,040.8
Net cash used by investing activities              ...           $ (305.0)      $ (416.2)      $(1,713.8)     $ (155.5)      $(1,186.3)
Net cash (used by) provided by
  financing activities . . . . . . . . . . .       .   .   .     $(1,606.6)     $(1,054.6)     $   302.4      $(1,155.2)     $ (111.8)
Prescriptions administered . . . . . . .           .   .   .         694.5          586.0          559.8          553.4         540.1
  Retail . . . . . . . . . . . . . . . . . . . .   .   .   .         591.4          480.2          465.0          464.4         452.8
  Mail-order. . . . . . . . . . . . . . . . .      .   .   .         103.1          105.8           94.8           89.0          87.3
Adjusted prescriptions(9) (h) . . . . . . .        .   .   .         898.8          795.9          748.3          729.9         714.1
Adjusted mail-order penetration(10) .              .   .   .          34.2%          39.7%          37.9%          36.4%         36.6%
Other volume(11) . . . . . . . . . . . . . .       .   .   .           7.1            6.0             —              —             —
Overall generic dispensing rate . . . .            .   .   .          67.5%          64.1%          59.7%          55.2%         51.5%
  Retail generic dispensing rate . . .             .   .   .          69.2%          66.0%          61.7%          57.2%         53.3%
  Mail-order generic dispensing rate               .   .   .          57.8%          55.0%          50.0%          44.8%         41.7%

Notes to Selected Financial Data:
 (1)
       The consolidated statement of income data for 2008 includes the operating results of majority-owned Europa
       Apotheek Venlo B.V. (“Europa Apotheek”) commencing on the April 28, 2008 acquisition date, and for the sub-
       sequent period.
 (2)
       The consolidated statement of income data for 2007 includes the operating results of PolyMedica Corporation
       (“PolyMedica”) and Critical Care Systems, Inc. (“Critical Care”) commencing on the October 31, 2007 and
       November 14, 2007 acquisition dates, respectively, and for the subsequent periods.
 (3)
       The consolidated statement of income data for 2006 includes a pre-tax legal settlements charge of $162.6 million
       recorded in the first quarter of 2006, with a $99.9 million after-tax effect, or $0.17 per diluted share on a split-
       adjusted basis (see note (7) below).
 (4)
       Fiscal 2005 represents a 53-week fiscal year. All other fiscal years presented are comprised of 52 weeks.
 (5)
       The consolidated statement of income data for 2005 includes the operating results of Accredo Health, Incorpo-
       rated (“Accredo”) commencing on the August 18, 2005 acquisition date, and for the subsequent periods.
 (6)
       Includes retail co-payments of $8,661 million for 2009, $7,666 million for 2008, $7,553 million for 2007,
       $7,394 million for 2006, and $7,436 million for 2005.
 (7)
       Common share and per share amounts have been retrospectively adjusted for the two-for-one stock split, which
       became effective on January 24, 2008. See Note 1, “Background and Basis of Presentation,” to our audited con-
       solidated financial statements included in Part II, Item 8 of this Annual Report on Form 10-K.
 (8)
       Calculated as current assets less current liabilities.
 (9)
       EBITDA consists of earnings before interest income/expense, taxes, depreciation and amortization. We calculate
       and use EBITDA and EBITDA per adjusted prescription as indicators of our ability to generate cash from our
       reported operating results. These measurements are used in concert with net income and cash flows from opera-
       tions, which measure actual cash generated in the period. In addition, we believe that EBITDA and EBITDA per
       adjusted prescription are supplemental measurement tools used by analysts and investors to help evaluate over-
       all operating performance and the ability to incur and service debt and make capital expenditures. EBITDA does
       not represent funds available for our discretionary use and is not intended to represent or to be used as a substi-
       tute for net income or cash flows from operations data as measured under U.S. generally accepted accounting
       principles. The items excluded from EBITDA, but included in the calculation of reported net income, are signifi-
       cant components of the consolidated statements of income and must be considered in performing a comprehen-
       sive assessment of overall financial performance. EBITDA, and the associated year-to-year trends, should not be
       considered in isolation. Our calculation of EBITDA may not be consistent with calculations of EBITDA used by
       other companies. Additionally, we have calculated the 2006 EBITDA excluding the legal settlements charge
       recorded in the first quarter, as the charge is not considered an indicator of ongoing company performance.


                                                                               37
EBITDA per adjusted prescription is calculated by dividing EBITDA by the adjusted prescription volume for the
       period. This measure is used as an indicator of EBITDA performance on a per-unit basis, providing insight into
       the cash-generating potential of each prescription. EBITDA, and as a result, EBITDA per adjusted prescription,
       are affected by the changes in prescription volumes between retail and mail-order, the relative representation of
       brand-name, generic and specialty pharmacy drugs, as well as the level of efficiency in the business. Adjusted
       prescription volume equals substantially all mail-order prescriptions multiplied by three, plus retail prescrip-
       tions. These mail-order prescriptions are multiplied by three to adjust for the fact that they include approxi-
       mately three times the amount of product days supplied compared with retail prescriptions.
       The following table reconciles our reported net income to EBITDA and presents EBITDA per adjusted prescrip-
       tion for each of the respective periods (in millions, except for EBITDA per adjusted prescription data):
                                                                           December 26,        December 27,         December 29,   December 30,        December 31,
   For Fiscal Years Ended                                                      2009               2008(a)              2007(b)         2006             2005(c) (d)
   Net income . . . . . . . . . . . . . . . . . . . . . . . . . . .          $1,280.3            $1,102.9             $ 912.0        $ 630.2             $ 602.0
   Add:
        Interest expense . . . . . . . . . . . . . . . . . . . . . .             172.5               233.7                134.2           95.8                73.9
        Interest (income) and other (income) expense,
                                                                                                              (e)
           net . . . . . . . . . . . . . . . . . . . . . . . . . . . . .          (9.9)               (6.2)               (34.4)         (29.9)              (34.0)
                                                                                         (f)                 (f)                                 (f)                 (f)
        Provision for income taxes . . . . . . . . . . . . . . .                 823.0               687.9                591.3          381.6               350.9
        Depreciation expense . . . . . . . . . . . . . . . . . . .               179.0               157.7                168.9          173.6               165.0
        Amortization expense . . . . . . . . . . . . . . . . . .                 305.6               285.1                228.1          218.5               192.5
   EBITDA . . . . . . . . . . . . . . . . . . . . . . . . . . . .            $2,750.5            $2,461.1             $2,000.1       $1,469.8            $1,350.3
                                                                                                                                                 (g)
   Adjustment for the 2006 legal settlements charge . .                            —                   —                    —            162.6                 —
   EBITDA, excluding the 2006 legal settlements
     charge . . . . . . . . . . . . . . . . . . . . . . . . . . . .          $2,750.5            $2,461.1             $2,000.1       $1,632.4            $1,350.3

   Adjusted prescriptions(h) . . . . . . . . . . . . . . . . . .                 898.8               795.9                748.3          729.9               714.1
   EBITDA per adjusted prescription . . . . . . . . . . . .                  $    3.06           $    3.09            $    2.67      $    2.01           $    1.89

   EBITDA per adjusted prescription, excluding the
     2006 legal settlements charge . . . . . . . . . . . . .                 $    3.06           $    3.09            $    2.67      $    2.24           $    1.89

        (a)
              Includes majority-owned Europa Apotheek’s operating results commencing on the April 28, 2008 acquisi-
              tion date, and for the subsequent period.
        (b)
              Includes PolyMedica’s and Critical Care’s operating results commencing on the October 31, 2007 and
              November 14, 2007 acquisition dates, respectively, and for the subsequent periods.
        (c)
              Fiscal 2005 represents a 53-week fiscal year. All other fiscal years presented are comprised of 52 weeks.
        (d)
              Includes Accredo’s operating results commencing on the August 18, 2005 acquisition date, and for the sub-
              sequent periods.
        (e)
              Includes a $9.8 million charge for the ineffective portion of the forward-starting interest rate swap agree-
              ments associated with the March 2008 issuance of senior notes. See Note 8, “Debt,” to our audited consol-
              idated financial statements included in Part II, Item 8 of this Annual Report on Form 10-K.
         (f)
              2009, 2008, 2006 and 2005 include tax benefits of $22 million, $28 million, $20 million and $25.7 million,
              respectively. See Note 10, “Taxes on Income,” to our audited consolidated financial statements included in
              Part II, Item 8 of this Annual Report on Form 10-K.
        (g)
              Represents a pre-tax legal settlements charge of $162.6 million recorded in the first quarter of 2006. See
              note (3) to Selected Financial Data above.
        (h)
              Adjusted prescription volume equals substantially all mail-order prescriptions multiplied by three, plus
              retail prescriptions. These mail-order prescriptions are multiplied by three to adjust for the fact that they
              include approximately three times the amount of product days supplied compared with retail prescriptions.
(10)
           The percentage of adjusted mail-order prescriptions to total adjusted prescriptions.
(11)
           Represents over-the-counter drugs, as well as diabetes supplies primarily dispensed by PolyMedica.


                                                                                         38
Item 7.   Management’s Discussion and Analysis of Financial Condition and Results of Operations.
Overview
     We are a leading healthcare company that is pioneering the world’s most advanced pharmacy» and our clinical
research and innovations are part of Medco making medicine smarterTM for approximately 65 million members.
Medco provides clinically-driven pharmacy services designed to improve the quality of care and lower total
healthcare costs for private and public employers, health plans, labor unions and government agencies of all sizes,
and for individuals served by Medicare Part D Prescription Drug Plans. Our unique Medco Therapeutic Resource
Centers», which conduct therapy management programs using Medco specialist pharmacists who have expertise in
the medications used to treat certain chronic conditions, and Accredo Health Group, Medco’s Specialty Pharmacy,
represent innovative models for the care of patients with chronic and complex conditions.
      Our business model requires collaboration with retail pharmacies, physicians, the Centers for Medicare &
Medicaid Services (“CMS”) for Medicare, pharmaceutical manufacturers and, particularly in Specialty Pharmacy,
collaboration with state Medicaid agencies, and other third-party payors such as health insurers. Our programs and
services help control the cost and enhance the quality of prescription drug benefits. We accomplish this by providing
pharmacy benefit management (“PBM”) services through our national networks of retail pharmacies and our own
mail-order pharmacies, as well as through Accredo Health Group, which we believe is the nation’s largest specialty
pharmacy based on revenues. Medco’s Therapeutic Resource Center focused on diabetes was augmented with the
2007 acquisition of PolyMedica Corporation (“PolyMedica”), through which we believe we became the largest
diabetes pharmacy care practice based on covered patients. In 2008, we also extended our capabilities abroad when
we acquired a majority interest in Europa Apotheek Venlo B.V. (“Europa Apotheek”), a privately held company
based in the Netherlands that primarily provides mail-order pharmacy services in Germany. See Note 3, “Acquisi-
tions of Businesses,” to our audited consolidated financial statements included in Part II, Item 8 of this Annual
Report on Form 10-K for more information. In 2009, Medco advanced its European healthcare initiatives through a
joint venture with United Drug plc, a pan-European healthcare leader, to provide home-based pharmacy care services
in the United Kingdom for patients covered by the country’s National Health Service. Additionally, our commitment
to advancing the science of personalized medicine is further demonstrated by our January 2010 acquisition of DNA
Direct, Inc., a leader in providing guidance and decision support to payors, physicians and patients, on a range of
complex issues related to genomic medicine.
     All share and per share amounts have been retrospectively adjusted for the two-for-one common stock split,
effected in the form of a 100% stock dividend, which became effective January 24, 2008. See Note 1, “Background
and Basis of Presentation,” to our audited consolidated financial statements included in Part II, Item 8 of this Annual
Report on Form 10-K.
     The complicated environment in which we operate presents us with opportunities, challenges and risks. Our
clients and members are paramount to our success; the retention of existing clients and members and winning of
new clients and members poses the greatest opportunity to us and the loss thereof represents an ongoing risk. The
preservation of our relationships with pharmaceutical manufacturers, biopharmaceutical manufacturers and retail
pharmacies is very important to the execution of our business strategies. Our future success will be largely
dependent on our ability to drive mail-order volume and increase generic dispensing rates in light of the significant
brand-name drug patent expirations expected to occur over the next several years, as well as our ability to continue
to provide innovative and competitive clinical and other services to clients and members, including through our
active participation in the Medicare Part D Prescription Drug Plan (“Medicare Part D”) benefit, the rapidly growing
specialty pharmacy industry and our Therapeutic Resource Centers. Additionally, our future success will depend on
our continued ability to generate positive cash flows from operations with a keen focus on asset management and
maximizing return on invested capital (“ROIC”).
     Our financial performance benefits from the diversity of our client base and our clinically-driven business
model, which we believe provides better outcomes at lower costs for our clients. We actively monitor the status of
our accounts receivable and have mechanisms in place to minimize the potential for incurring material accounts
receivable credit risk. To date, we have not experienced any significant deterioration in our client or manufacturer
rebates accounts receivable.


                                                          39
We are very focused on managing our ROIC to ensure we drive the highest level of returns to our shareholders.
We believe there is a close correlation between strong ROIC and long-term shareholder value and as such, we
commenced in 2009 including ROIC as a component in our performance grid, which is a basis for providing
bonuses to our employees.
     When we use “Medco,” “we,” “us” and “our,” we mean Medco Health Solutions, Inc., a Delaware corporation,
and its consolidated subsidiaries. When we use the term “mail order,” we mean inventory dispensed through
Medco’s mail-order pharmacy operations.

Key Indicators Reviewed By Management
     Management reviews the following indicators in analyzing our consolidated financial performance: net
revenues, with a particular focus on mail-order revenue; adjusted prescription volume; generic dispensing rate; gross
margin percentage; retail pharmacy reimbursement rates; cash flow from operations; return on invested capital;
diluted earnings per share; Specialty Pharmacy segment revenue and operating income; Earnings Before Interest
Income/Expense, Taxes, Depreciation, and Amortization (“EBITDA”); and EBITDA per adjusted prescription. See
“—EBITDA” further below for a definition and calculation of EBITDA and EBITDA per adjusted prescription. We
believe these measures highlight key business trends and are important in evaluating our overall performance.

2009 Financial Performance Summary
     Our diluted earnings per share increased 22.5% to $2.61 and net income increased 16.1% to $1,280.3 million
for 2009 compared to $2.13 per share and $1,102.9 million, respectively, for 2008. These increases primarily reflect
higher generic dispensing rates, favorable retail pharmacy reimbursement rates and retail volumes, growth in the
Specialty Pharmacy business and service margin, as well as a decrease in the diluted weighted average shares
outstanding. These are partially offset by lower mail-order brand-name volumes, steeper client price discounts
associated with new clients and renewals of existing clients, and decreased manufacturer rebate retention rates. In
addition, these results include the operating results of majority-owned Europa Apotheek commencing on the April 28,
2008 acquisition date. For the year ended December 26, 2009, we generated cash flow from operations of
$3,501.4 million and had cash and cash equivalents of $2,528.2 million on our consolidated balance sheet at
December 26, 2009.
    The diluted weighted average shares outstanding were 490.0 million for 2009 compared to 518.6 million for
2008, representing a decrease of 5.5% resulting primarily from our share repurchase programs.
     Our total net revenues increased 16.7% to $59,804.2 million in 2009. Product net revenues increased 16.6% to
$58,961.4 million, which reflects product price inflation primarily on brand-name drugs, as well as higher retail
volume driven by new business, partially offset by a greater representation of lower-priced generic drugs and higher
client price discounts, as well as lower mail-order brand-name volumes. Additionally, our service revenues increased
23.6% to $842.8 million in 2009, which reflects higher client and other service revenues primarily from higher
claims processing administrative fees and higher revenue associated with Medicare Part D-related product offerings.
      The total adjusted prescription volume, which adjusts mail-order prescription volume for the difference in days
supply between mail order and retail, increased 12.9% to 898.8 million for 2009 and substantially reflects higher
retail volumes attributed to new clients. The higher volume of retail prescriptions also resulted in a decrease in the
adjusted mail-order penetration rate from 39.7% in 2008 to 34.2% in 2009.
     Our overall generic dispensing rate increased to 67.5% in 2009 from 64.1% in 2008, reflecting the impact of
the introduction of new generic products during these periods, heightened use of previously released generics, and
the effect of client plan design changes promoting the use of lower-priced and more steeply discounted generics.
Higher generic volumes, which contribute to lower costs for clients and members, resulted in a reduction in net
revenues of approximately $2,430 million for 2009.


                                                          40
Our overall gross margin decreased to 6.7% in 2009 from 7.3% in 2008, primarily reflecting the higher mix of
retail prescriptions. The gross margin percentage was favorably impacted by increased generic dispensing rates,
retail pharmacy reimbursement rates, and service margin, partially offset by higher client price discounts and lower
rebate retention.
     Selling, general and administrative (“SG&A”) expenses of $1,455.5 million for 2009 increased by $30.5 million,
or 2.1%, from 2008, reflecting enterprise-wide efficiencies, while adding significant amounts of new business and
continuing to invest in our differentiating initiatives. This increase primarily reflects higher performance-related and
stock-based compensation expenses, as well as higher depreciation expense.
     Amortization of intangible assets of $305.6 million for 2009 increased $20.5 million from 2008, reflecting
additional intangible amortization from PolyMedica associated with the Liberty trade name and patient list
acquisitions, as well as increased intangible amortization as a result of the April 28, 2008 acquisition of a majority
interest in Europa Apotheek.
     Interest expense of $172.5 million for 2009 decreased $61.2 million from 2008, primarily reflecting lower
interest rates on the floating rate components of outstanding debt. Additionally, total debt was reduced as there were
repayments on the accounts receivable financing facility of $600 million during 2009.
     Interest (income) and other (income) expense, net, of ($9.9) million for 2009 increased $3.7 million from
($6.2) million in 2008, reflecting a first-quarter 2008 charge for the ineffective portion of the forward-starting
interest rate swap agreements associated with our March 2008 issuance of senior notes, which is described further
below under “—Liquidity and Capital Resources—Financing Facilities—Swap Agreements.” This is partially offset
by decreased interest income reflecting lower interest rates on higher cash balances.
     Our effective tax rate (defined as the percentage relationship of provision for income taxes to income before
provision for income taxes) was 39.1% for 2009 compared to 38.4% for 2008. The lower effective tax rate in 2008
reflects a third-quarter 2008 net state income tax benefit of $28 million, partially offset by a fourth-quarter 2009
income tax benefit of $22 million.

Key Financial Statement Components
  Consolidated Statements of Income
     Our net revenues are comprised primarily of product net revenues and are derived principally from the sale of
prescription drugs through our networks of contractually affiliated retail pharmacies and through our mail-order
pharmacies, and are recorded net of certain discounts, rebates and guarantees payable to clients and members. The
majority of our product net revenues are derived on a fee-for-service basis. Product net revenues also include
revenues from the sale of diabetes supplies by PolyMedica. Our Specialty Pharmacy product net revenues represent
revenues from the sale of primarily biopharmaceutical drugs and are reported at the net amount billed to third-party
payors and patients.
     In addition, our product net revenues include premiums associated with our Medicare Part D Prescription Drug
Program (“PDP”) risk-based product offerings. These products involve prescription dispensing for beneficiaries
enrolled in the CMS-sponsored Medicare Part D prescription drug benefit. Our two insurance company subsidiaries
have been operating under contracts with CMS since 2006, and currently offer several Medicare PDP options. The
products involve underwriting the benefit, charging enrollees applicable premiums, providing covered prescription
drugs and administering the benefit as filed with CMS. We provide three Medicare drug benefit plan options for
beneficiaries, including (i) a “standard Part D” benefit plan as mandated by statute, and (ii) two benefit plans with
enhanced coverage, that exceed the standard Part D benefit plan, available for an additional premium. We also offer
numerous customized benefit plan designs to employer group retiree plans under the Medicare Part D prescription
drug benefit.


                                                          41
The PDP premiums are determined based on our annual bid and related contractual arrangements with CMS.
The PDP premiums are primarily comprised of amounts received from CMS as part of a direct subsidy and an
additional subsidy from CMS for low-income member premiums, as well as premium payments received from
members. These premiums are recognized ratably to product net revenues over the period in which members are
entitled to receive benefits. Premiums received in advance of the applicable benefit period are deferred and recorded
in accrued expenses and other current liabilities on the consolidated balance sheets. There is a possibility that the
annual costs of drugs may be higher or lower than premium revenues. As a result, CMS provides a risk corridor
adjustment for the standard drug benefit that compares our actual annual drug costs incurred to the targeted
premiums in our CMS-approved bid. Based on specific collars in the risk corridor, we will receive from CMS
additional premium amounts or be required to refund to CMS previously received premium amounts. We calculate
the risk corridor adjustment on a quarterly basis based on drug cost experience to date and record an adjustment to
product net revenues with a corresponding account receivable from or payable to CMS reflected on the consolidated
balance sheets.
     In addition to premiums, there are certain co-payments and deductibles (the “cost share”) due from members
based on prescription orders by those members, some of which are subsidized by CMS in cases of low-income
membership. For subsidies received in advance, the amount is deferred and recorded in accrued expenses and other
current liabilities on the consolidated balance sheets. If there is cost share due from members or CMS, the amount is
accrued and recorded in client accounts receivable, net, on the consolidated balance sheets. After the end of the
contract year and based on actual annual drug costs incurred, cost share amounts are reconciled with CMS and the
corresponding receivable or payable is settled. The cost share is treated consistently as other co-payments derived
from providing PBM services, as a component of product net revenues on the consolidated statements of income
where the requirements of Authoritative Guidance are met. For further details, see our critical accounting policies
included in “—Use of Estimates and Critical Accounting Policies and Estimates” below and Note 2, “Summary of
Significant Accounting Policies,” to our audited consolidated financial statements included in Part II, Item 8 of this
Annual Report on Form 10-K. Premium revenues for our PDP products, which exclude member cost share, were
$543 million, or less than 1% of total net revenues, in 2009, $317 million, or less than 1% of total net revenues, in
2008, and $255 million, or less than 1% of total net revenues, in 2007.
      Our agreements with CMS, as well as applicable Medicare Part D regulations and federal and state laws,
require us to, among other obligations: (i) comply with certain disclosure, filing, record-keeping and marketing
rules; (ii) operate quality assurance, drug utilization management and medication therapy management programs;
(iii) support e-prescribing initiatives; (iv) implement grievance, appeals and formulary exception processes; (v) com-
ply with payment protocols, which include the return of overpayments to CMS and, in certain circumstances,
coordination with state pharmacy assistance programs; (vi) use approved networks and formularies, and provide
access to such networks to “any willing pharmacy;” (vii) provide emergency out-of-network coverage; and
(viii) implement a comprehensive Medicare and Fraud, Waste and Abuse compliance program. We have various
contractual and regulatory compliance requirements associated with participating in Medicare Part D. Similar to our
requirements with other clients, our policies and practices associated with executing our PDP are subject to audit. If
material contractual or regulatory non-compliance was to be identified, monetary penalties and/or applicable
sanctions, including suspension of enrollment and marketing or debarment from participation in Medicare programs,
may be imposed. Additionally, each calendar year, payment will vary based on the annual benchmark that applies as
a result of Medicare Part D plan bids for the applicable year, as well as for changes in the CMS methodology for
calculating risk adjustment factors.
     Service revenues consist principally of administrative fees and clinical program fees earned from clients, sales
of prescription services to pharmaceutical manufacturers, performance-oriented fees paid by Specialty Pharmacy
manufacturers, and other non-product-related revenues.


                                                          42
Cost of revenues is comprised primarily of cost of product net revenues and is principally attributable to the
dispensing of prescription drugs. Cost of product net revenues for prescriptions dispensed through our networks of
retail pharmacies are comprised of the contractual cost of drugs dispensed by, and professional fees paid to, retail
pharmacies in the networks, including the associated member co-payments. Our cost of product net revenues relating
to drugs dispensed by our mail-order pharmacies consists primarily of the cost of inventory dispensed and our costs
incurred to process and dispense the prescriptions, including the associated fixed asset depreciation. The operating
costs of our call center pharmacies are also included in cost of product net revenues. In addition, cost of product net
revenues includes a credit for rebates earned from brand-name pharmaceutical manufacturers whose drugs are
included in our formularies. These rebates generally take the form of formulary rebates, which are earned based on
the volume of a specific drug dispensed, or market share rebates, which are earned based on the achievement of
contractually specified market share levels.
      Our cost of product net revenues also includes the cost of drugs dispensed by our mail-order pharmacies or
retail network for members covered under our Medicare PDP product offerings and are recorded at cost as incurred.
We receive a catastrophic reinsurance subsidy from CMS for approximately 80% of costs incurred by individual
members in excess of the individual annual out-of-pocket maximum of $4,350 for coverage year 2009, $4,050 for
coverage year 2008, and $3,850 for coverage year 2007. The subsidy is reflected as an offsetting credit in cost of
product net revenues to the extent that catastrophic costs are incurred. Catastrophic reinsurance subsidy amounts
received in advance are deferred and recorded in accrued expenses and other current liabilities on the consolidated
balance sheets. If there are catastrophic reinsurance subsidies due from CMS, the amount is accrued and recorded in
client accounts receivable, net, on the consolidated balance sheets. After the end of the contract year and based on
actual annual drug costs incurred, catastrophic reinsurance amounts are reconciled with CMS and the corresponding
receivable or payable is settled. Cost of service revenues consist principally of labor and operating costs for delivery
of services provided, as well as costs associated with member communication materials.
      SG&A expenses reflect the costs of operations dedicated to executive management, the generation of new sales,
maintenance of existing client relationships, management of clinical programs, enhancement of technology capabil-
ities, direction of pharmacy operations, and performance of reimbursement activities, in addition to finance, legal
and other staff activities, and the effect of certain legal settlements. SG&A also includes direct response advertising
expenses associated with PolyMedica, which are expensed as incurred.
     Interest expense is incurred on our senior unsecured bank credit facilities, accounts receivable financing facility
and other short-term debt, and senior notes, and includes net interest on our interest rate swap agreements on
$200 million of the $500 million of 7.25% senior notes due in 2013. In addition, it includes amortization of the
effective portion of our settled forward-starting interest rate swap agreements and amortization of debt issuance
costs.
      Interest (income) and other (income) expense, net, includes interest income generated by cash and cash
equivalent investments, as well as short-term and long-term investments in marketable securities. In addition, it
includes a loss on the ineffective portion of the settled forward-starting interest rate swap agreements recorded in the
first quarter of 2008.
     For further details, see our critical accounting policies included in “—Use of Estimates and Critical Accounting
Policies and Estimates” below and Note 2, “Summary of Significant Accounting Policies,” to our audited
consolidated financial statements included in Part II, Item 8 of this Annual Report on Form 10-K.

  Consolidated Balance Sheets
      Our primary assets include cash and cash equivalents, short-term and long-term investments, manufacturer
accounts receivable, client accounts receivable, inventories, fixed assets, deferred tax assets, goodwill and intangible
assets. Cash and cash equivalents reflect the accumulation of net positive cash flows from our operations, investing
and financing activities, and primarily include time deposits with banks or other financial institutions, and money
market mutual funds. Our short-term and long-term investments include U.S. government securities that are held to
satisfy statutory capital requirements for our insurance subsidiaries.


                                                           43
Manufacturer accounts receivable balances primarily include amounts due from brand-name pharmaceutical
manufacturers for earned rebates and other prescription services. Client accounts receivable represent amounts due
from clients, other payors and patients for prescriptions dispensed from retail pharmacies in our networks or from
our mail-order pharmacies, including fees due to us, net of allowances for doubtful accounts, as well as contractual
allowances and any applicable rebates and guarantees payable when these payables are settled on a net basis in the
form of an invoice credit. In cases where rebates and guarantees are settled with the client on a net basis, and the
rebates and guarantees payable are greater than the corresponding client accounts receivable balances, the net
liability is reclassified to client rebates and guarantees payable. When these payables are settled in the form of a
check or wire, they are recorded on a gross basis and the entire liability is reflected in client rebates and guarantees
payable. Our client accounts receivable also includes receivables from CMS for our Medicare PDP product offerings
and premiums from members. Additionally, we have receivables from Medicare and Medicaid for a portion of our
Specialty Pharmacy business, and diabetes supplies dispensed by PolyMedica.
     Inventories reflect the cost of prescription products held for dispensing by our mail-order pharmacies and are
recorded on a first-in, first-out basis, net of allowances for losses. Deferred tax assets primarily represent temporary
differences between the financial statement basis and the tax basis of certain accrued expenses, stock-based
compensation, and client rebate pass-back liabilities. Income taxes receivable represents amounts due from the IRS
and state and local taxing authorities associated primarily with the approval of a favorable accounting method
change received from the IRS in 2006 for the timing of the deductibility of certain rebates passed back to clients.
Fixed assets include investments in our corporate headquarters, mail-order pharmacies, call center pharmacies,
account service offices, and information technology, including capitalized software development. Goodwill and
intangible assets are comprised primarily of the goodwill and intangibles that had been pushed down to our
consolidated balance sheets and existed when we became an independent, publicly traded enterprise in 2003,
goodwill and intangibles recorded upon our acquisition in 2007 of PolyMedica, and, for the Specialty Pharmacy
segment, goodwill and intangible assets recorded primarily from our acquisition of Accredo Health, Incorporated
(“Accredo”) in 2005 and Critical Care Systems, Inc. (“Critical Care”) in 2007.
      Our primary liabilities include claims and other accounts payable, client rebates and guarantees payable,
accrued expenses and other current liabilities, debt and deferred tax liabilities. Claims and other accounts payable
primarily consist of amounts payable to retail network pharmacies for prescriptions dispensed and services rendered
by the retail pharmacies, as well as amounts payable for mail-order prescription inventory purchases and other
purchases made in the normal course of business. Client rebates and guarantees payable include amounts due to
clients that will ultimately be settled in the form of a check or wire, as well as any residual liability in cases where
the payable is settled as an invoice credit and exceeds the corresponding client accounts receivable balances.
Accrued expenses and other current liabilities primarily consist of employee- and facility-related cost accruals
incurred in the normal course of business, as well as income taxes payable. Accrued expenses and other current
liabilities are also comprised of certain premiums, and may also include cost share, and catastrophic reinsurance
payments received in advance from CMS for our Medicare PDP product offerings. Our debt is primarily comprised
of a senior unsecured term loan facility, a senior unsecured revolving credit facility, senior notes and an accounts
receivable financing facility. In addition, we have a net deferred tax liability primarily associated with our recorded
intangible assets. We do not have any material off-balance sheet arrangements, other than purchase commitments
and lease obligations. See “—Commitments and Contractual Obligations” below.
     Our stockholders’ equity includes an offset for purchases of our common stock under our share repurchase
program. The accumulated other comprehensive income component of stockholders’ equity includes: unrealized
investment gains and losses, foreign currency translation adjustments resulting primarily from the translation of
Europa Apotheek’s assets and liabilities and results of operations, unrealized gains and losses on effective cash flow
hedges, and the net gains and losses and prior service costs and credits related to our pension and other
postretirement benefit plans.

  Consolidated Statements of Cash Flows
     An important element of our operating cash flows is the timing of billing cycles, which are generally two-week
periods of accumulated billings for retail and mail-order prescriptions. We bill the cycle activity to clients on this bi-
weekly schedule and generally collect from our clients before we pay our obligations to the retail pharmacies for
that same cycle. At the end of any given reporting period, unbilled PBM receivables can represent up to two weeks
of dispensing activity and will fluctuate at the end of a fiscal month depending on the timing of these billing cycles.
A portion of the Specialty Pharmacy business includes reimbursement by payors, such as insurance companies,
under a medical benefit, or by Medicare or Medicaid. These transactions also involve higher patient co-payments
than experienced in the PBM business. As a result, this portion of the Specialty Pharmacy business, which yields a
higher margin than the PBM business, experiences slower accounts receivable turnover than in the aforementioned
PBM cycle and has a different credit risk profile. Our operating cash flows are also impacted by timing associated
with our Medicare PDP product offerings, including premiums, cost share, and catastrophic reinsurance received
from CMS. In addition, our operating cash flows include tax benefits for employee stock plans up to the amount
associated with compensation expense.

                                                           44
Ongoing operating cash flows are associated with expenditures to support our mail-order, retail pharmacy network
operations, call center pharmacies and other SG&A functions. The largest components of these expenditures include
payments to retail pharmacies; mail-order inventory purchases, which are paid in accordance with payment terms
offered by our suppliers to take advantage of appropriate discounts, rebate and guarantee payments to clients; employee
payroll and benefits; facility operating expenses and income taxes. In addition, earned brand-name pharmaceutical
manufacturers’ rebates are recorded monthly based upon prescription dispensing, with actual bills rendered on a
quarterly basis and paid by the manufacturers within an agreed-upon term. Payments of rebates to clients are generally
made after our receipt of the rebates from the brand-name pharmaceutical manufacturers, although some clients may
receive more accelerated rebate payments in exchange for other elements of pricing in their contracts.
      Ongoing investing cash flows are primarily associated with capital expenditures including technology invest-
ments, as well as purchases of securities and other assets, and proceeds from securities and other investments, which
primarily relate to investment activities of our insurance companies. Acquisitions will also generally result in cash
outflows from investing activities. Our financing cash flows primarily include share repurchases, proceeds from debt,
interest and principal payments on our outstanding debt, proceeds from employee stock plans, and the benefits of
realized tax deductions in excess of tax benefits on compensation expense.

Clients
      We have clients in a broad range of industry categories, including various Blue Cross/Blue Shield plans;
managed care organizations; insurance carriers; third-party benefit plan administrators; employers; federal, state and
local government agencies; and union-sponsored benefit plans. For fiscal years 2009, 2008 and 2007, our ten largest
clients based on revenue accounted for approximately 49%, 45% and 45% of our net revenues, respectively,
including UnitedHealth Group Incorporated (“UnitedHealth Group”), our largest client, which represented approxi-
mately $11,300 million, or 19%, $11,000 million, or 21%, and $9,900 million, or 22%, of our net revenues,
respectively. The UnitedHealth Group account has a lower than average mail-order penetration and, because of its
size, steeper pricing than the average client, and consequently generally yields lower profitability as a percentage of
net revenues than smaller client accounts. In addition, with respect to mail-order volume, which is an important
contributor to our overall profitability, the mail-order volume associated with this account represented less than 10%
of our overall mail-order volume for fiscal years 2009, 2008 and 2007, respectively. Under our current agreement
with UnitedHealth Group, we are providing pharmacy benefit services through December 31, 2012. None of our
other clients individually represented more than 10% of our net revenues in 2009, 2008 or 2007.

Segment Discussion
      We have two reportable segments, PBM and Specialty Pharmacy. The PBM segment involves sales of
traditional prescription drugs and supplies to our clients and members, either through our network of contractually
affiliated retail pharmacies or our mail-order pharmacies. The PBM segment also includes the operating results of
PolyMedica, a provider of diabetes testing supplies and related products, as well as majority-owned Europa
Apotheek, which primarily provides mail-order pharmacy services in Germany, commencing on their respective
acquisition dates. The Specialty Pharmacy segment includes the sale of higher-margin specialty pharmacy products
and services for the treatment of chronic and complex (potentially life-threatening) diseases including specialty
infusion services.
     We define the Specialty Pharmacy segment based on a product set and associated services, broadly character-
ized to include drugs that are high-cost, usually developed by biotechnology companies and often injectable or
infusible, and which require elevated levels of patient support. When dispensed, these products frequently require
ancillary administration equipment, special packaging, and a higher degree of patient-oriented customer service than
is required in the traditional PBM business model, including in-home nursing services and administration. In
addition, specialty pharmacy products and services are often covered through medical benefit programs with the
primary payors being insurance companies and government programs. Additionally, payors include patients, as well
as PBM clients.
     The PBM segment is measured and managed on an integrated basis, and there is no distinct measurement that
separates the performance and profitability of mail order and retail. We offer fully integrated PBM services to
virtually all of our PBM clients and their members. The PBM services we provide to our clients are generally
delivered and managed under a single contract for each client. The PBM and Specialty Pharmacy segments primarily
operate in the United States and have limited activity in Puerto Rico, Germany and the United Kingdom.
     As a result of the nature of our integrated PBM services and contracts, the chief operating decision maker
views Medco’s PBM operations as a single segment for purposes of making decisions about resource allocations and
in assessing performance.

                                                          45
Consolidated Results of Operations
     The following table presents selected consolidated comparative results of operations and volume performance
($ and volumes in millions):
                                           December 26,                         December 27,                        December 29,
For Fiscal Years Ended                         2009           Variance             2008(1)          Variance           2007(2)
Net Revenues
Retail product(3) . . . . . . . . . .       $36,596.4     $7,982.9    27.9%      $28,613.5     $2,189.4      8.3%    $26,424.1
Mail-order product . . . . . . . .           22,365.0        402.3     1.8%       21,962.7      4,424.9     25.2%     17,537.8
Total product(3) . . . . . . . . . . .      $58,961.4     $8,385.2    16.6%      $50,576.2     $6,614.3     15.0%    $43,961.9
Client and other service . . . . .              685.0       182.8      36.4%         502.2         111.2    28.4%        391.0
Manufacturer service . . . . . . .              157.8       (21.8)    (12.1)%        179.6          26.3    17.2%        153.3
Total service . . . . . . . . . . . . .     $   842.8     $ 161.0     23.6%      $   681.8     $ 137.5      25.3%    $   544.3
                         (3)
Total net revenues             .......      $59,804.2     $8,546.2    16.7%      $51,258.0     $6,751.8     15.2%    $44,506.2
Cost of Revenues
Product(3) . . . . . . . . . . . . . . .    $55,523.1     $8,214.9    17.4%      $47,308.2     $5,905.6     14.3%    $41,402.6
Service . . . . . . . . . . . . . . . .         254.1         32.7    14.8%          221.4         63.1     39.9%        158.3
Total cost of revenues(3) . . . . .         $55,777.2     $8,247.6    17.4%      $47,529.6     $5,968.7     14.4%    $41,560.9
                   (4)
Gross Margin
Product . . . . . . . . . . . .   ....      $ 3,438.3     $ 170.3        5.2%    $ 3,268.0     $ 708.7      27.7%    $ 2,559.3
Product gross margin
  percentage . . . . . . . .      ....            5.8%       (0.7)%                    6.5%          0.7%                  5.8%
Service . . . . . . . . . . . .   ....      $   588.7     $ 128.3   27.9%        $   460.4     $    74.4  19.3%      $   386.0
Service gross margin
  percentage . . . . . . . .      ....           69.9%        2.4%                    67.5%       (3.4)%                  70.9%
Total gross margin. . . . .       ....      $ 4,027.0     $ 298.6        8.0%    $ 3,728.4     $ 783.1   26.6%       $ 2,945.3
Gross margin percentage           ....            6.7%       (0.6)%                    7.3%        0.7%                    6.6%
Volume Information
Retail prescriptions . . . .      ....          591.4       111.2     23.2%          480.2          15.2     3.3%        465.0
Mail-order prescriptions .        ....          103.1        (2.7)    (2.6)%         105.8          11.0    11.6%         94.8
Total prescriptions . . . . . . . . .           694.5       108.5     18.5%          586.0          26.2    4.7%         559.8
Adjusted prescriptions(5) . . . .               898.8       102.9     12.9%          795.9          47.6    6.4%         748.3
Adjusted mail-order
  penetration(6) . . . . . . . . . . .           34.2%        (5.5)%                  39.7%          1.8%                 37.9%
Other volume(7) . . . . . . . . . . .             7.1          1.1   18.3%             6.0           6.0  N/M*              —
Generic Dispensing Rate
  Information
Retail generic dispensing
  rate . . . . . . . . . . . . . . . . .         69.2%         3.2%                   66.0%          4.3%                 61.7%
Mail-order generic dispensing
  rate . . . . . . . . . . . . . . . . .         57.8%         2.8%                   55.0%          5.0%                 50.0%
Overall generic dispensing
  rate . . . . . . . . . . . . . . . . .         67.5%         3.4%                   64.1%          4.4%                 59.7%
  * Not meaningful.
 (1)
     Includes majority-owned Europa Apotheek’s operating results commencing on the April 28, 2008 acquisition
     date, and for the subsequent period.
 (2)
     Includes PolyMedica’s and Critical Care’s operating results commencing on the October 31, 2007 and Novem-
     ber 14, 2007 acquisition dates, respectively, and for the subsequent periods.
 (3)
     Includes retail co-payments of $8,661 million for 2009, $7,666 million for 2008, and 7,553 million for 2007.
 (4)
     Defined as net revenues minus cost of revenues.
 (5)
     Adjusted prescription volume equals substantially all mail-order prescriptions multiplied by three, plus retail
     prescriptions. These mail-order prescriptions are multiplied by three to adjust for the fact that they include
     approximately three times the amount of product days supplied compared with retail prescriptions.
 (6)
     The percentage of adjusted mail-order prescriptions to total adjusted prescriptions.
 (7)
     Represents over-the-counter drugs, as well as diabetes supplies primarily dispensed by PolyMedica.


                                                                      46
Net Revenues
      Retail. The increase in retail net revenues of $7,983 million for 2009 reflects net volume increases of
$6,627 million primarily from new business, partially offset by client terminations. Also contributing to the higher
retail net revenues are net price increases of $1,356 million for 2009 driven by product price inflation primarily on
brand-name drugs, partially offset by higher client price discounts. The aforementioned net price variance includes
the offsetting effect of approximately $1,585 million from a greater representation of lower-priced generic drugs in
2009.
     The increase in retail net revenues of $2,189 million for 2008 reflects net price increases of $1,330 million
driven by product price inflation primarily on brand-name drugs, partially offset by higher client price discounts.
Also contributing to the higher retail net revenues are net volume increases of $859 million, primarily from new
business, partially offset by client terminations. The aforementioned net price variance includes the offsetting effect
of approximately $1,780 million from a greater representation of lower-priced generic drugs in 2008.
     Mail-Order. The increase in mail-order net revenues of $402 million for 2009 reflects net price increases of
$923 million driven by product price inflation primarily on brand-name drugs, partially offset by higher client price
discounts. These increases are partially offset by net volume decreases of $521 million from lower brand-name
volumes, and are net of new business and incremental volume from the Europa Apotheek majority-stake acquisition
and higher generic volumes. The higher-priced brand-name volumes were lower; however the less expensive generic
volumes were higher in part as a result of the economy and plan design changes. The aforementioned net price
variance includes the offsetting effect of approximately $845 million from a greater representation of lower-priced
generic drugs in 2009.
     The increase in mail-order net revenues of $4,425 million for 2008 reflects net volume increases of
$2,817 million, primarily from new business and incremental volume from acquisitions including, most significantly,
PolyMedica. Also contributing to the increased mail-order net revenues are net price increases of $1,608 million
driven by product price inflation primarily on brand-name drugs, partially offset by higher client price discounts.
The aforementioned net price variance includes the offsetting effect of approximately $910 million from a greater
representation of lower-priced generic drugs in 2008.
     Our overall generic dispensing rate increased to 67.5% for 2009, compared to 64.1% for 2008 and 59.7% for
2007. Mail-order generic dispensing rates increased to 57.8% for 2009, compared to 55.0% for 2008 and 50.0% for
2007. Retail generic dispensing rates increased to 69.2% for 2009, compared to 66.0% for 2008 and 61.7% for
2007. These increases reflect the impact of the introduction of new generic products during these periods and the
effect of programs and client plan design changes promoting the use of lower-priced and more steeply discounted
generics.


                                                           47
Service revenues increased $161.0 million in 2009 as a result of higher client and other service revenues of
$182.8 million, partially offset by lower manufacturer service revenues of $21.8 million. The higher client and other
service revenues primarily reflect higher claims processing administrative fees associated with the increased retail
volume, and higher revenue associated with Medicare Part D-related product offerings, as well as higher revenues
for formulary management fees and clinical programs. The lower manufacturer service revenues reflect reduced
administrative fees from manufacturer contract revisions.
     Service revenues increased $137.5 million in 2008 as a result of higher client and other service revenues of
$111.2 million, and higher manufacturer service revenues of $26.3 million. The higher client and other service
revenues primarily reflect higher revenues for clinical programs, formulary management fees, and higher claims
processing administrative fees, in addition to revenue associated with Medicare Part D-related product offerings. The
higher manufacturer revenues result from increased fees reflecting higher volumes and manufacturer contract
revisions.

  Gross Margin
     Our product gross margin percentage was 5.8% for 2009 compared to 6.5% for 2008, primarily reflecting
higher retail volumes and overall higher retail mix in our prescription base. The product gross margin percentage
was favorably impacted by increased generic dispensing rates and retail pharmacy reimbursement rates, partially
offset by higher client price discounts associated with new clients and renewals of existing clients, and lower rebate
retention. Costs associated with implementation efforts for new clients were consistent in 2009 and 2008.
     Our product gross margin percentage was 6.5% for 2008 compared to 5.8% for 2007, reflecting increased
generic dispensing rates and higher mail-order volumes, as well as favorable retail pharmacy reimbursement rates
and higher rebate retention. These items are partially offset by higher client price discounts associated with new
clients and renewals of existing clients, as well as the benefit from the short-term availability of generic Plavix»
primarily in the first quarter of 2007.
      Rebates from brand-name pharmaceutical manufacturers, which are reflected as a reduction in cost of product
net revenues, totaled $5,372 million in 2009, $4,447 million in 2008 and $3,561 million in 2007, with formulary
rebates representing 78.7%, 54.7% and 50.1% of total rebates, respectively. The overall increases in rebates reflect
volume from new clients and favorable pharmaceutical manufacturer rebate contract revisions, as well as improved
formulary management and patient compliance, partially offset by lower rebates as a result of brand-name drug
volumes that have converted to generic drugs. The increases in formulary rebate percentages of total rebates reflect
the composition of new client business. We retained approximately $734 million, or 13.7%, of total rebates in 2009,
$806 million, or 18.1%, in 2008, and $547 million, or 15.4%, in 2007. The variances in the retained rebate
percentages are reflective of client mix and the associated client preferences regarding the rebate sharing aspects of
their overall contract pricing structure.
     Service gross margin of $588.7 million for 2009 increased $128.3 million compared to $460.4 million for 2008,
reflecting the aforementioned increase in service revenues of $161.0 million, partially offset by an increase in cost
of service revenues of $32.7 million. The cost of service revenue increase reflects higher labor and other costs
associated with formulary management fees, Medicare Part D and other client programs.
     Service gross margin of $460.4 million for 2008 increased $74.4 million compared to $386.0 million for 2007,
reflecting the aforementioned increase in service revenues of $137.5 million, partially offset by an increase in cost
of service revenues of $63.1 million. The cost of service revenues increase reflects higher labor and other costs
associated with Medicare Part D and other client programs, as well as higher promotional expenses for programs to
encourage mail-order and generic utilization.


                                                          48
The following table presents additional selected comparative results of operations ($ in millions):
                                             December 26,                          December 27,                      December 29,
For Fiscal Years Ended                           2009          Variance               2008(1)        Variance           2007(2)
Gross margin(3) . . . . . . . . .    ....      $ 4,027.0    $298.6         8.0%      $3,728.4     $783.1   26.6%       $2,945.3
Selling, general and
   administrative expenses . .       ....       1,455.5       30.5       2.1%         1,425.0      310.9   27.9%        1,114.1
Amortization of intangibles .        ....         305.6       20.5       7.2%           285.1       57.0   25.0%          228.1
Interest expense . . . . . . . . .   ....         172.5      (61.2)    (26.2)%          233.7       99.5   74.1%          134.2
Interest (income) and other
   (income) expense, net . . .       ....           (9.9)     (3.7)        59.7%         (6.2)      28.2   (82.0)%        (34.4)
Income before provision for
  income taxes . . . . . . . . . . . . .        2,103.3      312.5         17.5%      1,790.8      287.5   19.1%        1,503.3
Provision for income taxes . . . . .              823.0      135.1         19.6%        687.9       96.6   16.3%          591.3
Net income . . . . . . . . . . . . . . . .     $ 1,280.3    $177.4         16.1%     $1,102.9     $190.9   20.9%       $ 912.0

(1)
      Includes majority-owned Europa Apotheek’s operating results commencing on the April 28, 2008 acquisition
      date, and for the subsequent period.
(2)
      Includes PolyMedica’s and Critical Care’s operating results commencing on the October 31, 2007 and Novem-
      ber 14, 2007 acquisition dates, respectively, and for the subsequent periods.
(3)
      Defined as net revenues minus cost of revenues.

   Selling, General and Administrative Expenses
     SG&A expenses for 2009 were $1,455.5 million and increased from 2008 by $30.5 million, or 2.1%, reflecting
enterprise-wide efficiencies, while adding significant amounts of new business and continuing to invest in our
differentiating initiatives. This increase primarily reflects higher performance-related and stock-based compensation
expenses, as well as higher depreciation expense associated with investments across the business. Also contributing
to the increase is the addition of Europa Apotheek SG&A expenses, partially offset by miscellaneous expense
decreases including litigation reserves.
     SG&A expenses for 2008 were $1,425.0 million and increased from 2007 by $310.9 million, or 27.9%. This
primarily reflects SG&A expenses associated with PolyMedica and Critical Care, which were acquired in the fourth
quarter of 2007, and Europa Apotheek, a second-quarter 2008 majority interest acquisition. In addition, the increase
in SG&A expenses also reflects higher employee-related costs, and other miscellaneous expenses including litigation
reserves.

   Amortization of Intangibles
     Amortization of intangible assets of $305.6 million for 2009 increased $20.5 million from 2008, reflecting
additional intangible amortization from PolyMedica associated with the Liberty trade name and patient list
acquisitions, as well as increased intangible amortization as a result of the April 28, 2008 acquisition of a majority
interest in Europa Apotheek. Amortization of intangible assets of $285.1 million for 2008 increased $57.0 million
from 2007, primarily reflecting the additional intangible asset amortization associated with the PolyMedica and
Critical Care acquisitions, and the acquisition of a majority interest in Europa Apotheek.

   Interest Expense
     Interest expense of $172.5 million for 2009 decreased $61.2 million from 2008, primarily reflecting lower
interest rates on the floating rate components of outstanding debt. Additionally, total debt was reduced as there were
repayments on the accounts receivable financing facility of $400 million on September 1, 2009 and $200 million on
December 23, 2009.
     Interest expense of $233.7 million for 2008 increased $99.5 million from 2007, reflecting increased borrowings
through the first quarter of 2008 primarily to support the PolyMedica and Critical Care acquisitions, and the
acquisition of a majority interest in Europa Apotheek, partially offset by lower interest rates on the floating rate
components of outstanding debt.


                                                                      49
The weighted average annual interest rate on our indebtedness was approximately 3.8% for 2009, 5.1% for
2008, and 6.3% for 2007, and reflects variability in floating interest rates on the senior unsecured bank credit
facilities, swap agreements and the accounts receivable financing facility.

  Interest (Income) and Other (Income) Expense, Net
     Interest (income) and other (income) expense, net, of ($9.9) million for 2009 increased $3.7 million from
($6.2) million in 2008, reflecting a first-quarter 2008 charge of $9.8 million for the ineffective portion of the
forward-starting interest rate swap agreements associated with our March 2008 issuance of senior notes, which is
described further below under “—Liquidity and Capital Resources—Financing Facilities—Swap Agreements.” This
is partially offset by decreased interest income reflecting lower interest rates on higher cash balances.
      Interest (income) and other (income) expense, net, of ($6.2) million for 2008 decreased $28.2 million from
($34.4) million in 2007, primarily attributable to lower interest income reflecting lower interest rates. Additionally,
2008 reflects the aforementioned first-quarter charge of $9.8 million for the ineffective portion of the forward-
starting interest rate swap agreements associated with our March 2008 issuance of senior notes.

  Provision for Income Taxes
     Our effective tax rate (defined as the percentage relationship of provision for income taxes to income before
provision for income taxes) was 39.1% for 2009 compared to 38.4% for 2008. The lower effective tax rate in 2008
reflects a third-quarter 2008 net state income tax benefit of $28 million, resulting primarily from statute of
limitations expirations in certain states, partially offset by state tax law changes. This was partially offset by a
fourth-quarter 2009 income tax benefit of $22 million, primarily reflecting state-related tax items.
     Our effective tax rate was 38.4% for 2008 compared to 39.3% for 2007, reflecting the aforementioned third-
quarter 2008 net state income tax benefit of $28 million.

  Net Income and Earnings per Share
     Net income as a percentage of net revenues was 2.1% in 2009, 2.2% in 2008, and 2.0% in 2007. The decrease
to 2.1% in 2009 from 2.2% in 2008 reflects the combined effect of the aforementioned factors including retail
volume increases. The increase in 2008 to 2.2% from 2.0% in 2007 also reflects the aforementioned factors
including mail-order volume increases.
     Diluted earnings per share increased 22.5% to $2.61 for 2009, from $2.13 for 2008. Diluted earnings per share
increased 30.7% to $2.13 for 2008, from $1.63 for 2007. The diluted weighted average shares outstanding were
490.0 million for 2009, 518.6 million for 2008, and 560.9 million for 2007. The decreases for each year result from
the repurchase of approximately 186.3 million shares of stock in connection with our share repurchase programs
since inception in 2005 through the end of 2009, compared to equivalent amounts of 159.0 million and 111.4 million
shares repurchased inception-to-date through the ends of 2008 and 2007, respectively. There were approximately
27.3 million shares repurchased in 2009, compared to 47.6 million in 2008 and 53.3 million in 2007.


                                                           50
Segment Results of Operations
   PBM Segment
     The PBM segment involves sales of traditional prescription drugs and supplies to our clients and members,
either through our networks of contractually affiliated retail pharmacies or our mail-order pharmacies. The following
table presents selected PBM segment comparative results of operations ($ in millions):
                                         December 26,                           December 27,                       December 29,
For Fiscal Years Ended                       2009            Variance              2008(1)          Variance          2007(2)
Product net revenues . . . . . . . .      $ 49,526.2    $ 6,847.7    16.0%      $ 42,678.5     $ 4,697.1   12.4%    $ 37,981.4
Service revenues . . . . . . . . . . .         750.5        145.2    24.0%           605.3         123.2   25.6%         482.1
Total net revenues . . . . . . . . . .     50,276.7      6,992.9     16.2%        43,283.8      4,820.3    12.5%     38,463.5
Total cost of revenues . . . . . . .       46,951.5      6,765.3     16.8%        40,186.2      4,188.5    11.6%     35,997.7
Total gross margin(3) . . . . .   ...     $ 3,325.2     $ 227.6   7.3%          $ 3,097.6      $ 631.8  25.6%       $ 2,465.8
Gross margin percentage . .       ...           6.6%       (0.6)%                     7.2%         0.8%                   6.4%
Selling, general and
  administrative expenses .       ...       1,158.3         38.3         3.4%      1,120.0        235.7    26.7%        884.3
Amortization of intangibles       ...         258.1         17.6         7.3%        240.5         51.9    27.5%        188.6
Operating income . . . . . . . . . .      $ 1,908.8     $ 171.7          9.9%   $ 1,737.1      $ 344.2     24.7%    $ 1,392.9

(1)
      Includes majority-owned Europa Apotheek’s operating results commencing on the April 28, 2008 acquisition
      date, and for the subsequent period.
(2)
      Includes PolyMedica’s operating results commencing on the October 31, 2007 acquisition date, and for the sub-
      sequent periods.
(3)
      Defined as net revenues minus cost of revenues.
     PBM total net revenues of $50,276.7 million for 2009 increased $6,992.9 million compared to the revenues of
$43,283.8 million for 2008. The increases primarily reflect higher retail volume driven by new business, as well as
product price inflation primarily on brand-name drugs, partially offset by a greater representation of lower-priced
generic drugs and higher client price discounts, as well as lower mail-order brand-name volumes. PBM total net
revenues of $43,283.8 million for 2008 increased $4,820.3 million compared to the revenues of $38,463.5 million
for 2007. The increase primarily reflects higher total volume driven by new business and incremental volume from
PolyMedica, as well as product price inflation primarily on brand-name drugs, partially offset by a greater
representation of lower-priced generic drugs and higher client price discounts.
     Gross margin was 6.6% of net revenues for 2009 compared to 7.2% for 2008, primarily driven by a higher mix
of retail prescriptions. In addition, the gross margin percentage was favorably impacted by increased generic
dispensing rates and favorable retail pharmacy reimbursement rates, partially offset by higher client price discounts
and lower rebate retention. Gross margin was 7.2% of net revenues for 2008 compared to 6.4% for 2007, primarily
driven by the increased generic dispensing rates, higher mail-order penetration reflecting a large mail-order-only
client commencing in 2008, favorable retail pharmacy reimbursement rates, and higher rebate retention rates. These
increases are partially offset by client price discounts and the Plavix» benefit primarily in the first quarter of 2007.
     SG&A expenses for 2009 were $1,158.3 million, and increased from 2008 by $38.3 million. The increase
primarily reflects higher performance-related and stock-based compensation expenses, as well as higher depreciation
expense associated with investments across the business. Also contributing to the increase is the addition of Europa
Apotheek SG&A expenses, partially offset by miscellaneous expense decreases including litigation reserves. SG&A
expenses for 2008 were $1,120.0 million, and increased from 2007 by $235.7 million. The increase primarily
reflects SG&A expenses associated with PolyMedica and Europa Apotheek, and higher employee-related costs, as
well as litigation reserves.


                                                                    51
Amortization of intangible assets was $258.1 million for 2009, compared to $240.5 million for 2008. The
increase reflects additional intangible amortization from PolyMedica associated with the Liberty trade name and
patient list acquisitions, as well as increased intangible amortization as a result of the April 28, 2008 acquisition of
a majority interest in Europa Apotheek. Amortization of intangible assets was $240.5 million for 2008, compared to
$188.6 million for 2007. The increase reflects the additional intangible asset amortization associated with the
acquisitions of PolyMedica and a majority interest in Europa Apotheek.
     Operating income of $1,908.8 million for 2009 increased $171.7 million, or 9.9%, compared to 2008. Operating
income of $1,737.1 million for 2008 increased $344.2 million, or 24.7%, compared to 2007. The increases in
operating income resulted from the aforementioned factors.
    For additional information on the PBM segment, see Note 13, “Segment and Geographic Data,” to our audited
consolidated financial statements included in Part II, Item 8 of this Annual Report on Form 10-K.

  Specialty Pharmacy Segment
     The Specialty Pharmacy segment includes the sale of higher-margin specialty pharmacy products and services
for the treatment of chronic and complex (potentially life-threatening) diseases. The following table presents selected
Specialty Pharmacy segment comparative results of operations ($ in millions):
                               December 26,                            December 27,                         December 29,
For Fiscal Years Ended             2009               Variance             2008              Variance          2007(1)
Product net revenues . .        $9,435.2      $1,537.5        19.5%     $7,897.7      $1,917.2      32.1%    $5,980.5
Service revenues . . . . .          92.3          15.8        20.7%         76.5          14.3      23.0%        62.2
Total net revenues . . . .       9,527.5          1,553.3     19.5%      7,974.2          1,931.5   32.0%     6,042.7
Total cost of
  revenues . . . . . . . . .     8,825.7          1,482.3     20.2%      7,343.4          1,780.2   32.0%     5,563.2
                      (2)
Total gross margin . .          $ 701.8       $     71.0      11.3%     $ 630.8       $ 151.3       31.6%    $ 479.5
Gross margin
  percentage. . . . . . . .          7.4%            (0.5)%                  7.9%             —                   7.9%
Selling, general and
  administrative
  expenses . . . . . . . . .      297.2              (7.8)    (2.6)%      305.0             75.2    32.7%      229.8
Amortization of
  intangibles . . . . . . .         47.5              2.9     6.5%          44.6              5.1   12.9%        39.5
Operating income . . . .        $ 357.1       $     75.9      27.0%     $ 281.2       $     71.0    33.8%    $ 210.2
(1)
      Includes Critical Care’s operating results commencing on the November 14, 2007 acquisition date, and for the
      subsequent periods.
(2)
      Defined as net revenues minus cost of revenues.
     Specialty Pharmacy total net revenues of $9,527.5 million for 2009 increased $1,553.3 million compared to
revenues of $7,974.2 million for 2008, primarily reflecting new clients. Specialty Pharmacy total net revenues of
$7,974.2 million for 2008 increased $1,931.5 million compared to revenues of $6,042.7 million for 2007. The
increase primarily results from higher mail-order revenues reflecting new clients, as well as incremental revenues
resulting from the Critical Care acquisition.
     Gross margin was 7.4% of net revenues for 2009 compared to 7.9% of net revenues for 2008, primarily
reflecting channel mix from significant new business wins. Gross margin was 7.9% of net revenues for 2008,
consistent with 2007, primarily reflecting higher margins associated with the Critical Care product line, offset by
lower margins associated with new client mix.
     SG&A expenses of $297.2 million for 2009 decreased $7.8 million compared to 2008, primarily reflecting
lower technology, marketing and employee-related expenses. SG&A expenses of $305.0 million for 2008 increased
$75.2 million compared to 2007. This increase primarily reflects SG&A expenses associated with Critical Care, as
well as higher employee-related expenses. Amortization of intangible assets was $47.5 million for 2009, $44.6 mil-
lion for 2008, and $39.5 million for 2007, and reflects the additional intangible asset amortization associated with
the Critical Care acquisition.


                                                                 52
Operating income of $357.1 million for 2009 increased $75.9 million, or 27.0%, compared to operating income
of $281.2 million for 2008. Operating income of $281.2 million for 2008 increased $71.0 million, or 33.8%,
compared to operating income of $210.2 million for 2007. The increases in operating income resulted from the
aforementioned factors.
     See Note 13, “Segment and Geographic Data,” to our audited consolidated financial statements included in
Part II, Item 8 of this Annual Report on Form 10-K for additional information.

Liquidity and Capital Resources
   Cash Flows
       The following table presents selected data from our consolidated statements of cash flows ($ in millions):
                                                                     December 26,                  December 27,                 December 29,
For Fiscal Years Ended                                                   2009          Variance       2008(1)     Variance         2007(2)
Net cash provided by operating activities . . . . . .                 $ 3,501.4        $ 1,866.3    $ 1,635.1     $     268.1    $ 1,367.0
Net cash used by investing activities . . . . . . . . .                  (305.0)           111.2       (416.2)        1,297.6     (1,713.8)
Net cash (used by) provided by financing
  activities . . . . . . . . . . . . . . . . . . . . . . . . . . .     (1,606.6)         (552.0)     (1,054.6)     (1,357.0)         302.4
Net increase (decrease) in cash and cash
  equivalents . . . . . . . . . . . . . . . . . . . . . . . . .         1,589.8         1,425.5         164.3          208.7         (44.4)
Cash and cash equivalents at beginning of year . .                        938.4           164.3         774.1          (44.4)        818.5
Cash and cash equivalents at end of year . . . . . .                  $ 2,528.2        $ 1,589.8    $   938.4     $    164.3     $   774.1

 (1)
       Includes majority-owned Europa Apotheek’s operating results commencing on the April 28, 2008 acquisition
       date, and for the subsequent period.
 (2)
       Includes PolyMedica’s and Critical Care’s operating results commencing on the October 31, 2007 and Novem-
       ber 14, 2007 acquisition dates, respectively, and for the subsequent period.
      Operating Activities. Net cash provided by operating activities of $3,501.4 million for 2009 reflects net income
of $1,280.3 million, with non-cash adjustments for depreciation and amortization of $484.6 million and stock-based
compensation of $146.0 million. In addition, there were net cash inflows of $571.4 million from a decrease in
inventories, net, reflecting initiatives to optimize inventory levels. Net cash flows from operating activities for 2009
includes net cash inflows of $93.4 million from a decrease in manufacturer accounts receivable, net, due to
initiatives to improve working capital management, partially offset by business growth of approximately $200 mil-
lion. Additionally, there were net cash inflows of $627.2 million and $448.2 million from increases in claims and
other accounts payable and client rebates and guarantees payable, respectively, partially offset by net cash outflows
of $515.4 million from an increase in client accounts receivable, net, all of which were primarily due to increased
prescription volume associated with business growth. There were also net cash inflows of $259.6 million from a
decrease in prepaid expenses and other current assets primarily due to the timing of a prepaid client rebate.
     The $1,866.3 million increase in net cash provided by operating activities for 2009 compared to 2008 is
primarily due to an increase in cash flows of $478.4 million from inventories, net, reflecting initiatives to optimize
inventory levels, and an increase in cash flows of $434.6 million from manufacturer accounts receivable, net,
reflecting initiatives to improve working capital management. In addition, there were increased cash flows of
$572.9 million from claims and other accounts payable reflecting higher retail volumes and business growth, and
increased cash flows of $299.3 million from the timing of a prepaid client rebate.
     Net cash provided by operating activities of $1,635.1 million for 2008 reflects net income of $1,102.9 million,
with non-cash adjustments for depreciation and amortization of $442.8 million and stock-based compensation of
$131.7 million. Additionally, there were net cash inflows of $566.5 million for client rebates and guarantees payable
reflecting increased client rebate pass-back liabilities associated with business growth and net cash inflows of
$93.0 million from a decrease in inventories, net, reflecting initiatives to optimize inventory levels. These increases
were partially offset by net cash outflows of $418.5 million and $341.2 million associated with increases in client
accounts receivable, net, and manufacturer accounts receivable, net, respectively, reflecting increased prescription
volume associated with business growth. The $268.1 million increase in net cash provided by operating activities in
2008 compared to 2007 is primarily due to increased net income of $190.9 million. Also contributing to the increase
in net cash provided by operating activities in 2008 are increases in cash inflows of $57.0 million from an increase
in amortization of intangibles, and a net increase in cash inflows of $23.0 million from higher stock-based
compensation on employee stock plans and related tax benefits.


                                                                                  53
Investing Activities. The net cash used by investing activities of $305.0 million for 2009 is primarily attributable
to capital expenditures of $238.8 million associated with capitalized software development in connection with client-
related programs and our Medicare PDP product offerings, technology and pharmacy operations hardware
investments, and capital expenditures associated with the construction of our third automated dispensing pharmacy
in Whitestown, Indiana. In addition, we had purchases of securities and other assets of $153.4 million, $63.0 million
of which represents a diabetes patient list acquired in the first quarter of 2009. These cash outflows were partially
offset by proceeds from the sale of securities and other investments of $87.2 million. The $111.2 million decrease in
net cash used by investing activities for 2009 compared to 2008 is primarily due to cash paid of $126.5 million, net
of cash acquired, for the acquisition of a majority interest in Europa Apotheek in the second quarter of 2008, a
decrease in capital expenditures of $48.1 million, partially offset by the $63.0 million diabetes patient list
acquisition.
     The net cash used by investing activities of $416.2 million for 2008 is primarily attributable to capital
expenditures of $286.9 million associated with capitalized software development in connection with client-related
programs and our Medicare PDP product offerings, technology and pharmacy operations hardware investments,
including those associated with the construction of our third automated dispensing pharmacy in Whitestown, Indiana.
Additionally, net cash used by investing activities includes cash paid of $126.5 million, net of cash acquired, to
acquire a majority interest in Europa Apotheek. The $1,297.6 million decrease in net cash used by investing
activities in 2008 compared to 2007 is primarily due to our acquisitions of PolyMedica and Critical Care in 2007.
     Purchases of and proceeds from securities, which relate to investment activities of our insurance companies, are
balanced in all years presented.
      Financing Activities. The net cash used by financing activities of $1,606.6 million for 2009 primarily results
from $1,238.5 million in share repurchases and $600 million in repayments under our accounts receivable financing
facility, partially offset by net proceeds from employee stock plans of $152.2 million and excess tax benefits from
stock-based compensation arrangements of $64.3 million. The increase in net cash used by financing activities of
$552.0 million for 2009 compared to 2008 primarily results from lower net proceeds from debt of $1,669.9 million,
partially offset by lower share repurchases of $947.6 million, higher net proceeds from employee stock plans of
$91.6 million and $45.4 million recorded in the first quarter of 2008 for the settlement of a cash flow hedge that we
entered into in December 2007 described under “—Liquidity and Capital Resources—Financing Facilities—Swap
Agreements” below.
     The net cash used by financing activities of $1,054.6 million for 2008 primarily results from $2,186.1 million
in share repurchases, $2,210.0 million of repayments under our revolving credit facility, partially offset by proceeds
from long-term debt of $3,295.7 million. Proceeds from long-term debt of $3,295.7 million for 2008 include
proceeds of $1,485.7 million from our underwritten public offering of senior notes discussed below and proceeds
from our revolving credit facility of $1,810.0 million. Net cash used by financing activities also includes the
$45.4 million settlement of the cash flow hedge, as well as proceeds from employee stock plans of $60.6 million
and excess tax benefits from stock-based compensation arrangements of $41.8 million.
     The increase in net cash used by financing activities of $1,357.0 million in 2008 compared to 2007 primarily
results from higher repayments on debt of $1,521.6 million, an increase in share repurchases of $225.5 million, a
decrease in proceeds from employee stock plans of $147.7 million, and the $45.4 million settlement of the cash
flow hedge, partially offset by higher net proceeds from debt of $620.7 million.
     On March 18, 2008, we completed an underwritten public offering of $300 million aggregate principal amount
of 5-year senior notes at a price to the public of 99.425 percent of par value, and $1.2 billion aggregate principal
amount of 10-year senior notes at a price to the public of 98.956 percent. The 5-year senior notes bear interest at a
rate of 6.125% per annum, with an effective interest rate of 6.261%, and mature on March 15, 2013. The 10-year
senior notes bear interest at a rate of 7.125% per annum, with an effective interest rate of 7.274%, and mature on
March 15, 2018. Medco may redeem all or part of these notes at any time or from time to time at its option at a
redemption price equal to the greater of (i) 100% of the principal amount of the notes being redeemed plus accrued
and unpaid interest to the redemption date or (ii) a “make-whole” amount based on the yield of a comparable
U.S. Treasury security plus 50 basis points. We pay interest on both series of senior notes semi-annually on March
15 and September 15 of each year. We used the net proceeds from the sale of these senior notes to repay borrowings
under our revolving credit facility used to fund the acquisitions of PolyMedica and Critical Care in 2007, which are
described in Note 3, “Acquisitions of Businesses,” to our audited consolidated financial statements included in Part II,
Item 8 of this Annual Report on Form 10-K.


                                                           54
Total cash and short-term investments as of December 26, 2009 were $2,548.3 million, including $2,528.2 mil-
lion in cash and cash equivalents. Total cash and short-term investments as of December 27, 2008 were
$1,002.4 million, including $938.4 million in cash and cash equivalents. The increase of $1,545.9 million in cash
and short-term investments in 2009 primarily reflects the aforementioned components impacting increased cash
flows from operations, partially offset by the use of cash associated with share repurchase activity.

Looking Forward
     We believe that our current liquidity and prospects for strong cash flows from operations by improved working
capital management assist in limiting the effects on our business from the weaker economy. At the end of fiscal year
2009, we had additional committed borrowing capacity under our revolving credit facility of approximately $1 billion
and have no required long-term debt payments until 2012. Additionally, we have additional borrowing capacity of
$600 million from our 364-day accounts receivable financing facility, which is renewable annually at the option of
both Medco and the banks and was renewed on July 27, 2009. In fiscal year 2009, we experienced increased cash
flow from operations representing our strong operating performance, as well as significant improvements in working
capital. For 2010, we anticipate that our cash flow from operations will decrease from 2009 as our residual working
capital opportunities are not as great.
     Our December 26, 2009 cash balance increased to $2,528.2 million from $938.4 million at December 27, 2008.
Since 2005, we have executed share repurchases of 186.3 million shares at a cost of $6.9 billion through our share
repurchase programs. We currently have a $3 billion share repurchase plan, which expires in November 2010, with
$1.6 billion remaining as of December 26, 2009. From time to time, we may make additional share repurchases,
which we intend to fund with our free cash flow (cash flow from operations less capital expenditures). For our cash
on hand, any investments we make are within approved investing guidelines and we continue to monitor ongoing
events and make investment decisions accordingly.
      We anticipate that our 2010 capital expenditures, for items such as capitalized software development for
strategic initiatives, infrastructure enhancements, and the completion of our third automated dispensing pharmacy in
Whitestown, Indiana, will be approximately $225 million. We expect that capital expenditures will be funded by our
cash flows from operations.
     We have clients in various industries, including the automobile manufacturer industry and the financial industry,
as well as governmental agencies. We actively monitor the status of our accounts receivable and have mechanisms
in place to minimize the potential for incurring material accounts receivable credit risk. To date, we have not
experienced any significant deterioration in our client or manufacturer rebates accounts receivables.
      We believe the oversight of the investments held under our pension plans is rigorous and the investment
strategies are prudent. The fair value of our pension plan assets increased from $119.2 million at the end of 2008 to
$147.6 million at the end of 2009 primarily resulting from investment gains. The investment gains were partially
offset by increased benefit obligations related to the 2009 benefit accrual and resulted in a decrease in the pension
plans’ unfunded status from $73.7 million at fiscal year-end 2008 to $66.9 million at fiscal year-end 2009 and a
decrease of $28.5 million pre-tax, reflected in comprehensive income in stockholders’ equity. This decrease in
unfunded status did not have an impact on the consolidated statement of income for 2009. Net actuarial gains and
losses, in excess of certain thresholds, are amortized into the consolidated statement of income over the 12-year
average remaining service life of participants. We estimate the 2010 net periodic benefit cost for our pension plans
to be included in our consolidated statement of income will be approximately $30 million.


                                                         55
We currently have no plans to pay cash dividends in the foreseeable future.

Financing Facilities
  Five-Year Credit Facilities
     We have senior unsecured bank credit facilities consisting of a $1 billion, 5-year senior unsecured term loan
and a $2 billion, 5-year senior unsecured revolving credit facility. The term loan matures on April 30, 2012, at
which time the entire facility is required to be repaid. If there are pre-payments on the term loan prior to the
maturity date, that portion of the loan would be extinguished. At our current debt ratings, the credit facilities bear
interest at London Interbank Offered Rate (“LIBOR”) plus a 0.45 percent margin, with a 10 basis point commitment
fee due on the unused portion of the revolving credit facility.
    The outstanding balance under the revolving credit facility was $1.0 billion as of December 26, 2009 and
December 27, 2008. There was no activity under the revolving credit facility during 2009. As of December 26,
2009, we had $993 million available for borrowing under our revolving credit facility, after giving effect to prior net
draw-downs of $1 billion and $7 million in issued letters of credit.
     During 2008, our net borrowings under the revolving credit facility decreased by approximately $400 million,
consisting of repayments of $2.2 billion and draw-downs of $1.8 billion. As a result of this activity, the revolving
credit facility’s outstanding balance decreased from $1.4 billion at fiscal year-end 2007 to $1.0 billion as of
December 27, 2008. As of December 27, 2008, we had $987 million available for borrowing under our revolving
credit facility, after giving effect to prior net draw-downs of $1 billion and $13 million in issued letters of credit.
The revolving credit facility is available through April 30, 2012.

  Accounts Receivable Financing Facility and Other Short-Term Debt
      Through a wholly-owned subsidiary, we have a $600 million, 364-day renewable accounts receivable financing
facility that is collateralized by our pharmaceutical manufacturer rebates accounts receivable. During 2009, we
repaid the entire $600 million outstanding balance, which resulted in no amounts outstanding and $600 million
available for borrowing under the facility at December 26, 2009. At December 27, 2008, there was $600 million
outstanding with no additional amounts available for borrowing under the facility. We pay interest on amounts
borrowed under the agreement based on the funding rates of the bank-related commercial paper programs that
provide the financing, plus an applicable margin and liquidity fee determined by our credit rating. The weighted
average annual interest rate on amounts outstanding under the facility at December 27, 2008 was 3.10%. This
facility is renewable annually at the option of both Medco and the banks and was renewed on July 27, 2009.
Amounts outstanding under the accounts receivable financing facility are classified as short-term debt on our
consolidated balance sheets. Additionally, we have short-term debt of $15.8 million outstanding as of December 26,
2009 under an $18.7 million short-term revolving credit facility. The weighted average annual interest rate on
amounts outstanding under the short-term revolving credit facility at December 26, 2009 was 1.58%.

  Interest Rates
      The weighted average annual interest rate on our indebtedness was approximately 3.8% for 2009, 5.1% for
2008 and 6.3% for 2007 and reflects variability in floating interest rates on the senior unsecured bank credit
facilities, swap agreements and the accounts receivable financing facility. Several factors could change the weighted
average annual interest rate, including but not limited to a change in our debt ratings, reference rates used under our
bank credit facility and accounts receivable financing facility, swap agreements and the mix of our debt.


                                                           56
Swap Agreements
     On December 12, 2007, we entered into forward-starting interest rate swap agreements in contemplation of the
issuance of long-term fixed-rate financing. We entered into these cash flow hedges to manage our exposure to
changes in benchmark interest rates and to mitigate the impact of fluctuations in the interest rates prior to the
issuance of the long-term financing. The cash flow hedges entered into were for a notional amount of $500 million
on the then-current 10-year treasury interest rate, and for a notional amount of $250 million on the then-current
30-year treasury interest rate, both with a settlement date of March 31, 2008. At the time of purchase, the cash flow
hedges were anticipated to be effective in offsetting the changes in the expected future interest rate payments on the
proposed debt offering attributable to fluctuations in the treasury benchmark interest rate.
     In connection with the issuance of the 5-year senior notes and 10-year senior notes described above, a portion
of the $250 million notional amount 30-year treasury interest rate cash flow hedge was deemed an ineffective hedge.
The cash flow hedges were settled on March 17, 2008 for $45.4 million and included the ineffective portion that
was recorded as an increase of $9.8 million to interest (income) and other (income) expense, net, for the year ended
December 27, 2008. The effective portion was recorded in accumulated other comprehensive income and is
reclassified to interest expense over the ten-year period in which we hedged our exposure to variability in future
cash flows. The unamortized effective portion reflected in accumulated other comprehensive loss as of December 26,
2009 and December 27, 2008 was $18.1 million and $20.0 million, net of tax, respectively.
     In 2004, we entered into five interest rate swap agreements on $200 million of the $500 million in 7.25% senior
notes due in 2013. These swap agreements were entered into as an effective hedge to (i) convert a portion of the
senior note fixed rate debt into floating rate debt; (ii) maintain a capital structure containing appropriate amounts of
fixed and floating rate debt; and (iii) lower the interest expense on these notes in the near term. The fair value of
our obligation under our interest rate swap agreements, represented net receivables of $14.0 million and $18.4 million
as of December 26, 2009 and December 27, 2008, respectively, which are reported in other noncurrent assets, with
offsetting amounts recorded in long-term debt, net, on our consolidated balance sheets. We do not expect our future
cash flows to be affected to any significant degree by a sudden change in market interest rates.

  Covenants
     All of the senior notes discussed above are subject to customary affirmative and negative covenants, including
limitations on sale/leaseback transactions; limitations on liens; limitations on mergers and similar transactions; and a
covenant with respect to certain change of control triggering events. The 6.125% senior notes and the 7.125% senior
notes are also subject to an interest rate adjustment in the event of a downgrade in the ratings to below investment
grade. In addition, the senior unsecured bank credit facilities and the accounts receivable financing facility are
subject to covenants, including, among other items, maximum leverage ratios. We were in compliance with all
covenants at December 26, 2009 and December 27, 2008.

  Debt Ratings
    Medco’s debt ratings, all of which represent investment grade, reflect the following as of the filing date of this
Annual Report on Form 10-K: Moody’s Investors Service, Baa3; Standard & Poor’s, BBB; Fitch Ratings, BBB.

EBITDA
     We calculate and use EBITDA and EBITDA per adjusted prescription as indicators of our ability to generate
cash from our reported operating results. These measurements are used in concert with net income and cash flows
from operations, which measure actual cash generated in the period. In addition, we believe that EBITDA and
EBITDA per adjusted prescription are supplemental measurement tools used by analysts and investors to help
evaluate overall operating performance and the ability to incur and service debt and make capital expenditures.
EBITDA does not represent funds available for our discretionary use and is not intended to represent or to be used
as a substitute for net income or cash flows from operations data as measured under U.S. generally accepted
accounting principles. The items excluded from EBITDA, but included in the calculation of reported net income, are
significant components of the consolidated statements of income and must be considered in performing a
comprehensive assessment of overall financial performance. EBITDA, and the associated year-to-year trends, should
not be considered in isolation. Our calculation of EBITDA may not be consistent with calculations of EBITDA used
by other companies.


                                                          57
EBITDA per adjusted prescription is calculated by dividing EBITDA by the adjusted prescription volume for
the period. This measure is used as an indicator of EBITDA performance on a per-unit basis, providing insight into
the cash-generating potential of each prescription. EBITDA, and as a result, EBITDA per adjusted prescription, are
affected by the changes in prescription volumes between retail and mail order, the relative representation of brand-
name, generic and specialty pharmacy drugs, as well as the level of efficiency in the business. Adjusted prescription
volume equals substantially all mail-order prescriptions multiplied by three, plus retail prescriptions. These mail-
order prescriptions are multiplied by three to adjust for the fact that they include approximately three times the
amount of product days supplied compared with retail prescriptions.
     The following table reconciles our reported net income to EBITDA and presents EBITDA per adjusted
prescription for each of the respective periods (in millions, except for EBITDA per adjusted prescription data):
                                                                                           December 26,   December 27,    December 29,
            For Fiscal Years Ended                                                             2009          2008(1)         2007(2)

            Net income . . . . . . . . . . . . . . . . . . . . . . . . . . . . . . .        $1,280.3       $1,102.9        $ 912.0
            Add:
              Interest expense . . . . . . . . . . . . . . . . . . . . . . . . . .             172.5          233.7           134.2
              Interest (income) and other (income) expense,
                 net . . . . . . . . . . . . . . . . . . . . . . . . . . . . . . . . . .        (9.9)          (6.2)(3)       (34.4)
              Provision for income taxes . . . . . . . . . . . . . . . . . .                   823.0(4)       687.9 (4)       591.3
              Depreciation expense . . . . . . . . . . . . . . . . . . . . . .                 179.0          157.7           168.9
              Amortization expense . . . . . . . . . . . . . . . . . . . . . .                 305.6          285.1           228.1
            EBITDA . . . . . . . . . . . . . . . . . . . . . . . . . . . . . . . . .        $2,750.5       $2,461.1        $2,000.1
            Adjusted prescriptions(5) . . . . . . . . . . . . . . . . . . . . .               898.8          795.9           748.3
            EBITDA per adjusted prescription . . . . . . . . . . . . . .                    $ 3.06         $ 3.09          $ 2.67
(1)
      Includes majority-owned Europa Apotheek’s operating results commencing on the April 28, 2008 acquisition date, and for
      the subsequent period.
(2)
      Includes PolyMedica’s and Critical Care’s operating results commencing on the October 31, 2007 and November 14, 2007
      acquisition dates, respectively, and for the subsequent periods.
(3)
      Includes a $9.8 million charge for the ineffective portion of the forward-starting interest rate swap agreements associated
      with the March 2008 issuance of senior notes. See Note 8,“Debt,” to our audited consolidated financial statements included
      in Part II, Item 8 of this Annual Report on Form 10-K.
(4)
      2009 and 2008 include tax benefits of $22 million and $28 million, respectively. See Note 10, “Taxes on Income,” to our
      audited consolidated financial statements included in Part II, Item 8 of this Annual Report on Form 10-K.
(5)
      Adjusted prescription volume equals substantially all mail-order prescriptions multiplied by three, plus retail prescriptions.
      These mail-order prescriptions are multiplied by three to adjust for the fact that they include approximately three times the
      amount of product days supplied compared with retail prescriptions.
      For 2009 compared to 2008, EBITDA increased by 11.8%, compared to an increase in net income of 16.1%,
and a decrease in EBITDA per adjusted prescription of 1.0%. The lower rate of increase for EBITDA compared
with net income primarily reflects the aforementioned lower interest expense, as well as the higher interest and other
income. The lower rate of increase for EBITDA per adjusted prescription compared to EBITDA reflects the higher
retail volumes, which are generally less profitable than mail order, and are driven by new business and results in an
overall higher retail mix in our prescription base.
     For 2008 compared to 2007, EBITDA increased by 23.0%, compared to increases in EBITDA per adjusted
prescription of 15.7% and net income of 20.9%. The higher rate of increase for EBITDA compared with net income
primarily reflects the aforementioned higher levels of interest expense and intangible asset amortization expense.
The lower rate of increase for EBITDA per adjusted prescription compared to EBITDA reflects the new client
volumes and the aforementioned Plavix» benefit primarily in the first quarter of 2007.


                                                                               58
Commitments and Contractual Obligations
     The following table presents our commitments and contractual obligations as of December 26, 2009, as well as
our long-term debt obligations ($ in millions):

                                                             Payments Due By Period
                                                                               Total        2010    2011-2012   2013-2014   Thereafter
                                    (1)
Long-term debt obligations . . . . . . . . . . . . . . . . . . . $4,000.0                  $ —      $2,000.0    $ 800.0     $1,200.0
Interest payments on long-term debt obligations(2) . . . .                     926.5        154.9      299.8      197.5        274.3
Operating lease obligations(3) . . . . . . . . . . . . . . . . . . .           159.3         50.9       73.5       20.2         14.7
                                                         (4)
Prescription drug purchase commitments . . . . . . . . .                       448.1        448.1         —          —            —
Other(5) . . . . . . . . . . . . . . . . . . . . . . . . . . . . . . . . . . . 151.8         66.6       59.1       26.1           —
Total . . . . . . . . . . . . . . . . . . . . . . . . . . . . . . . . . . . . . $5,685.7   $720.5   $2,432.4    $1,043.8    $1,489.0
(1)
      Long-term debt obligations exclude $13.9 million in total unamortized discounts on our 7.25%, 6.125% and 7.125% senior
      notes and the fair value of interest rate swap agreements of $14.0 million on $200 million of the $500 million in 7.25% senior
      notes.
(2)
      The variable component of interest expense for the senior unsecured credit facility is based on the December 2009 LIBOR.
      The LIBOR fluctuates and may result in differences in the presented interest expense on long-term debt obligations.
(3)
      Primarily reflects contractual operating lease commitments to lease pharmacy and call center pharmacy facilities, offices and
      warehouse space, as well as pill dispensing and counting devices and other operating equipment for use in our mail-order
      pharmacies and computer equipment for use in our data centers and corporate headquarters.
(4)
      Represents contractual commitments to purchase inventory from certain biopharmaceutical manufacturers associated with
      Accredo’s Specialty Pharmacy business consisting of a firm commitment of $324.6 million, and firm commitments for 2010 of
      $123.5 million with additional commitments through 2012 subject to price increases or variable quantities based on patient
      usage or days on hand.
(5)
      Consists of purchase commitments for diabetes supplies of $69.9 million, technology-related agreements of $44.0 million and
      advertising commitments of $11.8 million. Additionally, as part of the acquisition of a majority interest in Europa Apotheek,
      we have a purchase obligation of $26.1 million anticipated to be settled by 2014, which is included in other noncurrent lia-
      bilities on the audited consolidated balance sheet as of December 26, 2009.
     We have a remaining minimum pension funding requirement of $16.3 million under the Internal Revenue Code
(“IRC”) during 2010 for the 2009 plan year. From time to time, we make additional voluntary contributions within
the maximum deductible limits set by the IRS.
      As of December 26, 2009, we had letters of credit outstanding of approximately $7.0 million, which were
issued under our senior unsecured revolving credit facility as collateral for the deductible portion of our general
liability and workers’ compensation coverage.
     As of December 26, 2009, we have total gross liabilities for income tax contingencies of $99.9 million on our
consolidated balance sheet. The majority of the income tax contingencies are subject to statutes of limitations that
are scheduled to expire by the end of 2014. In addition, approximately 30% of the income tax contingencies are
anticipated to settle over the next twelve months.
    For additional information regarding operating lease obligations, long-term debt, pension and other postretire-
ment obligations, and information on deferred income taxes, see Notes 6, 8, 9 and 10, respectively, to our audited
consolidated financial statements included in Part II, Item 8 of this Annual Report on Form 10-K.

Off-Balance Sheet Arrangements
     We have no material off-balance sheet arrangements, other than purchase commitments and lease obligations.
See “—Commitments and Contractual Obligations” above.


                                                                            59
Interest Rate and Foreign Exchange Risk
     We have floating rate debt with our bank credit facility and accounts receivable financing facility, and
investments in marketable securities that are subject to interest rate volatility, which is our principal market risk. In
addition, we have interest rate swap agreements on $200 million of the $500 million in 7.25% senior notes. As a
result of these interest rate swap agreements, the $200 million of senior notes is subject to interest rate volatility. A
25 basis point change in the weighted average annual interest rate relating to the credit facilities’ balances
outstanding and interest rate swap agreements as of December 26, 2009, which are subject to variable interest rates
based on LIBOR, and the accounts receivable financing facility, which is subject to the commercial paper rate,
would yield a change of approximately $5.5 million in annual interest expense. We do not expect our future cash
flows to be affected to any significant degree by a sudden change in market interest rates.
     We operate our business primarily within the United States and execute the vast majority of our transactions in
U.S. dollars. However, as a result of our acquisition of a majority interest in Europa Apotheek, which is based in the
Netherlands, and our joint venture with United Drug plc, we are subject to foreign currency translation risk. This
foreign currency translation risk is not expected to have a material impact on our consolidated financial statements.

Share Repurchase Programs
     Since 2005, we have executed share repurchases of 186.3 million shares at a cost of $6.9 billion through our
share repurchase programs. We are authorized to repurchase our shares under a $3 billion share repurchase program
(the “2008 Program”), which was announced in November 2008 and expires in November 2010, with $1.6 billion
remaining under its current authorization as of December 26, 2009. During fiscal year 2009 under the 2008
Program, we repurchased 27.3 million shares at a total cost of $1.24 billion with an average per-share cost of
$45.38. In the fourth quarter 2008, we repurchased 5.2 million shares at a cost of $200 million under the 2008
Program. Since the inception of the 2008 Program, we have repurchased 32.4 million shares for a total cost of
$1.44 billion with an average per-share cost of $44.34.
     Our $5.5 billion share repurchase program which was approved in August 2005 (the “2005 Program”),
originally authorized share repurchases of $500 million and was increased at various times. We completed the 2005
Program in October 2008. During fiscal year 2008, we repurchased 42.4 million shares at a cost of $1.98 billion
under the 2005 Program.
     From time to time, we may make additional share repurchases, which we intend to fund with our free cash
flow (cash flow from operations less capital expenditures). Our Board of Directors periodically reviews our share
repurchase programs and approves the associated trading parameters.
    Also see Part II, Item 5, “Market for Registrant’s Common Equity, Related Shareholder Matters and Issuer
Purchases of Equity Securities,” for more information.

Use of Estimates and Critical Accounting Policies and Estimates
  Use of Estimates
     The preparation of consolidated financial statements requires companies to include certain amounts that are
based on management’s best estimates and judgments. In preparing the consolidated financial statements, manage-
ment reviewed its accounting policies and believes that these accounting policies are appropriate for a fair
presentation of our financial position, results of operations and of cash flows. Several of these accounting policies
contain estimates, the most significant of which are discussed below. Actual results may differ from those estimates,
and it is possible that future results of operations for any particular period could be materially affected by the
ultimate actual results. We discuss the impact and any associated risks related to these policies on our business
operations throughout this “Management’s Discussion and Analysis of Financial Condition and Results of
Operations” section.


                                                            60
Critical Accounting Policies and Estimates
     We describe below what we believe to be our critical accounting policies and estimates. (See also Note 2,
“Summary of Significant Accounting Policies,” to our audited consolidated financial statements included in Part II,
Item 8 of this Annual Report on Form 10-K.)
     Revenue Recognition. Our product net revenues are derived principally from sales of prescription drugs to our
clients and members, either through our networks of contractually affiliated retail pharmacies or through our mail-
order pharmacies. Product net revenues also include revenues from the sale of diabetes supplies by PolyMedica. Our
Specialty Pharmacy product net revenues represent revenues from the sale of primarily biopharmaceutical drugs and
are reported at the net amount billed to third-party payors and patients.
      We recognize product revenues when the prescriptions are dispensed through our networks of contractually
affiliated retail pharmacies or through our mail-order pharmacies and received by members and patients. We have
determined that our responsibilities under our client contracts to adjudicate member claims properly and control
clients’ drug spend, our separate contractual pricing relationships and responsibilities to the retail pharmacies in our
networks, and our interaction with clients’ members, among other indicators, qualify us as the principal under the
indicators set forth in Authoritative Guidance in most of our transactions with clients. Our responsibilities under our
client contracts include validating that the patient is a member of the client’s plan and that the prescription drug is
in the applicable formulary, instructing the pharmacist as to the prescription price and the co-payment due from the
patient who is a member of a client’s plan, identifying possible adverse drug interactions for the pharmacist to
address with the physician prior to dispensing, suggesting medically appropriate generic alternatives to control drug
cost to our clients and their members, and approving the prescription for dispensing. We recognize revenues from
our retail network contracts where we are the principal, and our mail-order pharmacies, on a gross reporting basis,
in accordance with Authoritative Guidance at the prescription price (ingredient cost plus dispensing fee) negotiated
with our clients, including the portion of the price to be settled directly by the member (co-payment) plus our
administrative fees. Although we generally do not have credit risk with respect to retail co-payments, all of the
above indicators of gross treatment are present. In addition, we view these co-payments as a plan design mechanism
that we evaluate in concert with our clients to help them manage their retained prescription drug spending costs, and
the level of co-payments does not affect our rebates or margin on the transaction. In the limited instances where the
terms of our contracts and nature of our involvement in the prescription fulfillment process do not qualify us as a
principal under Authoritative Guidance, our revenues on those transactions consist of the administrative fee paid to
us by our clients.
      We deduct from our revenues the manufacturers’ rebates that are earned by our clients based on their members’
utilization of brand-name formulary drugs. We estimate these rebates at period-end based on actual and estimated
claims data and our estimates of the manufacturers’ rebates earned by our clients. We base our estimates on the best
available data at period-end and recent history for the various factors that can affect the amount of rebates due to
the client. We adjust our rebates payable to clients to the actual amounts paid when these rebates are paid, generally
on a quarterly basis, or as significant events occur. We record any cumulative effect of these adjustments against
revenues as identified, and adjust our estimates prospectively to consider recurring matters. Adjustments generally
result from contract changes with our clients, differences between the estimated and actual product mix subject to
rebates or whether the product was included in the applicable formulary. Historically, the effect of these adjustments
has not been material to our results of operations. We also deduct from our revenues discounts offered and
guarantees regarding the level of service we will provide to the client or member or the minimum level of rebates or
discounts the client will receive, as well as other payments made to our clients. Other payments include, for
example, implementation allowances and payments related to performance guarantees. Where we provide implemen-
tation or other allowances to clients upon contract initiation, we capitalize these payments and amortize them,
generally on a straight-line basis, over the life of the contract as a reduction of revenue. These payments are
capitalized only in cases where they are refundable upon cancellation or relate to noncancelable contracts.


                                                          61
Our product net revenues also include premiums associated with our Medicare PDP risk-based product
offerings. These products involve prescription dispensing for beneficiaries enrolled in the CMS-sponsored Medicare
Part D prescription drug benefit. Our two insurance company subsidiaries have been operating under contracts with
CMS since 2006, and currently offer several Medicare PDP options. The products involve underwriting the benefit,
charging enrollees applicable premiums, providing covered prescription drugs and administering the benefit as filed
with CMS. We provide three Medicare drug benefit plan options for beneficiaries, including (i) a “standard Part D”
benefit plan as mandated by statute, and (ii) two benefit plans with enhanced coverage, that exceed the standard
Part D benefit plan, available for an additional premium. We also offer numerous customized benefit plan designs to
employer group retiree plans under the Medicare Part D prescription drug benefit.
      The PDP premiums are determined based on our annual bid and related contractual arrangements with CMS.
The PDP premiums are primarily comprised of amounts received from CMS as part of a direct subsidy and an
additional subsidy from CMS for low-income member premiums, as well as premium payments received from
members. These premiums are recognized ratably to product net revenues over the period in which members are
entitled to receive benefits. Premiums received in advance of the applicable benefit period are deferred and recorded
in accrued expenses and other current liabilities on the consolidated balance sheets. There is a possibility that the
annual costs of drugs may be higher or lower than premium revenues. As a result, CMS provides a risk corridor
adjustment for the standard drug benefit that compares our actual annual drug costs incurred to the targeted
premiums in our CMS-approved bid. Based on specific collars in the risk corridor, we will receive from CMS
additional premium amounts or be required to refund to CMS previously received premium amounts. We calculate
the risk corridor adjustment on a quarterly basis based on drug cost experience to date and record an adjustment to
product net revenues with a corresponding account receivable from or payable to CMS reflected on the consolidated
balance sheets.
     In addition to premiums, there are certain co-payments and deductibles (the “cost share”) due by members
based on prescription orders by those members, some of which are subsidized by CMS in cases of low-income
membership. For subsidies received in advance, the amount is deferred and recorded in accrued expenses and other
current liabilities on the consolidated balance sheets. If there is cost share due from members or CMS, the amount is
accrued and recorded in client accounts receivable, net, on the consolidated balance sheets. After the end of the
contract year and based on actual annual drug costs incurred, cost share amounts are reconciled with CMS and the
corresponding receivable or payable is settled. The cost share is treated consistently as other co-payments derived
from providing PBM services, as a component of product net revenues on the consolidated statements of income
where the requirements of Authoritative Guidance are met. For further details, see Note 2, “Summary of Significant
Accounting Policies,” to our audited consolidated financial statements included in Part II, Item 8 of this Annual
Report on Form 10-K. Premium revenues for our PDP products, which exclude member cost share, were
$543 million, or less than 1% of total net revenues, in 2009, $317 million, or less than 1% of total net revenues, in
2008, and $255 million, or less than 1% of total net revenues, in 2007.
      Our agreements with CMS, as well as applicable Medicare Part D regulations and federal and state laws,
require us to, among other obligations: (i) comply with certain disclosure, filing, record-keeping and marketing
rules; (ii) operate quality assurance, drug utilization management and medication therapy management programs;
(iii) support e-prescribing initiatives; (iv) implement grievance, appeals and formulary exception processes; (v) com-
ply with payment protocols, which include the return of overpayments to CMS and, in certain circumstances,
coordination with state pharmacy assistance programs; (vi) use approved networks and formularies, and provide
access to such networks to “any willing pharmacy;” (vii) provide emergency out-of-network coverage; and
(viii) adopt a comprehensive Medicare and Fraud, Waste and Abuse compliance program. We have various
contractual and regulatory compliance requirements associated with participating in Medicare Part D. Similar to our
requirements with other clients, our policies and practices associated with executing our PDP are subject to audit. If
material contractual or regulatory non-compliance was to be identified, monetary penalties and/or applicable
sanctions, including suspension of enrollment and marketing or debarment from participation in Medicare programs,
may be imposed. Additionally, each calendar year, payment will vary based on the annual benchmark that applies as
a result of Medicare Part D plan bids for the applicable year, as well as for changes in the CMS methodology for
calculating risk adjustment factors.
     Service revenues consist principally of administrative fees and clinical program fees earned from clients, sales
of prescription services to pharmaceutical manufacturers, performance-oriented fees paid by Specialty Pharmacy
manufacturers, and other non-product-related revenues. Service revenues are recorded when performance occurs and
collectibility is assured.


                                                         62
Rebates Receivable and Payable. Rebates receivable from pharmaceutical manufacturers are earned based upon
the dispensing of prescriptions at either pharmacies in our retail networks or our mail-order pharmacies, are recorded
as a reduction of cost of revenues and are included in manufacturer accounts receivable, net. We accrue rebates
receivable by multiplying estimated rebatable prescription drugs dispensed by the pharmacies in our retail networks,
or dispensed by our mail-order pharmacies, by the contractually agreed manufacturer rebate amount, which in
certain cases may be based on estimated market share data. We revise rebates receivable estimates to actual, with
the difference recorded to cost of revenues, when third-party market share data is available and final rebatable
prescriptions are calculated, and rebates are billed to the manufacturer, generally 20 to 90 days subsequent to the
end of the applicable quarter. Historically, the effect of adjustments resulting from the reconciliation of our estimated
rebates recognized and recorded to actual amounts billed has not been material to our results of operations. Rebates
payable to clients are estimated and accrued based upon the prescription drugs dispensed by the pharmacies in our
retail networks or by our mail-order pharmacies. Rebates are generally settled on a quarterly basis with clients in the
form of an invoice credit, check or wire after collection of rebates receivable from manufacturers, at which time
rebates payable are revised to reflect amounts due.
     Client Accounts Receivable, Net. Client accounts receivable, net, includes billed and estimated unbilled
receivables from clients for the PBM and Specialty Pharmacy segments. Unbilled PBM receivables are primarily
from clients and are typically billed within 14 days based on the contractual billing schedule agreed upon with each
client. At the end of any given reporting period, unbilled PBM receivables from clients may represent up to two
weeks of dispensing activity and will fluctuate at the end of a fiscal month depending on the timing of these billing
cycles. Client accounts receivable, net, also includes a reduction for rebates and guarantees payable to clients when
such are settled on a net basis in the form of an invoice credit. In cases where rebates and guarantees are settled
with the client on a net basis, and the rebates and guarantees payable are greater than the corresponding client
accounts receivable balances, the net liability is reclassified to client rebates and guarantees payable on the
consolidated balance sheets. When these payables are settled in the form of a check or wire, they are recorded on a
gross basis and the entire liability is reflected in client rebates and guarantees payable on the consolidated balance
sheets. Our client accounts receivable also includes receivables from CMS for our Medicare Part D product offerings
and premiums from members. A component of the PBM business includes diabetes supplies dispensed by
PolyMedica with the associated receivables primarily reimbursed from insurance companies and government
agencies. As a result, this component of the PBM business experiences slower accounts receivable turnover.
     Allowance for Doubtful Accounts. We estimate the allowance for doubtful accounts for our PBM and Specialty
Pharmacy segments based upon a variety of factors, including the age of the outstanding receivables, trends of cash
collections and bad debt write-offs, recent economic factors, and our historical experience of collecting the patient
co-payments and deductibles. When circumstances related to specific collection patterns change, estimates of the
recoverability of receivables are adjusted. The allowance associated with the majority of our PBM segment has
historically been negligible because of the contractual obligation for clients to pay outstanding accounts receivable
in short duration. The allowance for our PBM segment also reflects amounts associated with member premiums for
our Medicare Part D product offerings and amounts related to PolyMedica for diabetes supplies, which are primarily
reimbursed by insurance companies and government agencies.
     The relatively higher allowance for the Specialty Pharmacy segment reflects a different credit risk profile than
the PBM business, and is characterized by reimbursement through medical coverage, including government agencies,
and higher patient co-payments. The products and services are often covered through medical benefit programs with
the primary payors being insurance companies and government programs. These payors typically have a longer
claims processing cycle and the ultimate payor may not be initially identified until after several reviews by
government and private payors. Additionally, patient co-payments and deductibles are typically higher reflecting the
higher product costs.


                                                           63
Income Taxes. Deferred tax assets and liabilities are recorded based on temporary differences between the
financial statement basis and the tax basis of assets and liabilities using presently enacted tax rates. On December 31,
2006, the first day of our 2007 fiscal year, we adopted the provisions of a new Financial Accounting Standards
Board (“FASB”) standard, which clarifies the accounting for uncertainty in income taxes recognized in companies’
financial statements. The standard prescribes a recognition threshold and measurement attribute for the financial
statement recognition and measurement of a tax position taken or expected to be taken in a tax return.
     Goodwill and Intangible Assets. Goodwill primarily represents, for our PBM segment, the excess of acquisition
costs over the fair value of our net assets that had been pushed down to our consolidated balance sheets and existed
when we became an independent, publicly traded enterprise in 2003, and, to a significantly lesser extent, our
acquisition of a majority interest in Europa Apotheek in 2008, and our acquisitions of PolyMedica in 2007 and
ProVantage Health Services, Inc. in 2000. Goodwill also includes, for our Specialty Pharmacy segment, a portion of
the excess of the purchase price we paid to acquire Accredo over the fair value of tangible net assets acquired, as
well as, to a significantly lesser extent, our acquisition of Critical Care in 2007, and the acquisition of the selected
assets of Pediatric Services of America, Inc. in 2005. Goodwill is assessed for impairment annually for each of our
segment’s reporting units. This assessment includes comparing the fair value of each reporting unit to the carrying
value of the assets assigned to the reporting unit. If the carrying value of the reporting unit were to exceed our
estimate of fair value of the reporting unit, we would then be required to estimate the fair value of the individual
assets and liabilities within the reporting unit to ascertain the fair value of goodwill. We would be required to record
an impairment charge to the extent recorded goodwill exceeds the fair value amount of goodwill resulting from this
allocation. The most recent assessment for impairment of goodwill for each of the designated reporting units was
performed as of September 26, 2009, and the goodwill was determined not to be impaired, and there have been no
significant subsequent changes in events or circumstances.
     Our intangible assets for our PBM segment primarily represent the value of Medco’s client relationships that
had been pushed down to our consolidated balance sheets and existed when we became an independent, publicly
traded enterprise in 2003 and to a lesser extent, intangible assets recorded upon our acquisitions of PolyMedica in
2007 and a majority stake in Europa Apotheek in 2008. For our Specialty Pharmacy segment, we have intangible
assets recorded primarily from our acquisition of Accredo in 2005. Our intangible assets are reviewed for
impairment whenever events, such as losses of significant clients or specialty product manufacturer contracts, or
when other changes in circumstances indicate the carrying amount may not be recoverable. When these events
occur, we compare the carrying amount of the assets to the undiscounted pre-tax expected future cash flows derived
from the lowest appropriate asset grouping. If this comparison indicates that impairment exists, the amount of the
impairment would be calculated using discounted expected future cash flows. The Liberty trade name intangible
asset was assigned an indefinite life at the time of our acquisition of PolyMedica in 2007. Subsequently in 2008,
management determined that the Liberty trade name intangible asset was no longer indefinite-lived and assigned a
35-year useful life.
      As of December 26, 2009, the weighted average useful life of intangible assets subject to amortization is
23 years in total. The weighted average useful life is approximately 23 years for the PBM client relationships and
approximately 21 years for the Specialty Pharmacy segment-acquired intangible assets. We expense the costs to
renew or extend contracts associated with intangible assets in the period the costs are incurred. For PBM client
relationships, the weighted average contract period prior to the next renewal date as of December 26, 2009 is
approximately 2.1 years. We have experienced client retention rates of over 98% for the past two years.
     Pension and Other Postretirement Benefit Plans. The determination of our obligation and expense for pension
and other postretirement benefits is based on management’s assumptions, which are developed with the assistance of
actuaries, including an appropriate discount rate, expected long-term rate of return on plan assets, and rates of
increase in compensation and healthcare costs.
      We reassess our benefit plan assumptions on a regular basis. For both the pension and other postretirement
benefit plans, the discount rate is determined annually and is evaluated and modified to reflect at the end of our
fiscal year the prevailing market rate of a portfolio of high-quality corporate bond investments that would provide
the future cash flows needed to settle benefit obligations as they come due. At December 26, 2009, the discount rate
utilized was 5.70% for our pension plans, and 5.85% for our other postretirement benefit plans.


                                                          64
The expected rate of return for the pension plan represents the average rate of return to be earned on the plan
assets over the period the benefits included in the benefit obligation are to be paid. The expected return on plan
assets is determined by multiplying the expected long-term rate of return by the fair value of the plan assets and
contributions, offset by expected return on expected benefit payments. In developing the expected rate of return, we
consider long-term compounded annualized returns of historical market data, as well as historical actual returns on
our plan assets. Using this reference information, we develop forward-looking return expectations for each asset
category and a weighted average expected long-term rate of return for a targeted portfolio allocated across these
investment categories. As a result of this analysis, for 2010, the expected rate of return assumption will be 8.0% for
our pension plan.
     Actuarial assumptions are based on management’s best estimates and judgment. The following analysis
indicates the sensitivity of pension and postretirement benefit costs for the year ending December 26, 2009 and
associated obligation balances as of fiscal year-end 2009, to changes in rate assumptions. A reasonably possible
increase of 50 basis points in the assumed discount rate, with other assumptions held constant, would have decreased
net pension and postretirement benefit cost by an estimated $1.7 million, and would have decreased the year-end
benefit obligations by approximately $11.8 million. A reasonably possible decrease of 50 basis points in the
assumed discount rate, with other assumptions held constant, would have increased net pension and postretirement
benefit cost by an estimated $1.7 million, and would have increased the year-end benefit obligations by
approximately $12.3 million. A reasonably possible increase of 50 basis points in the expected rate of return
assumption, with other assumptions held constant, would have decreased net pension cost by an estimated
$0.7 million. A reasonably possible decrease of 50 basis points in the expected rate of return assumption, with other
assumptions held constant, would have increased net pension cost by an estimated $0.7 million. See Note 9,
“Pension and Other Postretirement Benefits,” to our audited consolidated financial statements included in Part II,
Item 8 of this Annual Report on Form 10-K for additional information.
     Contingencies. In the ordinary course of business, we are involved in litigation, claims, government inquiries,
investigations, charges and proceedings, including, but not limited to, those relating to regulatory, commercial,
employment, employee benefits and securities matters. In accordance with the FASB’s standard on accounting for
contingencies, we record accruals for contingencies when it is probable that a liability will be incurred and the
amount of loss can be reasonably estimated. Our recorded reserves are based on estimates developed with
consideration given to the potential merits of claims, the range of possible settlements, advice from outside counsel,
and management’s strategy with regard to the settlement of or defense against such claims. See Note 14,
“Commitments and Contingencies,” to our audited consolidated financial statements included in Part II, Item 8 of
this Annual Report on Form 10-K for additional information.
     Stock-Based Compensation. We account for stock-based compensation in accordance with a standard issued by
the FASB and guidance issued by the Securities and Exchange Commission (“SEC”), which require the
measurement and recognition of compensation expense for all stock-based compensation awards made to employees
and directors, including employee stock options and employee stock purchase plans.
     The standard requires companies to estimate the fair value of stock-based awards on the date of grant using an
option-pricing model. The portion of the value that is ultimately expected to vest is recognized as expense over the
requisite service period. As stock-based compensation expense recognized in our audited consolidated statements of
income for fiscal years 2009, 2008 and 2007 is based on awards ultimately expected to vest, it has been reduced for
estimated forfeitures. The standard requires forfeitures to be estimated at the time of grant and revised, if necessary,
in subsequent periods if actual forfeitures differ from those estimates.
     In addition, the standard requires that the benefits of realized tax deductions in excess of tax benefits on
compensation expense, which amounted to $64.3 million, $41.8 million and $69.9 million for fiscal years 2009,
2008 and 2007, respectively, be reported as a component of cash flows from financing activities rather than as an
operating cash flow, as previously required. In accordance with Authoritative Guidance issued by the SEC, we
classify stock-based compensation within cost of product net revenues and SG&A expenses to correspond with the
financial statement components in which cash compensation paid to employees and directors is recorded.


                                                           65
Recently Adopted Financial Accounting Standards.
      Subsequent Events. In May 2009, the FASB issued a standard, which establishes general standards of
accounting for and disclosure of events that occur after the balance sheet date but before financial statements are
issued or are available to be issued. It requires the disclosure of the date through which an entity has evaluated
subsequent events and the basis for that date; that is, whether that date represents the date the financial statements
were issued or were available to be issued. The standard was effective for interim or annual financial periods ending
after June 15, 2009. We adopted the standard in the second quarter of 2009. We have evaluated subsequent events
through February 23, 2010, the filing date of this Annual Report on Form 10-K. Our adoption of the standard did
not have a material impact on our audited consolidated financial statements included in Part II, Item 8 of this
Annual Report on Form 10-K.
     Accounting for Defensive Intangible Assets. In November 2008, Authoritative Guidance was issued, which
applies to all acquired intangible assets in situations in which the acquirer does not intend to actively use the asset
but intends to hold the asset to prevent its competitors from obtaining access to the asset (a defensive intangible
asset). The standard is effective prospectively for intangible assets acquired on or after the beginning of the first
annual reporting period beginning on or after December 15, 2008. Earlier application is not permitted. Our adoption
of the standard in 2009 did not have an impact on our audited consolidated financial statements included in Part II,
Item 8 of this Annual Report on Form 10-K.
     Determination of the Useful Life of Intangible Assets. In April 2008, the FASB issued a standard, which
amends the factors that should be considered in developing renewal or extension assumptions used to determine the
useful life of a recognized intangible asset and requires additional disclosure. The standard applies to all intangible
assets, whether acquired in a business combination or otherwise, and is effective for financial statements issued for
fiscal years beginning after December 15, 2008, and interim periods within those fiscal years. The guidance for
determining the useful life of intangible assets is applied prospectively to intangible assets acquired after the
effective date. The disclosure requirements apply prospectively to all intangible assets recognized as of, and
subsequent to, the effective date. Our adoption of this standard in 2009 did not have a material impact on our
audited consolidated financial statements included in Part II, Item 8 of this Annual Report on Form 10-K. For
additional disclosures required under this standard, see Note 7, “Goodwill and Intangible Assets,” to the audited
consolidated financial statements included in Part II, Item 8 of this Annual Report on Form 10-K.
     Disclosures about Derivative Instruments and Hedging Activities. In March 2008, the FASB issued a standard,
which requires qualitative disclosures about objectives and strategies for using derivatives, quantitative disclosures
about fair value amounts of gains and losses on derivative instruments and disclosures about credit-risk-related
contingent features in derivative instruments. The standard is intended to improve financial reporting relating to
derivative instruments and hedging activities by requiring enhanced disclosures to enable investors to better
understand their effects on an entity’s financial position, financial performance, and cash flows. The standard is
effective for financial statements issued for fiscal years and interim periods beginning after November 15, 2008.
     Our derivatives consist of interest rate swap agreements on $200 million of the $500 million in 7.25% senior
notes due in 2013. These swap agreements were entered into as an effective hedge to (i) convert a portion of the
senior note fixed rate debt into floating rate debt; (ii) maintain a capital structure containing appropriate amounts of
fixed and floating rate debt; and (iii) lower the interest expense on these notes in the near term. We do not expect
our future cash flows to be affected to any significant degree by a sudden change in market interest rates. For more
information, see Note 4, “Fair Value Disclosures,” and Note 8, “Debt,” to our audited consolidated financial
statements included in Part II, Item 8 of this Annual Report on Form 10-K. Our adoption of the standard in 2009
did not have a material impact on our audited consolidated financial statements included in Part II, Item 8 of this
Annual Report on Form 10-K. Additional disclosures required under the standard are included above.


                                                           66
Business Combinations. In December 2007, the FASB issued a standard, which is intended to improve,
simplify, and converge internationally the accounting for business combinations and the reporting of noncontrolling
interests in consolidated financial statements. The standard requires the acquiring entity in a business combination to
measure and recognize all the assets acquired and liabilities assumed in the transaction; establishes the acquisition-
date fair value as the measurement objective for all assets acquired and liabilities assumed; and requires the acquirer
to disclose to investors and other users the information they need to evaluate and understand the nature and financial
effect of the business combination. The standard is effective for fiscal years, and interim periods within those fiscal
years, beginning on or after December 15, 2008. The standard applies prospectively to business combinations for
which the acquisition date is on or after the beginning of the first annual reporting period beginning on or after
December 15, 2008. In April 2009, the FASB issued additional guidance, which amends and clarifies the standard to
address application issues, subsequent measurement and accounting, and disclosure of assets and liabilities arising
from contingencies in a business combination. The guidance is effective for acquisition dates on or after the
beginning of the first annual reporting period beginning on or after December 15, 2008. Our adoption of the
standard did not have an impact on our audited consolidated financial statements included in Part II, Item 8 of this
Annual Report on Form 10-K.
      Noncontrolling Interests in Consolidated Financial Statements. In December 2007, the FASB issued a standard,
which is designed to improve the relevance, comparability, and transparency of financial information provided to
investors by requiring all entities to report noncontrolling (minority) interests in subsidiaries in the same way—as
equity in the consolidated financial statements. Moreover, the standard eliminates the diversity that existed in
accounting for transactions between an entity and noncontrolling interests by requiring that they be treated as equity
transactions. The standard is effective for fiscal years, and interim periods within those fiscal years, beginning on or
after December 15, 2008. In addition, the standard must be applied prospectively as of the beginning of the fiscal
year in which it is initially applied, except for the presentation and disclosure requirements. Our adoption of the
standard did not have an impact on our audited consolidated financial statements included in Part II, Item 8 of this
Annual Report on Form 10-K.
     Interim Disclosures about Fair Value of Financial Instruments. In April 2009, the FASB issued a standard,
which enhances consistency in financial reporting by increasing the frequency of fair value disclosures. This
standard is effective for interim and annual periods ending after June 15, 2009. Our adoption of this standard in the
second quarter of 2009 did not have a material impact on our audited consolidated financial statements included in
Part II, Item 8 of this Annual Report on Form 10-K. For additional disclosures required under this standard, see
Note 4, “Fair Value Disclosures,” to the audited consolidated financial statements included in Part II, Item 8 of this
Annual Report on Form 10-K.
     Employers’ Disclosures about Postretirement Benefit Plan Assets. In December 2008, the FASB issued a
standard, which provides guidance on an employer’s disclosures about plan assets of a defined benefit pension or
other postretirement plan. We adopted the disclosures about plan assets required by the standard prospectively for
the fiscal year ended December 26, 2009. See Note 9, “Pension and Other Postretirement Benefits,” to our audited
consolidated financial statements included in Part II, Item 8 of this Annual Report on Form 10-K for more
information. The adoption of the standard did not have a material impact on our audited consolidated financial
statements.

     Recently Issued Accounting Pronouncement.
      Fair Value Measurements and Disclosures. In January 2010, the FASB issued a standard, which amends the
existing fair value measurements and disclosure standard and provides guidance on increased disclosures on transfers
in and out of Levels 1 and 2 and activity in Level 3 fair value measurements. The standard also clarifies existing
fair value measurement disclosure guidance about the level of disaggregation, inputs, and valuation techniques. The
new disclosures and clarifications of existing disclosures are effective for interim and annual reporting periods
beginning after December 15, 2009, except for the disclosures about purchases, sales, issuances, and settlements in
the roll forward of activity in Level 3 fair value measurements, which are effective for fiscal years beginning after
December 15, 2010, and for interim periods within those fiscal years. We do not expect the adoption of the standard
to have a material impact on our consolidated financial statements.


                                                           67
CONDENSED INTERIM FINANCIAL DATA (UNAUDITED)
(In millions, except for per share amounts)
        2009                                                                               4th Quarter   3rd Quarter    2nd Quarter     1st Quarter
        Product net revenues(1) . . . . . . . . . . . . . . . . . . . .    ....             $15,024.9     $14,590.8      $14,729.6      $14,616.3
        Service revenues . . . . . . . . . . . . . . . . . . . . . . . .   ....                 220.3         204.0          200.8          217.6
             Total net revenues(1) . . . . . . . . . . . . . . . . . .     ....              15,245.2      14,794.8       14,930.4       14,833.9
        Cost of operations:
          Cost of product net revenues(1) . . . . . . . . . . . . .        .   .   .   .     14,138.6      13,696.5       13,856.1       13,832.0
          Cost of service revenues . . . . . . . . . . . . . . . . .       .   .   .   .         79.5          58.3           58.5           57.8
             Total cost of revenues(1) . . . . . . . . . . . . . . . .     .   .   .   .     14,218.1      13,754.8       13,914.6       13,889.8
          Selling, general and administrative expenses . . . .             .   .   .   .        375.5         369.0          370.7          340.3
          Amortization of intangibles . . . . . . . . . . . . . . .        .   .   .   .         75.5          78.4           75.9           75.9
          Interest expense. . . . . . . . . . . . . . . . . . . . . . .    .   .   .   .         40.7          43.3           43.4           45.1
          Interest (income) and other (income) expense, net                .   .   .   .         (0.8)         (3.4)          (2.2)          (3.5)
             Total costs and expenses . . . . . . . . . . . . . . .        .   .   .   .     14,709.0      14,242.1       14,402.4       14,347.6
        Income before provision for income taxes . . . . . . .             .   .   .   .        536.2         552.7          528.0          486.3
        Provision for income taxes . . . . . . . . . . . . . . . . .       .   .   .   .        194.7         217.1          215.9          195.3
        Net income . . . . . . . . . . . . . . . . . . . . . . . . . . .   .   .   .   .    $ 341.5       $ 335.6        $ 312.1        $ 291.0
        Basic earnings per share:
          Weighted average shares        outstanding . . . . . . . . . . . . .                   477.0        475.4          479.6           492.2
          Earnings per share . . . .     .....................                              $     0.72    $    0.71      $    0.65      $     0.59
        Diluted earnings per share:
          Weighted average shares        outstanding . . . . . . . . . . . . .                   487.2        484.7          488.0           501.2
          Earnings per share . . . .     .....................                              $     0.70    $    0.69      $    0.64      $     0.58

        2008                                                                               4th Quarter   3rd Quarter   2nd Quarter(2)   1st Quarter
        Product net revenues(3) . . . . . . . . . . . . . . . . . . . .    ... .            $12,771.9     $12,390.3      $12,607.1       $12,806.9
        Service revenues . . . . . . . . . . . . . . . . . . . . . . . .   ... .                189.4         168.8          167.5           156.0
             Total net revenues(3) . . . . . . . . . . . . . . . . . .     ... .             12,961.3      12,559.1       12,774.6        12,962.9
        Cost of operations:
          Cost of product net revenues(3) . . . . . . . . . . . . .        .   .   .   .     11,916.5      11,580.7       11,794.0        12,016.8
          Cost of service revenues . . . . . . . . . . . . . . . . .       .   .   .   .         74.7          53.6           47.1            45.9
             Total cost of revenues(3) . . . . . . . . . . . . . . . .     .   .   .   .     11,991.2      11,634.3       11,841.1        12,062.7
          Selling, general and administrative expenses . . . .             .   .   .   .        381.0         347.2          368.4           328.4
          Amortization of intangibles . . . . . . . . . . . . . . .        .   .   .   .         73.9          71.1           70.6            69.5
          Interest expense. . . . . . . . . . . . . . . . . . . . . . .    .   .   .   .         60.0          61.5           61.6            50.6
          Interest (income) and other (income) expense, net                .   .   .   .         (2.4)         (3.3)          (4.1)            3.7
             Total costs and expenses . . . . . . . . . . . . . . .        .   .   .   .     12,503.7      12,110.8       12,337.6        12,514.9
        Income before provision for income taxes . . . . . . .             .   .   .   .        457.6         448.3          437.0           448.0
        Provision for income taxes . . . . . . . . . . . . . . . . .       .   .   .   .        183.2         152.6          174.3           177.8
        Net income . . . . . . . . . . . . . . . . . . . . . . . . . . .   .   .   .   .    $ 274.4       $ 295.7        $ 262.7         $ 270.2
        Basic earnings per share:
          Weighted average shares        outstanding . . . . . . . . . . . . .                   496.3        503.3          507.7           526.9
          Earnings per share . . . .     .................... .                             $     0.55    $    0.59      $    0.52       $    0.51
        Diluted earnings per share:
          Weighted average shares        outstanding . . . . . . . . . . . . .                   505.3        513.4          517.6           537.8
          Earnings per share . . . .     .................... .                             $     0.54    $    0.58      $    0.51       $    0.50
(1)
      Includes retail co-payments of $2,173 million for the fourth quarter, $2,115 million for the third quarter,
      $2,114 million for the second quarter and $2,259 million for the first quarter of 2009.
(2)
      The second quarter of 2008, and all subsequent periods, includes the operating results of majority-owned
      Europa Apotheek commencing on the April 28, 2008 acquisition date.
(3)
      Includes retail co-payments of $1,836 million for the fourth quarter, $1,828 million for the third quarter,
      $1,900 million for the second quarter and $2,102 million for the first quarter of 2008.
     The fourth quarter of 2009 and the third quarter of 2008 include income tax benefits of $22 million and
$28 million, respectively. The fourth quarters of 2009 and 2008 reflect costs of $18 million and $22 million,
respectively, associated with implementation efforts for new clients commencing in 2010 and 2009. Additionally,
2008 reflects a first-quarter charge of $9.8 million for the ineffective portion of the forward-starting interest rate
swap agreements associated with our March 2008 issuance of senior notes.


                                                                                            68
Item 7A.     Quantitative and Qualitative Disclosures about Market Risk.
    A description of quantitative and qualitative disclosures about market risk is contained in Part II, Item 7,
“Management’s Discussion and Analysis of Financial Condition and Results of Operations—Liquidity and Capital
Resources—Interest Rate and Foreign Exchange Risk.”

Item 8.    Financial Statements and Supplementary Data.

                                INDEX TO CONSOLIDATED FINANCIAL STATEMENTS*

    Report of Independent Registered Public Accounting Firm . . . . . . . . . . . . . . . . . . . . . . . . . . . . . . . . .                     70
    Consolidated Balance Sheets as of December 26, 2009 and December 27, 2008 . . . . . . . . . . . . . . . . .                                   71
    Consolidated Statements of Income for the Years Ended December 26, 2009, December 27, 2008 and
      December 29, 2007 . . . . . . . . . . . . . . . . . . . . . . . . . . . . . . . . . . . . . . . . . . . . . . . . . . . . . . . . . . . .   72
    Consolidated Statements of Stockholders’ Equity for the Years Ended December 29, 2007,
      December 27, 2008 and December 26, 2009. . . . . . . . . . . . . . . . . . . . . . . . . . . . . . . . . . . . . . . . . .                  73
    Consolidated Statements of Cash Flows for the Years Ended December 26, 2009, December 27, 2008
      and December 29, 2007 . . . . . . . . . . . . . . . . . . . . . . . . . . . . . . . . . . . . . . . . . . . . . . . . . . . . . . . . .     74
    Notes to Consolidated Financial Statements . . . . . . . . . . . . . . . . . . . . . . . . . . . . . . . . . . . . . . . . . . . .            75

*    Selected quarterly financial data for the fiscal years ended December 26, 2009 and December 27, 2008 is
included herein under Part II, Item 7, “Management’s Discussion and Analysis of Financial Condition and Results of
Operations—Condensed Interim Financial Data (Unaudited).”
    See Item 9A, “Controls and Procedures,” for Management’s Report on Internal Control over Financial
Reporting.
    See Item 15, “Exhibits, Financial Statement Schedules,” for financial statement Schedule II, Valuation and
Qualifying Accounts.


                                                                           69
Report of Independent Registered Public Accounting Firm
To the Shareholders and Board of Directors of Medco Health Solutions, Inc.:
     In our opinion, the consolidated financial statements listed in the accompanying index present fairly, in all material
respects, the financial position of Medco Health Solutions, Inc. and its subsidiaries (the “Company”) at December 26,
2009 and December 27, 2008, and the results of their operations and their cash flows for each of the three years in
the period ended December 26, 2009 in conformity with accounting principles generally accepted in the United
States of America. In addition, in our opinion, the financial statement schedule listed in the index appearing under
Item 15(a)(2) presents fairly, in all material respects, the information set forth therein when read in conjunction with
the related consolidated financial statements. Also in our opinion, the Company maintained, in all material respects,
effective internal control over financial reporting as of December 26, 2009, based on criteria established in Internal
Control – Integrated Framework issued by the Committee of Sponsoring Organizations of the Treadway Commission
(COSO). The Company’s management is responsible for these financial statements and financial statement schedule,
for maintaining effective internal control over financial reporting and for its assessment of the effectiveness of
internal control over financial reporting, included in Management’s Report on Internal Control over Financial
Reporting appearing under Item 9A. Our responsibility is to express opinions on these financial statements, on the
financial statement schedule, and on the Company’s internal control over financial reporting based on our integrated
audits. We conducted our audits in accordance with the standards of the Public Company Accounting Oversight
Board (United States). Those standards require that we plan and perform the audits to obtain reasonable assurance
about whether the financial statements are free of material misstatement and whether effective internal control over
financial reporting was maintained in all material respects. Our audits of the financial statements included
examining, on a test basis, evidence supporting the amounts and disclosures in the financial statements, assessing
the accounting principles used and significant estimates made by management, and evaluating the overall financial
statement presentation. Our audit of internal control over financial reporting included obtaining an understanding of
internal control over financial reporting, assessing the risk that a material weakness exists, and testing and evaluating
the design and operating effectiveness of internal control based on the assessed risk. Our audits also included
performing such other procedures as we considered necessary in the circumstances. We believe that our audits
provide a reasonable basis for our opinions.
     A company’s internal control over financial reporting is a process designed to provide reasonable assurance
regarding the reliability of financial reporting and the preparation of financial statements for external purposes in
accordance with generally accepted accounting principles. A company’s internal control over financial reporting
includes those policies and procedures that (i) pertain to the maintenance of records that, in reasonable detail,
accurately and fairly reflect the transactions and dispositions of the assets of the company; (ii) provide reasonable
assurance that transactions are recorded as necessary to permit preparation of financial statements in accordance
with generally accepted accounting principles, and that receipts and expenditures of the company are being made
only in accordance with authorizations of management and directors of the company; and (iii) provide reasonable
assurance regarding prevention or timely detection of unauthorized acquisition, use, or disposition of the company’s
assets that could have a material effect on the financial statements.
     Because of its inherent limitations, internal control over financial reporting may not prevent or detect misstatements.
Also, projections of any evaluation of effectiveness to future periods are subject to the risk that controls may become
inadequate because of changes in conditions, or that the degree of compliance with the policies or procedures may
deteriorate.

/s/ PricewaterhouseCoopers LLP


Florham Park, NJ
February 23, 2010


                                                            70
MEDCO HEALTH SOLUTIONS, INC.
                                                    CONSOLIDATED BALANCE SHEETS
                                                      (In millions, except for share data)

                                                                                                                              December 26,    December 27,
                                                                                                                                  2009            2008

ASSETS
Current assets:
    Cash and cash equivalents . . . . . . . . . . . . . . . . . . . . . . . . . . . . . . . . . . . . . . . . .               $    2,528.2    $      938.4
    Short-term investments . . . . . . . . . . . . . . . . . . . . . . . . . . . . . . . . . . . . . . . . . . . .                    20.1            64.0
    Manufacturer accounts receivable, net . . . . . . . . . . . . . . . . . . . . . . . . . . . . . . . . .                        1,765.5         1,858.9
    Client accounts receivable, net . . . . . . . . . . . . . . . . . . . . . . . . . . . . . . . . . . . . . .                    2,063.3         1,680.5
    Income taxes receivable . . . . . . . . . . . . . . . . . . . . . . . . . . . . . . . . . . . . . . . . . . .                    198.3           213.4
    Inventories, net . . . . . . . . . . . . . . . . . . . . . . . . . . . . . . . . . . . . . . . . . . . . . . . . .             1,285.3         1,856.5
    Prepaid expenses and other current assets . . . . . . . . . . . . . . . . . . . . . . . . . . . . . .                             67.1           326.6
    Deferred tax assets . . . . . . . . . . . . . . . . . . . . . . . . . . . . . . . . . . . . . . . . . . . . . . .                230.8           159.2
          Total current assets . . . . .           ......................................                                          8,158.6         7,097.5
Property and equipment, net . . . . .              ......................................                                            912.5           854.1
Goodwill . . . . . . . . . . . . . . . . . . . .   ......................................                                          6,333.0         6,331.4
Intangible assets, net . . . . . . . . . . .       ......................................                                          2,428.8         2,666.4
Other noncurrent assets . . . . . . . . .          ......................................                                             82.6            61.5
             Total assets . . . . . . . . . . . . . . . . . . . . . . . . . . . . . . . . . . . . . . . . . . . . . . . . .   $ 17,915.5      $   17,010.9

LIABILITIES AND STOCKHOLDERS’ EQUITY
Current liabilities:
    Claims and other accounts payable . . . . . . . . . . . . . . . . . . . . . . . . . . . . . . . . . . .                   $    3,506.4    $    2,878.9
    Client rebates and guarantees payable . . . . . . . . . . . . . . . . . . . . . . . . . . . . . . . . .                        2,106.9         1,658.7
    Accrued expenses and other current liabilities . . . . . . . . . . . . . . . . . . . . . . . . . . .                             718.6           660.4
    Short-term debt . . . . . . . . . . . . . . . . . . . . . . . . . . . . . . . . . . . . . . . . . . . . . . . . .                 15.8           600.0
         Total current liabilities . .             ......................................                                          6,347.7         5,798.0
Long-term debt, net . . . . . . . . . . . .        ......................................                                          4,000.1         4,002.9
Deferred tax liabilities . . . . . . . . . .       ......................................                                            958.8         1,065.3
Other noncurrent liabilities . . . . . .           ......................................                                            221.7           186.8
         Total liabilities . . . . . . . . . . . . . . . . . . . . . . . . . . . . . . . . . . . . . . . . . . . . . .            11,528.3        11,053.0
Commitments and contingencies (See Note 14)
Stockholders’ equity:
    Preferred stock, par value $0.01—authorized: 10,000,000 shares; issued and
      outstanding: 0. . . . . . . . . . . . . . . . . . . . . . . . . . . . . . . . . . . . . . . . . . . . . . . . .                  —               —
    Common stock, par value $0.01—authorized: 2,000,000,000 shares; issued:
      660,846,867 shares at December 26, 2009 and 652,386,763 shares at
      December 27, 2008 . . . . . . . . . . . . . . . . . . . . . . . . . . . . . . . . . . . . . . . . . . . .                        6.6             6.5
    Accumulated other comprehensive loss . . . . . . . . . . . . . . . . . . . . . . . . . . . . . . . .                             (44.2)          (63.8)
    Additional paid-in capital . . . . . . . . . . . . . . . . . . . . . . . . . . . . . . . . . . . . . . . . . .                 8,156.7         7,788.9
    Retained earnings . . . . . . . . . . . . . . . . . . . . . . . . . . . . . . . . . . . . . . . . . . . . . . . .              5,209.6         3,929.3
                                                                                                                                  13,328.7        11,660.9
      Treasury stock, at cost: 186,353,868 shares at December 26, 2009 and
        159,061,394 shares at December 27, 2008 . . . . . . . . . . . . . . . . . . . . . . . . . . . .                           (6,941.5)       (5,703.0)
           Total stockholders’ equity . . . . . . . . . . . . . . . . . . . . . . . . . . . . . . . . . . . . . .                  6,387.2         5,957.9
             Total liabilities and stockholders’ equity . . . . . . . . . . . . . . . . . . . . . . . . . . .                 $ 17,915.5      $   17,010.9


                   The accompanying notes are an integral part of these consolidated financial statements.

                                                                                 71
MEDCO HEALTH SOLUTIONS, INC.
                                            CONSOLIDATED STATEMENTS OF INCOME
                                               (In millions, except for per share data)

                                                                                                 December 26,    December 27,    December 29,
For Fiscal Years Ended                                                                               2009            2008            2007
Product net revenues (Includes retail co-payments of $8,661 for
  2009, $7,666 for 2008, and $7,553 for 2007) . . . . . . . . . . . . . . . .                    $   58,961.4    $   50,576.2    $   43,961.9
Service revenues . . . . . . . . . . . . . . . . . . . . . . . . . . . . . . . . . . . . . .            842.8           681.8           544.3
      Total net revenues . . . . . . . . . . . . . . . . . . . . . . . . . . . . . . . . . .         59,804.2        51,258.0        44,506.2
Cost of operations:
  Cost of product net revenues (Includes retail co-payments of
     $8,661 for 2009, $7,666 for 2008, and $7,553 for 2007) . . . . . .                              55,523.1        47,308.2        41,402.6
  Cost of service revenues . . . . . . . . . . . . . . . . . . . . . . . . . . . . . . .                254.1           221.4           158.3
   Total cost of revenues . . . . . . . . . . . . . . . . . . . . . . . . . . . . . . . . .          55,777.2        47,529.6        41,560.9
   Selling, general and administrative expenses . . . . . . . . . . . . . . . .                       1,455.5         1,425.0         1,114.1
   Amortization of intangibles . . . . . . . . . . . . . . . . . . . . . . . . . . . . .                305.6           285.1           228.1
   Interest expense . . . . . . . . . . . . . . . . . . . . . . . . . . . . . . . . . . . . .           172.5           233.7           134.2
   Interest (income) and other (income) expense, net . . . . . . . . . . . .                             (9.9)           (6.2)          (34.4)
      Total costs and expenses . . . . . . . . . . . . . . . . . . . . . . . . . . . . .             57,700.9        49,467.2        43,002.9
Income before provision for income taxes . . . . . . . . . . . . . . . . . . . .                      2,103.3         1,790.8         1,503.3
Provision for income taxes . . . . . . . . . . . . . . . . . . . . . . . . . . . . . . .                823.0           687.9           591.3
Net income . . . . . . . . . . . . . . . . . . . . . . . . . . . . . . . . . . . . . . . . . .   $    1,280.3    $    1,102.9    $     912.0
Basic weighted average shares outstanding(1) . . . . . . . . . . . . . . . . . .                       481.1           508.6           550.2
Basic earnings per share(1) . . . . . . . . . . . . . . . . . . . . . . . . . . . . . . .        $      2.66     $      2.17     $      1.66
Diluted weighted average shares outstanding(1) . . . . . . . . . . . . . . . .                         490.0           518.6           560.9
Diluted earnings per share(1) . . . . . . . . . . . . . . . . . . . . . . . . . . . . . .        $      2.61     $      2.13     $      1.63
(1)
       Common share and per share amounts have been retrospectively adjusted to reflect the January 24, 2008
        two-for-one stock split. See Note 1, “Background and Basis of Presentation” for additional information.


                   The accompanying notes are an integral part of these consolidated financial statements.

                                                                              72
MEDCO HEALTH SOLUTIONS, INC.
                                                CONSOLIDATED STATEMENTS OF STOCKHOLDERS’ EQUITY
                                                  (Shares in thousands; $ in millions, except for per share data)
                                                                    Shares of    Shares                        Accumulated
                                                                    Common          of      $0.01 Par Value       Other
                                                                      Stock     Treasury       Common         Comprehensive      Additional        Retained    Treasury
                                                                    Issued(1)    Stock(1)       Stock(1)      Income (Loss)   Paid-in Capital(1)   Earnings     Stock        Total

      Balances at December 30, 2006. . . . . . . . . .              635,019      58,122         $6.3             $ 15.3          $7,153.1          $1,885.1   $(1,556.3)   $ 7,503.5
      Comprehensive income:
         Net income . . . . . . . . . . . . . . . . . . . . .             —           —            —                 —                   —           912.0           —        912.0
         Other comprehensive income (loss)(2):
            Unrealized loss on cash flow hedge, net
              of tax . . . . . . . . . . . . . . . . . . . . . .          —           —            —               (4.8)                 —               —           —          (4.8)
            Defined benefit plans, net of tax:
              Net prior service cost . . . . . . . . . . .                —           —            —               (4.5)                 —             —             —         (4.5)
              Net gain (loss) . . . . . . . . . . . . . . . .             —           —            —                0.4                  —             —             —          0.4
         Other comprehensive income (loss) . . . . . .                    —           —            —               (8.9)                 —             —             —         (8.9)
      Total comprehensive income . . . . . . . . . . . .                  —           —            —               (8.9)                 —           912.0           —        903.1
      Adoption of FASB standard on accounting for
         uncertainty in income taxes(3) . . . . . . . . .                —            —           —                  —                 —              29.3           —         29.3
      Stock option activity, including tax benefit . .               11,876           —           0.1                —               334.7              —            —        334.8
      Issuance of common stock under employee
         stock purchase plans . . . . . . . . . . . . . . .             365           —            —                 —                13.0               —           —          13.0
      Restricted stock and restricted stock unit
         activity, including tax benefit . . . . . . . . . .            125          —            —                  —               52.2               —           —           52.2
      Treasury stock acquired . . . . . . . . . . . . . . .              —       53,323           —                  —                 —                —      (1,960.6)    (1,960.6)
      Balances at December 29, 2007. . . . . . . . . .              647,385     111,445           6.4               6.4           7,553.0           2,826.4    (3,516.9)     6,875.3
      Comprehensive income:
         Net income . . . . . . . . . . . . . . . . . . . . .             —           —            —                 —                   —          1,102.9          —       1,102.9
         Other comprehensive income (loss)(2):
            Unrealized loss on investments, net of
              tax . . . . . . . . . . . . . . . . . . . . . . . .         —           —            —               (0.2)                 —               —           —          (0.2)
            Foreign currency translation gain
              (loss) . . . . . . . . . . . . . . . . . . . . . .          —           —            —              (15.5)                 —               —           —         (15.5)
            Unrealized loss on cash flow hedge, net
              of amortization, net of tax . . . . . . . .                 —           —            —              (15.2)                 —               —           —         (15.2)
            Defined benefit plans, net of tax:
              Net prior service cost . . . . . . . . . . .               —            —           —                (3.0)               —                —            —          (3.0)
              Net gain (loss) . . . . . . . . . . . . . . . .            —            —           —               (36.3)               —                —            —         (36.3)
         Other comprehensive income (loss) . . . . . .                   —            —           —               (70.2)               —                —            —         (70.2)
      Total comprehensive income . . . . . . . . . . . .                 —            —           —               (70.2)               —            1,102.9          —       1,032.7
      Stock option activity, including tax benefit . .                3,444           —           0.1                —               167.6              —            —         167.7
      Issuance of common stock under employee
         stock purchase plan . . . . . . . . . . . . . . . .            400           —            —                 —                 18.7              —           —          18.7
      Restricted stock and restricted stock unit
         activity, including tax benefit . . . . . . . . . .          1,158          —            —                  —                49.6              —           —           49.6
      Treasury stock acquired . . . . . . . . . . . . . . .              —       47,616           —                  —                  —               —      (2,186.1)    (2,186.1)
      Balances at December 27, 2008. . . . . . . . . .              652,387     159,061           6.5             (63.8)           7,788.9          3,929.3    (5,703.0)     5,957.9
      Comprehensive income:
         Net income . . . . . . . . . . . . . . . . . . . . .             —           —            —                 —                   —          1,280.3          —       1,280.3
         Other comprehensive income (loss)(2):
            Unrealized loss on investments, net of
              tax . . . . . . . . . . . . . . . . . . . . . . . .         —           —            —               (0.1)                 —               —           —          (0.1)
            Foreign currency translation gain
              (loss) . . . . . . . . . . . . . . . . . . . . . .          —           —            —                2.9                  —               —           —           2.9
            Amortization of unrealized loss on cash
              flow hedge, net of tax . . . . . . . . . . .                —           —            —                1.9                  —               —           —           1.9
            Defined benefit plans, net of tax:
              Net prior service cost . . . . . . . . . . .               —            —           —                (2.4)               —                —            —          (2.4)
              Net gain (loss) . . . . . . . . . . . . . . . .            —            —           —                17.3                —                —            —          17.3
         Other comprehensive income (loss) . . . . . .                   —            —           —                19.6                —                —            —          19.6
      Total comprehensive income . . . . . . . . . . . .                 —            —           —                19.6                —            1,280.3          —       1,299.9
      Stock option activity, including tax benefit . .                6,997           —           0.1                —               298.4              —            —         298.5
      Issuance of common stock under employee
         stock purchase plan . . . . . . . . . . . . . . . .            461           —            —                 —                 20.8              —           —          20.8
      Restricted stock unit activity, including tax
         benefit . . . . . . . . . . . . . . . . . . . . . . . .      1,002          —           —                   —               48.6                —           —          48.6
      Treasury stock acquired . . . . . . . . . . . . . . .              —       27,293          —                   —                 —                —      (1,238.5)    (1,238.5)
      Balances at December 26, 2009. . . . . . . . . .              660,847     186,354         $6.6             $(44.2)         $8,156.7          $5,209.6   $(6,941.5)   $ 6,387.2

(1)
       Share data, common stock and additional paid-in-capital have been retrospectively adjusted to reflect the January 24, 2008 two-for-one stock
       split. See Note 1, “Background and Basis of Presentation,” for more information.
(2)
       See Note 2, “Summary of Significant Accounting Policies—Other Comprehensive Income and Accumulated Other Comprehensive Income,”
       for more information.
(3)
       See Note 2, “Summary of Significant Accounting Policies—Income Taxes,” for more information.
                                    The accompanying notes are an integral part of these consolidated financial statements.

                                                                                                  73
MEDCO HEALTH SOLUTIONS, INC.
                                         CONSOLIDATED STATEMENTS OF CASH FLOWS
                                                        (In millions)

                                                                                                  December 26,   December 27,     December 29,
For Fiscal Years Ended                                                                                2009           2008             2007
Cash flows from operating activities:
  Net income. . . . . . . . . . . . . . . . . . . . . . . . . . . . . . . . . . . . . . . . .      $ 1,280.3      $ 1,102.9        $     912.0
  Adjustments to reconcile net income to net cash provided by
    operating activities:
    Depreciation . . . . . . . . . . . . . . . . . . . . . . . . . . . . . . . . . . . . . .            179.0           157.7            168.9
    Amortization of intangibles . . . . . . . . . . . . . . . . . . . . . . . . . . .                   305.6           285.1            228.1
    Deferred income taxes. . . . . . . . . . . . . . . . . . . . . . . . . . . . . . .                 (222.1)          (99.6)          (134.1)
    Stock-based compensation on employee stock plans . . . . . . . . .                                  146.0           131.7            102.5
    Tax benefit on employee stock plans . . . . . . . . . . . . . . . . . . . .                         106.2            67.9            102.2
    Excess tax benefits from stock-based compensation
       arrangements . . . . . . . . . . . . . . . . . . . . . . . . . . . . . . . . . . . .             (64.3)          (41.8)            (69.9)
    Other . . . . . . . . . . . . . . . . . . . . . . . . . . . . . . . . . . . . . . . . . . .         138.3           110.7              65.0
  Net changes in assets and liabilities (net of acquisition effects,
    2008 and 2007 only):
    Manufacturer accounts receivable, net . . . . . . . . . . . . . . . . . . .                          93.4          (341.2)            25.9
    Client accounts receivable, net. . . . . . . . . . . . . . . . . . . . . . . . .                   (515.4)         (418.5)            65.0
    Inventories, net . . . . . . . . . . . . . . . . . . . . . . . . . . . . . . . . . . . .            571.4            93.0           (218.1)
    Prepaid expenses and other current assets . . . . . . . . . . . . . . . .                           259.6           (39.7)            (4.9)
    Income taxes receivable . . . . . . . . . . . . . . . . . . . . . . . . . . . . .                    15.1             2.6             (3.1)
    Other noncurrent assets . . . . . . . . . . . . . . . . . . . . . . . . . . . . . .                  12.8            17.2              2.1
    Claims and other accounts payable . . . . . . . . . . . . . . . . . . . . .                         627.2            54.3           (119.2)
    Client rebates and guarantees payable . . . . . . . . . . . . . . . . . . .                         448.2           566.5            206.1
    Accrued expenses and other current and noncurrent liabilities . .                                   120.1           (13.7)            38.5
Net cash provided by operating activities . . . . . . . . . . . . . . . . . . . .                      3,501.4        1,635.1          1,367.0
Cash flows from investing activities:
  Capital expenditures . . . . . . . . . . . . . . . . . . . . . . . . . . . . . . . . . .             (238.8)         (286.9)           (177.7)
  Purchases of securities and other assets . . . . . . . . . . . . . . . . . . . .                     (153.4)         (124.8)           (181.7)
  Acquisitions of businesses, net of cash acquired. . . . . . . . . . . . . .                              —           (126.5)         (1,530.6)
  Proceeds from sale of securities and other investments . . . . . . . . .                               87.2           122.0             176.2
Net cash used by investing activities . . . . . . . . . . . . . . . . . . . . . . . .                  (305.0)         (416.2)      (1,713.8)
Cash flows from financing activities:
  Proceeds from long-term debt . . . . . . . . . . . . . . . . . . . . . . . . . . .                      —            3,295.7       2,400.0
  Repayments on long-term debt . . . . . . . . . . . . . . . . . . . . . . . . . .                        —           (2,210.0)       (688.4)
  Proceeds from short-term debt. . . . . . . . . . . . . . . . . . . . . . . . . . .                    15.8                —          275.0
  Repayments under accounts receivable financing facility . . . . . . .                               (600.0)               —             —
  Debt issuance costs. . . . . . . . . . . . . . . . . . . . . . . . . . . . . . . . . . .              (0.4)            (11.2)         (1.8)
  Settlement of cash flow hedge. . . . . . . . . . . . . . . . . . . . . . . . . . .                      —              (45.4)           —
  Purchases of treasury stock . . . . . . . . . . . . . . . . . . . . . . . . . . . . .             (1,238.5)         (2,186.1)     (1,960.6)
  Excess tax benefits from stock-based compensation
     arrangements . . . . . . . . . . . . . . . . . . . . . . . . . . . . . . . . . . . . .             64.3              41.8            69.9
  Net proceeds from employee stock plans . . . . . . . . . . . . . . . . . . .                         152.2              60.6           208.3
Net cash (used by) provided by financing activities . . . . . . . . . . . . .                       (1,606.6)         (1,054.6)          302.4
Net increase (decrease) in cash and cash equivalents . . . . . . . . . . . .                           1,589.8          164.3            (44.4)
Cash and cash equivalents at beginning of year . . . . . . . . . . . . . . . .                           938.4          774.1            818.5
Cash and cash equivalents at end of year . . . . . . . . . . . . . . . . . . . .                   $ 2,528.2      $     938.4      $     774.1
Supplemental disclosures of cash flow information:
  Cash paid during the year for interest . . . . . . . . . . . . . . . . . . . . .                 $    168.2     $     207.1      $     123.4
   Cash paid during the year for income taxes . . . . . . . . . . . . . . . . .                    $    913.9     $     748.9      $     668.5


                    The accompanying notes are an integral part of these consolidated financial statements.

                                                                               74
MEDCO HEALTH SOLUTIONS, INC.
                           NOTES TO CONSOLIDATED FINANCIAL STATEMENTS

1. BACKGROUND AND BASIS OF PRESENTATION
     Medco Health Solutions, Inc., (“Medco” or the “Company”) is a leading healthcare company that is pioneering
the world’s most advanced pharmacy» and its clinical research and innovations are part of Medco making medicine
smarterTM for approximately 65 million members. Medco provides clinically-driven pharmacy services designed to
improve the quality of care and lower total healthcare costs for private and public employers, health plans, labor
unions and government agencies of all sizes, and for individuals served by Medicare Part D Prescription Drug Plans.
The Company’s unique Medco Therapeutic Resource Centers», which conduct therapy management programs using
Medco specialist pharmacists who have expertise in the medications used to treat certain chronic conditions, and
Accredo Health Group, Medco’s Specialty Pharmacy, represent innovative models for the care of patients with
chronic and complex conditions.
      The Company’s business model requires collaboration with retail pharmacies, physicians, the Centers for
Medicare & Medicaid Services (“CMS”) for Medicare, pharmaceutical manufacturers, and particularly in Specialty
Pharmacy, collaboration with state Medicaid agencies, and other third-party payors such as health insurers. The
Company’s programs and services help control the cost and enhance the quality of prescription drug benefits. The
Company accomplishes this by providing pharmacy benefit management (“PBM”) services through its national
networks of retail pharmacies and its own mail-order pharmacies, as well as through Accredo Health Group, which
the Company believes is the nation’s largest specialty pharmacy based on revenues. Medco’s Therapeutic Resource
Center focused on diabetes was augmented with the 2007 acquisition of PolyMedica Corporation (“PolyMedica”),
through which the Company believes it became the largest diabetes pharmacy care practice based on covered
patients. In 2008, the Company also extended its capabilities abroad when it acquired a majority interest in Europa
Apotheek Venlo B.V. (“Europa Apotheek”), a privately held company based in the Netherlands that primarily
provides mail-order pharmacy services in Germany. See Note 3, “Acquisitions of Businesses,” for more information.
In 2009, Medco advanced its European healthcare initiatives through a joint venture with United Drug plc, a pan-
European healthcare leader, to provide home-based pharmacy care services in the United Kingdom for patients
covered by the country’s National Health Service. Additionally, the Company’s commitment to advancing the
science of personalized medicine is further demonstrated by its January 2010 acquisition of DNA Direct, Inc., a
leader in providing guidance and decision support to payors, physicians and patients, on a range of complex issues
related to genomic medicine. When the term “mail order” is used, Medco means inventory dispensed through
Medco’s mail-order pharmacy operations.
      On November 29, 2007, the Company announced that its Board of Directors approved a two-for-one stock split,
which was effected in the form of a 100% stock dividend and distributed on January 24, 2008, to shareholders of
record at the close of business on January 10, 2008. The Company’s total authorized common stock increased from
1,000,000,000 shares to 2,000,000,000 shares. The par value of the common stock was unchanged by this action. All
share and per share amounts have been retrospectively adjusted for the increase in issued and outstanding shares
after giving effect to the stock split. Stockholders’ equity has also been restated to retroactively apply the effects of
the stock split. For all periods presented, the par value of the additional shares resulting from the stock split has
been reclassified from additional paid-in capital to common stock.

2. SUMMARY OF SIGNIFICANT ACCOUNTING POLICIES
  Recently Adopted Financial Accounting Standards.
     Subsequent Events. In May 2009, the Financial Accounting Standards Board (“FASB”) issued a standard, which
establishes general standards of accounting for and disclosure of events that occur after the balance sheet date but
before financial statements are issued or are available to be issued. It requires the disclosure of the date through
which an entity has evaluated subsequent events and the basis for that date; that is, whether that date represents the
date the financial statements were issued or were available to be issued. The standard was effective for interim or
annual financial periods ending after June 15, 2009. The Company adopted the standard in the second quarter of
2009. The Company has evaluated subsequent events through February 23, 2010, the filing date of this Annual
Report on Form 10-K. The Company’s adoption of the standard did not have a material impact on its audited
consolidated financial statements included in this Annual Report on Form 10-K.


                                                           75
Accounting for Defensive Intangible Assets. In November 2008, Authoritative Guidance was issued, which
applies to all acquired intangible assets in situations in which the acquirer does not intend to actively use the asset
but intends to hold the asset to prevent its competitors from obtaining access to the asset (a defensive intangible
asset). The standard is effective prospectively for intangible assets acquired on or after the beginning of the first
annual reporting period beginning on or after December 15, 2008. Earlier application is not permitted. The
Company’s adoption of the standard in 2009 did not have an impact on its audited consolidated financial statements
included in this Annual Report on Form 10-K.
     Determination of the Useful Life of Intangible Assets. In April 2008, the FASB issued a standard, which
amends the factors that should be considered in developing renewal or extension assumptions used to determine the
useful life of a recognized intangible asset and requires additional disclosure. The standard applies to all intangible
assets, whether acquired in a business combination or otherwise, and is effective for financial statements issued for
fiscal years beginning after December 15, 2008, and interim periods within those fiscal years. The guidance for
determining the useful life of intangible assets is applied prospectively to intangible assets acquired after the
effective date. The disclosure requirements apply prospectively to all intangible assets recognized as of, and
subsequent to, the effective date. The Company’s adoption of this standard in 2009 did not have a material impact
on its audited consolidated financial statements included in this Annual Report on Form 10-K. For additional
disclosures required under this standard, see Note 7, “Goodwill and Intangible Assets.”
     Disclosures about Derivative Instruments and Hedging Activities. In March 2008, the FASB issued a standard,
which requires qualitative disclosures about objectives and strategies for using derivatives, quantitative disclosures
about fair value amounts of gains and losses on derivative instruments and disclosures about credit-risk-related
contingent features in derivative instruments. The standard is intended to improve financial reporting relating to
derivative instruments and hedging activities by requiring enhanced disclosures to enable investors to better
understand their effects on an entity’s financial position, financial performance, and cash flows. The standard is
effective for financial statements issued for fiscal years and interim periods beginning after November 15, 2008.
     Our derivatives consist of interest rate swap agreements on $200 million of the $500 million in 7.25% senior
notes due in 2013. These swap agreements were entered into as an effective hedge to (i) convert a portion of the
senior note fixed rate debt into floating rate debt; (ii) maintain a capital structure containing appropriate amounts of
fixed and floating rate debt; and (iii) lower the interest expense on these notes in the near term. The Company does
not expect its future cash flows to be affected to any significant degree by a sudden change in market interest rates.
For more information, see Note 4, “Fair Value Disclosures,” and Note 8, “Debt.” The Company’s adoption of the
standard in 2009 did not have a material impact on its audited consolidated financial statements included in this
Annual Report on Form 10-K. Additional disclosures required under the standard are included above.
     Business Combinations. In December 2007, the FASB issued a standard, which is intended to improve,
simplify, and converge internationally the accounting for business combinations and the reporting of noncontrolling
interests in consolidated financial statements. The standard requires the acquiring entity in a business combination to
measure and recognize all the assets acquired and liabilities assumed in the transaction; establishes the acquisition-
date fair value as the measurement objective for all assets acquired and liabilities assumed; and requires the acquirer
to disclose to investors and other users the information they need to evaluate and understand the nature and financial
effect of the business combination. The standard is effective for fiscal years, and interim periods within those fiscal
years, beginning on or after December 15, 2008. The standard applies prospectively to business combinations for
which the acquisition date is on or after the beginning of the first annual reporting period beginning on or after
December 15, 2008. In April 2009, the FASB issued additional guidance, which amends and clarifies the standard to
address application issues, subsequent measurement and accounting, and disclosure of assets and liabilities arising
from contingencies in a business combination. The guidance is effective for acquisition dates on or after the
beginning of the first annual reporting period beginning on or after December 15, 2008. The Company’s adoption of
the standard did not have an impact on its audited consolidated financial statements included in this Annual Report
on Form 10-K.


                                                           76
Noncontrolling Interests in Consolidated Financial Statements. In December 2007, the FASB issued a standard,
which is designed to improve the relevance, comparability, and transparency of financial information provided to
investors by requiring all entities to report noncontrolling (minority) interests in subsidiaries in the same way—as
equity in the consolidated financial statements. Moreover, the standard eliminates the diversity that existed in
accounting for transactions between an entity and noncontrolling interests by requiring that they be treated as equity
transactions. The standard is effective for fiscal years, and interim periods within those fiscal years, beginning on or
after December 15, 2008. In addition, the standard must be applied prospectively as of the beginning of the fiscal
year in which it is initially applied, except for the presentation and disclosure requirements. The Company’s
adoption of the standard did not have an impact on its audited consolidated financial statements included in this
Annual Report on Form 10-K.
     Interim Disclosures about Fair Value of Financial Instruments. In April 2009, the FASB issued a standard,
which enhances consistency in financial reporting by increasing the frequency of fair value disclosures. This
standard is effective for interim and annual periods ending after June 15, 2009. The Company’s adoption of this
standard in the second quarter of 2009 did not have a material impact on its audited consolidated financial
statements included in this Annual Report on Form 10-K. For additional disclosures required under this standard,
see Note 4, “Fair Value Disclosures.”
     Employers’ Disclosures about Postretirement Benefit Plan Assets. In December 2008, the FASB issued a
standard, which provides guidance on an employer’s disclosures about plan assets of a defined benefit pension or
other postretirement plan. The Company adopted the disclosures about plan assets required by the standard
prospectively for the fiscal year ended December 26, 2009. See Note 9, “Pension and Other Postretirement Benefits,”
for more information. The adoption of the standard did not have a material impact on the Company’s audited
consolidated financial statements.
     Fiscal Years. The Company’s fiscal years ended on the last Saturday in December. Fiscal years 2009, 2008 and
2007 each are comprised of 52 weeks. Unless otherwise stated, references to years in the consolidated financial
statements relate to fiscal years.
      Principles of Consolidation. The consolidated financial statements include the accounts of the Company and
all of its subsidiaries. Investments in affiliates over which the Company has significant influence, but neither a
controlling interest nor a majority interest in the risks or rewards of the investee, are accounted for using the equity
method. The Company’s equity investments are not significant. Intercompany accounts have been eliminated in
consolidation.
      Cash and Cash Equivalents. Cash includes currency on hand and time deposits with banks or other financial
institutions. Cash equivalents represent money market mutual funds, a form of highly liquid investments with
original maturities of less than three months. As a result of the Company’s normal payment cycle, cash disbursement
accounts representing outstanding checks not yet presented for payment of $1,594.2 million and $1,411.1 million are
included in claims and other accounts payable, and client rebates and guarantees payable at December 26, 2009 and
December 27, 2008, respectively, including certain amounts reclassified from cash. No overdraft or unsecured short-
term loan exists in relation to these negative balances.
     Long-Term and Short-Term Investments. The Company holds long-term and short-term investments in
U.S. government securities to satisfy the statutory capital requirements for the Company’s insurance subsidiaries.
The majority of these long-term and short-term investments are classified as held-to-maturity securities and reported
at amortized cost. The Company has no exposure to or investments in any instruments associated with the sub-prime
loan market.
     Fair Value Measurements and Fair Value of Financial Instruments. The Company accounts for and reports
the fair value of certain assets and liabilities in accordance with FASB standards. See Note 4, “Fair Value
Disclosures,” for more information.


                                                           77
Accounts Receivable. The Company separately reports accounts receivable due from manufacturers and
accounts receivable due from clients. Manufacturer accounts receivable, net, includes billed and estimated unbilled
receivables from manufacturers for earned rebates and other prescription services. Unbilled rebates receivable from
manufacturers are generally billed beginning 20 days from the end of each quarter.
      Client accounts receivable, net, includes billed and estimated unbilled receivables from clients for the PBM and
Specialty Pharmacy segments. Unbilled PBM receivables are primarily from clients and are typically billed within
14 days based on the contractual billing schedule agreed upon with each client. At the end of any given reporting
period, unbilled PBM receivables from clients may represent up to two weeks of dispensing activity and will
fluctuate at the end of a fiscal month depending on the timing of these billing cycles. Client accounts receivable,
net, also includes a reduction for rebates and guarantees payable to clients when such are settled on a net basis in
the form of an invoice credit. In cases where rebates and guarantees are settled with the client on a net basis, and
the rebates and guarantees payable are greater than the corresponding client accounts receivable balances, the net
liability is reclassified to client rebates and guarantees payable on the consolidated balance sheets. When these
payables are settled in the form of a check or wire, they are recorded on a gross basis and the entire liability is
reflected in client rebates and guarantees payable on the consolidated balance sheets. The Company’s client accounts
receivable also includes receivables from CMS for the Company’s Medicare Part D Prescription Drug Program
(“Medicare Part D”) product offerings and premiums from members. A component of the PBM business includes
diabetes supplies dispensed by PolyMedica with the associated receivables primarily reimbursed from insurance
companies and government agencies. As a result, this component of the PBM business experiences slower accounts
receivable turnover.
     As of December 26, 2009 and December 27, 2008, identified net Specialty Pharmacy accounts receivable,
primarily due from payors and patients, amounted to $483.1 million and $476.4 million, respectively. A portion of
the Specialty Pharmacy business includes reimbursement by payors, such as insurance companies, under a medical
benefit, or by Medicare or Medicaid. These transactions also involve higher patient co-payments than experienced in
the PBM business. As a result, this portion of the Specialty Pharmacy business, which yields a higher margin than
the PBM business, experiences slower accounts receivable turnover than in the aforementioned PBM cycle and has a
different credit risk profile. See Note 13, “Segment and Geographic Data,” for more information on the Specialty
Pharmacy segment.
     The Company’s allowance for doubtful accounts as of December 26, 2009 and December 27, 2008 of
$133.3 million and $120.0 million, respectively, includes $86.1 million and $71.9 million, respectively, related to the
Specialty Pharmacy segment. The relatively higher allowance for the Specialty Pharmacy segment reflects a different
credit risk profile than the PBM business, and is characterized by reimbursement through medical coverage,
including government agencies, and higher patient co-payments. The Company’s allowance for doubtful accounts as
of December 26, 2009 and December 27, 2008 also includes $37.4 million and $34.6 million, respectively, related to
PolyMedica for diabetes supplies, which are primarily reimbursed by insurance companies and government agencies.
In addition, the Company’s allowance for doubtful accounts also reflects amounts associated with member premiums
for the Company’s Medicare Part D product offerings. The Company regularly reviews and analyzes the adequacy of
the allowances based on a variety of factors, including the age of the outstanding receivable and the collection
history. When circumstances related to specific collection patterns change, estimates of the recoverability of
receivables are adjusted. The increase in the reserve balance reflects increased coverage of aged balances.
     Concentrations of Risks. In 2009, 2008 and 2007, the Company had one client that represented 19%, 21% and
22% of net revenues, respectively. The client has a strong investment grade rating and has consistently paid their
receivable balance within the contracted payment terms. None of the Company’s other clients individually
represented more than 10% of net revenues or net client accounts receivable in 2009, 2008 or 2007.
     The Company has credit risk associated with certain accounts receivable, which consists of amounts owed by
various governmental agencies, insurance companies and private patients. The Company has clients in various
industries, including the automobile manufacturer industry and the financial industry, as well as governmental
agencies. The Company actively monitors the status of its accounts receivable and has mechanisms in place to
minimize the potential for incurring material accounts receivable credit risk. Concentration of credit risk relating to
these accounts receivable, excluding the largest client noted above, is limited by the diversity and number of patients
and payors.


                                                          78
As of December 26, 2009 and December 27, 2008, two brand-name pharmaceutical manufacturers represented
approximately 41% and 30% of manufacturer accounts receivable, net, respectively. Both manufacturers have strong
investment grade ratings and have consistently paid their receivable balance within the contracted payment terms. To
date, the Company has not experienced any significant deterioration in its client or manufacturer accounts
receivables.
     The Company purchases its pharmaceuticals either from its primary wholesaler, AmerisourceBergen Corp.,
which accounted for approximately 62% of both the Company’s overall 2009 and 2008 drug purchases, respectively,
or directly from pharmaceutical manufacturers. Most of the purchases from the Company’s primary wholesaler were
for brand-name medicines. The Company believes that alternative sources of supply for most generic and brand-
name pharmaceuticals are readily available, except to the extent that brand-name drugs are available to the market
exclusively through the manufacturer.
      The Company derives a substantial percentage of its Specialty Pharmacy segment revenue and profitability from
its relationships with a limited number of suppliers. Specialty and generic pharmaceuticals are generally purchased
directly from manufacturers.
     Inventories, Net. Inventories, net, are located in the Company’s mail-order pharmacies and in warehouses,
consist solely of finished product (primarily prescription drugs), and are valued at the lower of first-in, first-out
(FIFO) cost or market.
     Property and Equipment, Net. Property and equipment, net, is stated at cost, less accumulated depreciation and
amortization. Depreciation is calculated using the straight-line method for assets with useful lives as follows:
buildings, 45 years; machinery, equipment and office furnishings, three to 15 years; and computer software, three to
five years. Leasehold improvements are amortized over the shorter of the remaining life of the lease or the useful
lives of the assets. In accordance with Authoritative Guidance on accounting for the costs of computer software
developed or obtained for internal use, certain costs of computer software developed or obtained for internal use are
capitalized and amortized on a straight-line basis over three to five years. Costs for general and administrative
expenses, overhead, maintenance and training, as well as the cost of software coding that does not add functionality
to existing systems, are expensed as incurred.
      Net Revenues. Product net revenues consist principally of sales of prescription drugs to clients and members,
either through the Company’s networks of contractually affiliated retail pharmacies or through the Company’s mail-
order pharmacies. The majority of the Company’s product net revenues are derived on a fee-for-service basis. The
Company’s product net revenues also include revenues from the sale of diabetes supplies by PolyMedica. Specialty
pharmacy product net revenues represent revenues from the sale of primarily biopharmaceutical drugs and are
reported at the net amount billed to third-party payors and patients. The Company recognizes product revenues when
the prescriptions are dispensed through retail pharmacies in the Company’s networks of contractually affiliated retail
pharmacies or the Company’s mail-order pharmacies and received by members and patients. The Company evaluates
client contracts using the indicators of Authoritative Guidance to determine whether the Company acts as a principal
or as an agent in the fulfillment of prescriptions through the retail pharmacy network. The Company acts as a
principal in most of its transactions with clients and revenues are recognized at the prescription price (ingredient
cost plus dispensing fee) negotiated with clients, including the portion of the price allocated by the client to be
settled directly by the member (co-payment), as well as the Company’s administrative fees (“Gross Reporting”).
Gross reporting is appropriate because the Company (a) has separate contractual relationships with clients and with
pharmacies, (b) is responsible to validate and economically manage a claim through its claims adjudication process,
(c) commits to set prescription prices for the pharmacy, including instructing the pharmacy as to how that price is to
be settled (co-payment requirements), (d) manages the overall prescription drug relationship with the patients, who
are members of clients’ plans, and (e) has credit risk for the price due from the client. In limited instances where
the Company adjudicates prescriptions at pharmacies that are under contract directly with the client and there are no
financial risks to the Company, such revenue is recorded at the amount of the administrative fee earned by the
Company for processing the claim (“Net Reporting”).


                                                            79
The Company’s product net revenues also include premiums associated with the Company’s Medicare PDP
risk-based product offerings. These products involve prescription dispensing for beneficiaries enrolled in the CMS-
sponsored Medicare Part D prescription drug benefit. The Company’s two insurance company subsidiaries have been
operating under contracts with CMS since 2006, and currently offer several Medicare PDP options. The products
involve underwriting the benefit, charging enrollees applicable premiums, providing covered prescription drugs and
administering the benefit as filed with CMS. The Company provides three Medicare drug benefit plan options for
beneficiaries, including (i) a “standard Part D” benefit plan as mandated by statute, and (ii) two benefit plans with
enhanced coverage, that exceed the standard Part D benefit plan, available for an additional premium. The Company
also offers numerous customized benefit plan designs to employer group retiree plans under the Medicare Part D
prescription drug benefit.
      The PDP premiums are determined based on the Company’s annual bid and related contractual arrangements
with CMS. The PDP premiums are primarily comprised of amounts received from CMS as part of a direct subsidy
and an additional subsidy from CMS for low-income member premiums, as well as premium payments received
from members. These premiums are recognized ratably to product net revenues over the period in which members
are entitled to receive benefits. Premiums received in advance of the applicable benefit period are deferred and
recorded in accrued expenses and other current liabilities on the consolidated balance sheets. There is a possibility
that the annual costs of drugs may be higher or lower than premium revenues. As a result, CMS provides a risk
corridor adjustment for the standard drug benefit that compares the Company’s actual annual drug costs incurred to
the targeted premiums in the Company’s CMS-approved bid. Based on specific collars in the risk corridor, the
Company will receive from CMS additional premium amounts or be required to refund to CMS previously received
premium amounts. The Company calculates the risk corridor adjustment on a quarterly basis based on drug cost
experience to date and records an adjustment to product net revenues with a corresponding account receivable from
or payable to CMS reflected on the consolidated balance sheets.
     In addition to premiums, there are certain co-payments and deductibles (the “cost share”) due by members
based on prescription orders by those members, some of which are subsidized by CMS in cases of low-income
membership. For subsidies received in advance, the amount is deferred and recorded in accrued expenses and other
current liabilities on the consolidated balance sheets. If there is cost share due from members or CMS, the amount is
accrued and recorded in client accounts receivable, net, on the consolidated balance sheets. After the end of the
contract year and based on actual annual drug costs incurred, cost share amounts are reconciled with CMS and the
corresponding receivable or payable is settled. The cost share is treated consistently as other co-payments derived
from providing PBM services, as a component of product net revenues on the consolidated statements of income
where the requirements of Authoritative Guidance are met. Premium revenues for our PDP products, which exclude
member cost share, were $543 million, or less than 1% of total net revenues, in 2009, $317 million, or less than 1%
of total net revenues, in 2008, and $255 million, or less than 1% of total net revenues, in 2007.
     The Company’s agreements with CMS, as well as applicable Medicare Part D regulations and federal and state
laws, require the Company to, among other obligations: (i) comply with certain disclosure, filing, record-keeping
and marketing rules; (ii) operate quality assurance, drug utilization management and medication therapy manage-
ment programs; (iii) support e-prescribing initiatives; (iv) implement grievance, appeals and formulary exception
processes; (v) comply with payment protocols, which include the return of overpayments to CMS and, in certain
circumstances, coordination with state pharmacy assistance programs; (vi) use approved networks and formularies,
and provide access to such networks to any willing pharmacy; (vii) provide emergency out-of-network coverage;
and (viii) adopt a comprehensive Medicare and Fraud, Waste and Abuse compliance program. The Company has
various contractual and regulatory compliance requirements associated with participating in Medicare Part D. Similar
to the Company’s requirements with other clients, the Company’s policies and practices associated with executing its
PDP are subject to audit. If material contractual or regulatory non-compliance was to be identified, monetary
penalties and/or applicable sanctions, including suspension of enrollment and marketing or debarment from
participation in Medicare programs, may be imposed. Additionally, each calendar year, payment will vary based on
the annual benchmark that applies as a result of Medicare Part D plan bids for the applicable year, as well as for
changes in the CMS methodology for calculating risk adjustment factors.


                                                         80
Rebates and guarantees regarding the level of service the Company will provide to the client or member or the
minimum level of rebates or discounts the client will receive are deducted from product net revenues as they are
earned by the client. Rebates are generally credited or paid to clients subsequent to collections from pharmaceutical
manufacturers, although there are certain instances where rebates are paid to clients on a more accelerated basis.
Other contractual payments made to clients are generally made upon initiation of contracts as implementation
allowances, which may, for example, be designated by clients as funding for their costs to transition their plans to
the Company. The Company considers these payments to be an integral part of the Company’s pricing of a contract
and believes that they represent variability in the timing of cash flows that does not change the underlying
economics of the contract. Accordingly, these payments are capitalized and amortized as a reduction of product net
revenues, generally on a straight-line basis, over the life of the contract where the payments are refundable upon
cancellation of the contract or relate to noncancelable contracts. Amounts capitalized are assessed periodically for
recoverability based on the profitability of the contract.
     Service revenues consist principally of administrative fees and clinical program fees earned from clients, sales
of prescription services to pharmaceutical manufacturers, performance-oriented fees paid by Specialty Pharmacy
manufacturers, and other non-product-related revenues. Service revenues are recorded by the Company when
performance occurs and collectibility is assured.
     Cost of Revenues. Cost of product net revenues includes the cost of inventory dispensed from the mail-order
pharmacies, along with direct dispensing costs and associated depreciation. Cost of product net revenues also
includes ingredient costs of drugs dispensed by and professional fees paid to retail network pharmacies. In addition,
cost of product net revenues includes the operating costs of the Company’s call center pharmacies, which primarily
respond to member and retail pharmacist inquiries regarding member prescriptions, as well as physician calls. Cost
of product net revenues also includes an offsetting credit for rebates earned from pharmaceutical manufacturers
whose drugs are included on the Company’s preferred drug lists, which are also known as formularies. Rebates
receivable from pharmaceutical manufacturers are accrued in the period earned by multiplying estimated rebatable
prescription drugs dispensed through the Company’s retail networks and through the Company’s mail-order
pharmacies by the contractually agreed manufacturer rebate amount.
     Rebates receivable estimates are revised to actual, with the difference recorded to cost of revenues, upon billing
to the manufacturer, generally 20 to 90 days subsequent to the end of the applicable quarter. These bills are not
issued until the necessary specific eligible claims and third-party market share data are received and thoroughly
analyzed. Historically, the effect of adjustments resulting from the reconciliation of rebates recognized and recorded
to actual amounts billed has not been material to the Company’s results of operations.
     The Company’s cost of product net revenues also includes the cost of drugs dispensed by the Company’s mail-
order pharmacies or retail networks for members covered under the Company’s Medicare PDP product offerings and
are recorded at cost as incurred. The Company receives a catastrophic reinsurance subsidy from CMS for
approximately 80% of costs incurred by individual members in excess of the individual annual out-of-pocket
maximum of $4,350 for coverage year 2009, $4,050 for coverage year 2008 and $3,850 for coverage year 2007. The
subsidy is reflected as an offsetting credit in cost of product net revenues to the extent that catastrophic costs are
incurred. Catastrophic reinsurance subsidy amounts received in advance are deferred and recorded in accrued
expenses and other current liabilities on the consolidated balance sheets. If there are catastrophic reinsurance
subsidies due from CMS, the amount is recorded in client accounts receivable, net, on the consolidated balance
sheets. After the end of the contract year and based on actual annual drug costs incurred, catastrophic reinsurance
amounts are reconciled with CMS and the corresponding receivable or payable is settled. Cost of service revenues
consist principally of labor and operating costs for delivery of services provided, as well as costs associated with
member communication materials.


                                                          81
Goodwill. Goodwill of $6,333.0 million at December 26, 2009 and $6,331.4 million at December 27, 2008
represents, for the PBM segment, the excess of acquisition costs over the fair value of the Company’s net assets that
had been pushed down to the consolidated balance sheets of the Company and existed when the Company became
an independent, publicly traded enterprise in 2003, and, to a significantly lesser extent, the Company’s acquisition of
a majority interest in Europa Apotheek in 2008, and the acquisitions of PolyMedica in 2007 and ProVantage Health
Services, Inc. in 2000. Goodwill also includes, for the Specialty Pharmacy segment, a portion of the excess of the
purchase price the Company paid to acquire Accredo Health, Incorporated (“Accredo”) over the fair value of
tangible net assets acquired, as well as, to a significantly lesser extent, the Company’s acquisition of Critical Care
Systems, Inc. (“Critical Care”) in 2007, and the acquisition of selected assets of Pediatric Services of America, Inc.
in 2005. See Note 3, “Acquisitions of Businesses,” for more information on the acquisition of a majority interest in
Europa Apotheek, and the PolyMedica and Critical Care acquisitions. The Company’s goodwill balance is assessed
for impairment annually using a two-step fair-value based test or whenever events or other changes in circumstances
indicate the carrying amount may not be recoverable, by comparing the fair value of each segment’s reporting units
to the carrying value of the assets and liabilities assigned to each reporting unit. If the carrying value of the
reporting unit were to exceed the Company’s estimate of the fair value of the reporting unit, the Company would
then be required to estimate the fair value of the individual assets and liabilities within the reporting unit for
purposes of calculating the fair value of goodwill. The Company would be required to record an impairment charge
to the extent recorded goodwill exceeds the fair value amount of goodwill resulting from this allocation. The most
recent assessment for impairment of goodwill for each of the designated reporting units was performed as of
September 26, 2009, and the goodwill was determined not to be impaired, and there have been no significant
subsequent changes in events or circumstances. The Company utilized the income approach methodology, which
projects future cash flows discounted to present value. Discount rates were based on the estimated weighted average
cost of capital at the reporting unit level and ranged from 9% to 13%. In order to validate the reasonableness of the
estimated fair values, the Company performed a reconciliation of the aggregate fair values of all reporting units to
market capitalization as of the valuation date using a reasonable control premium.
      Intangible Assets, Net. Intangible assets, net, of $2,428.8 million at December 26, 2009 and $2,666.4 million at
December 27, 2008 for the PBM segment primarily represent the value of Medco’s client relationships that had been
pushed down to the consolidated balance sheets of the Company and existed when the Company became an independent,
publicly traded enterprise in 2003, and to a lesser extent, intangible assets recorded upon the Company’s acquisition of
PolyMedica in 2007 and a majority stake in Europa Apotheek in 2008. Additionally, for the Specialty Pharmacy segment,
intangible assets primarily include the portion of the excess of the purchase price paid by the Company to acquire
Accredo in 2005 over tangible net assets acquired. The Company’s intangible assets are initially recorded at fair value at
the acquisition date and subsequently carried at amortized cost. The Company reviews intangible assets for impairment
whenever events, such as losses of significant clients or specialty product manufacturer contracts, or when other changes
in circumstances indicate the carrying amount may not be recoverable. When these events occur, the carrying amount of
the assets is compared to the pre-tax undiscounted expected future cash flows derived from the lowest appropriate asset
grouping. If this comparison indicates impairment exists, the amount of the impairment would be calculated using
discounted expected future cash flows. The Liberty trade name intangible asset was assigned an indefinite life at the time
of our acquisition of PolyMedica in 2007. Subsequently in 2008, management determined that the Liberty trade name
intangible asset was no longer indefinite-lived and assigned a 35-year useful life.
     Income Taxes. Deferred tax assets and liabilities are recorded based on temporary differences between the
financial statement basis and the tax basis of assets and liabilities using presently enacted tax rates.
     On December 31, 2006, the first day of the Company’s 2007 fiscal year, the Company adopted the provisions of a
new FASB standard, which clarifies the accounting for uncertainty in income taxes recognized in companies’ financial
statements. The standard prescribes a recognition threshold and measurement attribute for the financial statement
recognition and measurement of a tax position taken or expected to be taken in a tax return. The evaluation of a tax
position in accordance with the standard is a two-step process. The first step is recognition to determine whether it is
more likely than not that a tax position will be sustained upon examination. The second step is measurement whereby
a tax position that meets the more-likely-than-not recognition threshold is measured to determine the amount of benefit
to recognize in the financial statements. The standard also provides guidance on derecognition of recognized tax
benefits, classification, interest and penalties, accounting in interim periods, disclosure and transition. As a result of the
implementation of the FASB’s uncertainty in income taxes standard, the Company recognized a decrease of
$43.4 million in the liability for income tax contingencies, including interest, no longer required under the more-likely-
than-not accounting model, and a $29.3 million corresponding increase, net of federal income tax benefit, to the
December 31, 2006 (the first day of fiscal year 2007) balance of retained earnings. In May 2007, the FASB issued
additional guidance on how a company should determine whether a tax position is effectively settled for the purpose of
recognizing previously unrecognized tax benefits. See Note 10, “Taxes on Income,” for more information.

                                                             82
Use of Estimates. The consolidated financial statements include certain amounts that are based on
management’s best estimates and judgments. Estimates are used in determining such items as accruals for rebates
receivable and payable, client guarantees, depreciable/useful lives, allowance for doubtful accounts, testing for
impairment of goodwill and intangible assets, stock-based compensation, income taxes, pension and other postretire-
ment benefit plan assumptions, amounts recorded for contingencies, and other reserves, as well as CMS-related
activity, including the risk corridor adjustment and cost share and catastrophic reinsurance subsidies. Because of the
uncertainty inherent in such estimates, actual results may differ from these estimates.
     Operating Segments. The Company has two reportable segments, PBM and Specialty Pharmacy. See Note 13,
“Segment and Geographic Data,” for more information. The PBM and Specialty Pharmacy segments primarily
operate in the United States and have limited activity in Puerto Rico, Germany and the United Kingdom.
     Earnings per Share (“EPS”). Basic EPS is computed by dividing net income by the weighted average number
of shares of common stock issued and outstanding during the reporting period. The Company treats stock options
and restricted stock units granted by the Company as potential common shares outstanding in computing diluted
earnings per share. Under the treasury stock method on a grant by grant basis, the amount the employee or director
must pay for exercising the award, the amount of compensation cost for future service that the Company has not yet
recognized, and the amount of tax benefit that would be recorded in additional paid-in capital when the award
becomes deductible, are assumed to be used to repurchase shares at the average market price during the period.
     The Company granted options of 6.6 million shares in fiscal 2009, 5.1 million shares in fiscal 2008, and
7.1 million shares in fiscal 2007. For the years ended December 26, 2009, December 27, 2008 and December 29,
2007, there were outstanding options to purchase 5.1 million, 5.6 million and 6.7 million shares of Medco stock,
respectively, which were not dilutive to the EPS calculations when applying the treasury stock method. These
outstanding options may be dilutive to future EPS calculations.
     The following is a reconciliation of the number of weighted average shares used in the basic and diluted EPS
calculations (amounts in millions):
    Fiscal Years                                                                                          2009    2008    2007
    Basic weighted average shares outstanding . . . . . . . . . . . . . . . . . . . . . . . . . . . . .   481.1   508.6   550.2
    Dilutive common stock equivalents:
      Outstanding stock options, restricted stock units and restricted stock . . . . . . . .                8.9    10.0    10.7
    Diluted weighted average shares outstanding . . . . . . . . . . . . . . . . . . . . . . . . . . .     490.0   518.6   560.9

     The decreases in the weighted average share outstanding and diluted weighted average shares outstanding for
each year result from the repurchase of approximately 186.3 million shares of stock in connection with the
Company’s share repurchase programs since inception in 2005 through the end of 2009, compared to equivalent
amounts of 159.0 million and 111.4 million shares repurchased inception-to-date through the ends of 2008 and
2007, respectively. The Company repurchased approximately 27.3 million, 47.6 million shares and 53.3 million
shares in fiscal years 2009, 2008 and 2007, respectively.
    The above share data has been retrospectively adjusted to reflect the January 24, 2008 two-for-one stock split.
See Note 1, “Background and Basis of Presentation,” for more information.


                                                                    83
Other Comprehensive Income and Accumulated Other Comprehensive Income. Other comprehensive income
includes unrealized investment gains and losses, foreign currency translation adjustments resulting primarily from
the translation of Europa Apotheek’s assets and liabilities and results of operations, unrealized gains and losses on
effective cash flow hedges, prior service costs or credits and actuarial gains or losses associated with pension or
other postretirement benefits that arise during the period, as well as the amortization of prior service costs or credits
and actuarial gains or losses, which are reclassified as a component of net benefit expense, and the tax effect
allocated to each component of other comprehensive income.
      The accumulated other comprehensive income (“AOCI”) component of stockholders’ equity includes: unreal-
ized investment gains and losses, net of tax; foreign currency translation adjustments resulting primarily from the
translation of Europa Apotheek’s assets and liabilities and results of operations; unrealized gains and losses on
effective cash flow hedges, net of tax; and the net gains and losses and prior service costs and credits related to the
Company’s pension and other postretirement benefit plans, net of tax. The year-end balances in AOCI related to the
Company’s pension and other postretirement benefit plans consist of amounts that have not yet been recognized as
components of net periodic benefit cost in the consolidated statement of income.
     The amounts recognized in AOCI at December 29, 2007, December 27, 2008 and December 26, 2009 and the
components and allocated tax effects included in other comprehensive income in fiscal 2008 and 2009 are as follows
($ in millions):
                                                                              Net Unrealized
                                                              Foreign         Gains (Losses)   Net Prior
                                            Unrealized       Currency          on Effective     Service    Net Actuarial
                                          Gains (Losses)    Translation         Cash Flow       Benefit        Gains           Total
                                          on Investments   Gains (Losses)         Hedges        (Cost)       (Losses)          AOCI

Balances at December 29,
  2007, net of tax . . . . . . . . . .        $ —             $     —            $ (4.8)        $25.5        $(14.3)       $      6.4
Fiscal 2008 activity:
  Before tax amount . . . . . . . .            (0.3)              (15.5)          (25.0)          (5.0)        (59.8)          (105.6)
  Tax benefit . . . . . . . . . . . . .         0.1                  —              9.8            2.0          23.5             35.4
Net-of-tax change . . . . . . . . . .          (0.2)              (15.5)(1)       (15.2)(2)       (3.0)        (36.3)(3)        (70.2)
Balances at December 27,
  2008, net of tax . . . . . . . . . .        $(0.2)          $(15.5)            $(20.0)        $22.5        $(50.6)       $ (63.8)
Fiscal 2009 activity:
  Before tax amount . . . . . . . .            (0.2)                2.9              3.6          (4.0)         28.6             30.9
  Tax benefit . . . . . . . . . . . . .         0.1                  —              (1.7)          1.6         (11.3)           (11.3)
Net-of-tax change . . . . . . . . . .          (0.1)                2.9 (1)          1.9 (4)      (2.4)         17.3 (5)         19.6
Balances at December 26,
  2009, net of tax . . . . . . . . . .        $(0.3)          $(12.6)            $(18.1)        $20.1        $(33.3)       $ (44.2)
(1)
     This primarily represents the unrealized net foreign currency translation gains (losses) resulting from the trans-
     lation of majority-owned Europa Apotheek’s net assets acquired from the April 28, 2008 acquisition date.
 (2)
     The net unrealized losses on cash flow hedges consist of the unrealized loss on effective cash flow hedges of
     $(16.9) million, net of taxes, which settled in 2008, offset by the associated amortization of $1.7 million, net of taxes.
 (3)
     Net actuarial losses reflect an increase in the unfunded status of the Company’s pension plans due to reductions
     in pension plan assets from investment losses in 2008, and increased benefit obligations related to increased
     plan participants.
 (4)
     Consists of the amortization of the unrealized loss on the effective portion of the cash flow hedges.
 (5)
     Net actuarial gains primarily reflect increases in pension plan assets from investing gains in 2009.
      See Note 9, “Pension and Other Postretirement Benefits,” for additional information on the reclassification
adjustments included within the components of other comprehensive income related to the Company’s defined
benefit plans.
      Contingencies. In the ordinary course of business, the Company is involved in litigation, claims, government
inquiries, investigations, charges and proceedings, including, but not limited to, those relating to regulatory,
commercial, employment, employee benefits and securities matters. In accordance with the FASB’s standard on
accounting for contingencies, the Company records accruals for contingencies when it is probable that a liability
will be incurred and the amount of loss can be reasonably estimated. The Company’s recorded reserves are based on
estimates developed with consideration given to the potential merits of claims, the range of possible settlements,
advice from outside counsel, and management’s strategy with regard to the settlement of or defense against such
claims. See Note 14, “Commitments and Contingencies,” for additional information.


                                                                    84
Stock-Based Compensation. The Company accounts for stock-based compensation in accordance with a
standard issued by the FASB and guidance issued by the Securities and Exchange Commission (“SEC”), which
require the measurement and recognition of compensation expense for all stock-based compensation awards made to
employees and directors, including employee stock options and employee stock purchase plans.
     The standard requires companies to estimate the fair value of stock-based awards on the date of grant using an
option-pricing model. The portion of the value that is ultimately expected to vest is recognized as expense over the
requisite service period. As stock-based compensation expense recognized in our audited consolidated statements of
income for fiscal years 2009, 2008 and 2007 is based on awards ultimately expected to vest, it has been reduced for
estimated forfeitures. The standard requires forfeitures to be estimated at the time of grant and revised, if necessary,
in subsequent periods if actual forfeitures differ from those estimates.
     In addition, the standard requires that the benefits of realized tax deductions in excess of tax benefits on
compensation expense, which amounted to $64.3 million, $41.8 million and $69.9 million for fiscal years 2009,
2008 and 2007, respectively, be reported as a component of cash flows from financing activities rather than as an
operating cash flow, as previously required. In accordance with Authoritative Guidance issued by the SEC, the
Company classifies stock-based compensation within cost of product net revenues and SG&A expenses to
correspond with the financial statement components in which cash compensation paid to employees and directors is
recorded.
      Foreign Currency Translation. The Company’s consolidated financial statements are presented in U.S. dollars.
In 2008, the Company acquired a majority interest in Europa Apotheek, a company based in the Netherlands, with
the Euro as its local currency, and in 2009, the Company entered into a joint venture with United Drug plc, a
company based in the United Kingdom, with the British pound as its local currency. Europa Apotheek’s assets and
liabilities, and the Company’s investment in the United Drug plc joint venture are translated into U.S. dollars at the
exchange rates in effect at balance sheet dates, and revenues and expenses are translated at the weighted average
exchange rates prevailing during the month of the transaction. Adjustments resulting from translating net assets are
reported as a separate component of AOCI within stockholders’ equity.

  Recently Issued Accounting Pronouncement.
      Fair Value Measurements and Disclosures. In January 2010, the FASB issued a standard, which amends the
existing fair value measurements and disclosure standard and provides guidance on increased disclosures on transfers
in and out of Levels 1 and 2 and activity in Level 3 fair value measurements. The standard also clarifies existing
fair value measurement disclosure guidance about the level of disaggregation, inputs, and valuation techniques. The
new disclosures and clarifications of existing disclosures are effective for interim and annual reporting periods
beginning after December 15, 2009, except for the disclosures about purchases, sales, issuances, and settlements in
the roll forward of activity in Level 3 fair value measurements, which are effective for fiscal years beginning after
December 15, 2010, and for interim periods within those fiscal years. The Company does not expect the adoption of
the standard to have a material impact on its consolidated financial statements.

3. ACQUISITIONS OF BUSINESSES
      Europa Apotheek Venlo B.V. On April 28, 2008, the Company acquired a majority interest in Europa
Apotheek, a privately held company based in the Netherlands that primarily provides mail-order pharmacy services
in Germany. The cost of the acquisition was approximately $126.8 million in cash and a $24.1 million purchase
obligation, with additional potential future consideration for achieving performance targets. The Company believes
this acquisition leverages its proven proprietary technologies and ability to deliver customized solutions to meet the
challenges of managing healthcare costs and improving clinical care abroad. The transaction was accounted for
under the provisions of FASB’s business combinations standard. The purchase price was allocated based upon the
fair value of net assets acquired at the date of the acquisition. A portion of the excess of the purchase price over
tangible net assets acquired, amounting to $112.8 million, has been allocated to goodwill, and $43.9 million has
been allocated to intangible assets, which are being amortized using the straight-line method over an estimated
weighted average useful life of 9.1 years. Additionally, there is a deferred tax liability of $11.1 million associated
with the fair value amounts allocated to intangible assets. Europa Apotheek’s operating results from the date of
acquisition of April 28, 2008 through December 26, 2009 are included in the accompanying audited consolidated
financial statements. Pro forma financial statement results including the results of Europa Apotheek would not differ
materially from the Company’s historically reported financial statement results.


                                                           85
PolyMedica Corporation. On October 31, 2007, the Company acquired all of the outstanding common stock of
PolyMedica for $1.3 billion in cash. PolyMedica is a leading provider of diabetes care through its Liberty brand,
including blood glucose testing supplies, prescriptions and related services. Previously in 2006, Medco formed a
multi-pronged alliance with PolyMedica, enabling Medco to become the direct mail dispensing pharmacy for their
members, and provide PolyMedica’s Medicare Part B solution to Medco clients. This acquisition supports the
Company’s ability to deliver advanced, specialized pharmacy services by treating patients at the disease level. Under
the terms of the Agreement and Plan of Merger dated August 27, 2007, PolyMedica shareholders received $53 in
cash for each outstanding share of PolyMedica common stock. The Company funded the transaction on October 31,
2007 through a combination of bank borrowings from its existing $2 billion revolving credit facility and cash on
hand.
      The transaction was accounted for under the provisions of FASB’s business combinations standard. The
purchase price was allocated based upon the fair value of net assets acquired at the date of the acquisition. A portion
of the excess of the purchase price over tangible net assets acquired was allocated to intangible assets, consisting of
the Liberty trade name of $392.0 million with an estimated 35-year life, customer relationships of $119.9 million
with an estimated 8-year life, non-compete agreements of $26.8 million with an estimated 3-year life, and customer
lists of $2.8 million with an estimated 4-year life. These assets are included in intangible assets, net, in the
consolidated balance sheets. The purchase price for PolyMedica was primarily determined on the basis of
management’s expectations of future earnings and cash flows, and resulted in the recording of goodwill of
$1.0 billion, which is not tax deductible. In accordance with the FASB standard, the goodwill is not being
amortized.
     PolyMedica’s operating results from the date of acquisition of October 31, 2007 through December 26, 2009,
are included in the accompanying consolidated financial statements. The unaudited pro forma results of operations
of the Company and PolyMedica, prepared based on the purchase price allocation for PolyMedica described above
and as if the PolyMedica acquisition had occurred at the beginning of fiscal year 2007, would have been as follows
($ in millions, except for per share amounts):
                                                                                                          2007
                    Fiscal Year                                                                        (Unaudited)

                    Pro forma total net revenues . . . . . . . . . . . . . . . . . . . . . . . . . . $     44,982.5
                    Pro forma net income . . . . . . . . . . . . . . . . . . . . . . . . . . . . . . . $      887.4

                    Pro forma basic earnings per common share . . . . . . . . . . . . . . $                   1.61
                    Pro forma diluted earnings per common share . . . . . . . . . . . . . $                   1.58
      The above per share data has been retrospectively adjusted to reflect the January 24, 2008 two-for-one stock
split. See Note 1, “Background and Basis of Presentation,” for more information. The pro forma financial
information above is not necessarily indicative of what the Company’s consolidated results of operations actually
would have been if the PolyMedica acquisition had been completed at the beginning of fiscal year 2007. In addition,
the pro forma information above does not attempt to project the Company’s future results of operations.
     Critical Care. On November 14, 2007, Accredo acquired Critical Care, one of the nation’s largest providers of
home-based and ambulatory specialty infusion services, for approximately $220 million in cash. This acquisition
expands Accredo’s capabilities and market presence related to infused agents. The transaction was accounted for
under the provisions of FASB’s business combinations standard. The purchase price has been allocated based upon
the fair value of net assets acquired at the date of the acquisition. A portion of the excess of the purchase price over
tangible net assets acquired, amounting to $121.4 million, was allocated to goodwill, and $68.0 million was
allocated to intangible assets, which are being amortized using the straight-line method over an estimated weighted
average useful life of approximately 13.8 years. These assets are included in intangible assets, net, and goodwill,
respectively, in the consolidated balance sheets. The Company retained third-party valuation advisors to conduct
analyses of the assets acquired and liabilities assumed in order to assist the Company with the purchase price
allocation. These analyses were used by management in the determination of the final allocation. Pro forma financial
statement results including the results of Critical Care would not differ materially from our historically reported
financial statement results.


                                                                   86
4. FAIR VALUE DISCLOSURES
Fair Value Measurements
     On December 30, 2007, the Company adopted a FASB fair value measurements accounting standard except
with respect to those nonrecurring measurements for nonfinancial assets and nonfinancial liabilities subject to the
partial deferral in related guidance issued by the FASB. Additionally in fiscal 2009, there are disclosure
requirements associated with nonfinancial assets and liabilities that did not have an impact on the Company’s
financial position or results of operations.
      Fair Value Hierarchy. The standard defines the inputs used to measure fair value into the following hierarchy:
      Level 1: Quoted market prices in active markets for identical assets or liabilities.
      Level 2: Observable market-based inputs or unobservable inputs that are corroborated by market data.
      Level 3: Unobservable inputs reflecting the reporting entity’s own assumptions.
     The Company utilizes the best available information in measuring fair value. The following tables set forth, by
level within the fair value hierarchy, the financial assets recorded at fair value on a recurring basis ($ in millions):

                                     Medco Fair Value Measurements at Reporting Date
                                                                                December 26,
Description                                                                         2009             Level 1    Level 2    Level 3
                                                                                           (1)
Money market mutual funds . . . . . . . . . . . . . . . . . . . . . . . . . .   $   1,959.0      $    1,959.0   $     —    $ —
Fair value of interest rate swap agreements . . . . . . . . . . . . . . .              14.0(2)             —        14.0     —
(1)
      Reported in cash and cash equivalents on the consolidated balance sheet.
(2)
      Reported in other noncurrent assets on the consolidated balance sheet.

                                     Medco Fair Value Measurements at Reporting Date
                                                                                December 27,
Description                                                                         2008             Level 1    Level 2    Level 3
                                                                                           (1)
Money market mutual funds . . . . . . . . . . . . . . . . . . . . . . . . . .   $     906.0      $      906.0   $     —    $ —
Fair value of interest rate swap agreements . . . . . . . . . . . . . . .              18.4(2)             —        18.4     —
(1)
      Reported in cash and cash equivalents on the consolidated balance sheet.
(2)
      Reported in other noncurrent assets on the consolidated balance sheet.
     The Company’s money market mutual funds are invested in funds that seek to preserve principal, are highly
liquid, and therefore are recorded on the consolidated balance sheets at the principal amounts deposited, which
equals the asset values quoted by the money market fund custodians. The fair value of the Company’s obligation
under its interest rate swap agreements, which hedge interest costs on the senior notes, is based upon observable
market-based inputs that reflect the present values of the difference between estimated future fixed rate payments
and future variable rate receipts, and therefore are classified within Level 2. Historically, there have not been
significant fluctuations in the fair value of the Company’s financial assets.


                                                                     87
Fair Value of Financial Instruments
     The carrying amount of the accounts receivable financing facility, the term loan and revolving credit obligations
under the Company’s senior unsecured bank credit facilities, short-term and long-term investments approximated fair
values as of December 26, 2009 and December 27, 2008. The Company estimates fair market value for these assets
and liabilities based on their market values or estimates of the present value of their cash flows.
     The carrying values and the fair values of the Company’s senior notes are shown in the following table ($ in
millions):
                                                                                     December 26, 2009              December 27, 2008
                                                                                    Carrying      Fair             Carrying      Fair
                                                                                    Amount       Value             Amount       Value
      7.25% senior notes due 2013 . . . . . . . . . . . . . . . . . . . . .        $ 498.2(1)        $ 560.8       $ 497.8(1)     $ 487.3
      6.125% senior notes due 2013 . . . . . . . . . . . . . . . . . . . .            298.8(1)          322.4         298.5(1)       284.1
      7.125% senior notes due 2018 . . . . . . . . . . . . . . . . . . . .          1,189.1(1)        1,341.2       1,188.2(1)     1,107.9
(1)
      Reported in long-term debt, net, on the consolidated balance sheets, net of unamortized discount.
     The fair values of the senior notes are based on observable relevant market information. Fluctuations between
the carrying values and the fair values of the senior notes for the periods presented are associated with changes in
market interest rates.

5. PROPERTY AND EQUIPMENT
      Property and equipment, at cost, consist of the following ($ in millions):
                                                                                                     December 26,      December 27,
                                                                                                         2009              2008
           Land and buildings . . . . . . . . . . . . . . . . . . . . . . . . . . . . . . . . . .     $     242.8        $     240.8
           Machinery, equipment and office furnishings . . . . . . . . . . . . . . .                        704.7              686.8
           Computer software . . . . . . . . . . . . . . . . . . . . . . . . . . . . . . . . . . .        1,116.9            1,042.5
           Leasehold improvements . . . . . . . . . . . . . . . . . . . . . . . . . . . . . .               137.4              126.4
           Construction in progress . . . . . . . . . . . . . . . . . . . . . . . . . . . . . . .           200.5(1)           120.6(1)
                                                                                                        2,402.3            2,217.1
           Less accumulated depreciation . . . . . . . . . . . . . . . . . . . . . . . . . .           (1,489.8)          (1,363.0)
           Property and equipment, net . . . . . . . . . . . . . . . . . . . . . . . . . . . .        $    912.5         $    854.1
(1)
      Primarily represents construction in progress on the Company’s third automated dispensing pharmacy, which is
      located in Whitestown, Indiana.
     Depreciation expense for property and equipment totaled $179.0 million, $157.7 million and $168.9 million in
fiscal years 2009, 2008 and 2007, respectively.


                                                                          88
6. LEASES
     The Company leases mail-order pharmacy and call center pharmacy facilities, offices and warehouse space
under various operating leases. In addition, the Company leases pill dispensing and counting devices and other
operating equipment for use in its mail-order pharmacies, as well as computer equipment for use in its data centers
and corporate headquarters. Rental expense was $75.3 million, $74.3 million and $61.8 million for fiscal years 2009,
2008 and 2007, respectively. The minimum aggregate rental commitments under noncancelable leases, excluding
renewal options, are as follows ($ in millions):
             Fiscal Years Ending December
             2010 . . . . . . . . . . . . . . . . . . . . . . . . . . . . . . . . . . . . . . . . . . . . . .               .............. $            50.9
             2011 . . . . . . . . . . . . . . . . . . . . . . . . . . . . . . . . . . . . . . . . . . . . . .               ..............              49.9
             2012 . . . . . . . . . . . . . . . . . . . . . . . . . . . . . . . . . . . . . . . . . . . . . .               ..............              23.6
             2013 . . . . . . . . . . . . . . . . . . . . . . . . . . . . . . . . . . . . . . . . . . . . . .               ..............              12.8
             2014 . . . . . . . . . . . . . . . . . . . . . . . . . . . . . . . . . . . . . . . . . . . . . .               ..............               7.4
             Thereafter . . . . . . . . . . . . . . . . . . . . . . . . . . . . . . . . . . . . . . . . . .                 ..............              14.7
             Total . . . . . . . . . . . . . . . . . . . . . . . . . . . . . . . . . . . . . . . . . . . . . .              .............. $           159.3

      In the normal course of business, operating leases are generally renewed or replaced by new leases.

7. GOODWILL AND INTANGIBLE ASSETS
    The changes in the Company’s carrying amount of goodwill for the years ended December 27, 2008 and
December 26, 2009 are as follows ($ in millions):
                                                                                                                                     Specialty
                                                                                                                         PBM         Pharmacy                Total
      Balances as of December 29, 2007 . . . . . . . . . . . . . . . . . . . . . .                                 $     4,318.2 $         1,912.0    $ 6,230.2
      Goodwill acquired . . . . . . . . . . . . . . . . . . . . . . . . . . . . . . . . . .                                108.0(1)            5.2(2)     113.2
      Translation adjustment and other . . . . . . . . . . . . . . . . . . . . . . . .                                     (11.5)             (0.5)       (12.0)
      Balances as of December 27, 2008 . . . . . . . . . . . . . . . . . . . . . .                                 $     4,414.7    $      1,916.7     $ 6,331.4
      Translation adjustment and other . . . . . . . . . . . . . . . . . . . . . . . .                                       2.4              (0.8)          1.6
      Balances as of December 26, 2009 . . . . . . . . . . . . . . . . . . . . . .                                 $     4,417.1    $      1,915.9     $ 6,333.0
(1)
      Primarily represents the portion of the excess of the purchase price paid by the Company to acquire a majority
      interest in Europa Apotheek. See Note 3, “Acquisitions of Businesses.”
(2)
      Represents $5.2 million of the $121.4 million allocated to Goodwill in November 2007, which is a portion of the
      excess of the purchase price paid by the Company to acquire Critical Care. See Note 3, “Acquisitions of
      Businesses.”
      The following is a summary of the Company’s intangible assets ($ in millions):
                                                                                            December 26, 2009                               December 27, 2008
                                                                                  Gross                                          Gross
                                                                                 Carrying     Accumulated                       Carrying      Accumulated
                                                                                  Value       Amortization         Net           Value        Amortization           Net

Client relationships . . . . . .      .   .   .   .   .   .   .   .   .   .   . $ 3,446.1     $ 1,977.2         $ 1,468.9      $ 3,446.1      $   1,784.9       $ 1,661.2
Trade name . . . . . . . . . . .      .   .   .   .   .   .   .   .   .   .   .     569.3          47.6             521.7          568.8             27.5           541.3
Manufacturer relationships .          .   .   .   .   .   .   .   .   .   .   .     357.5          77.5             280.0          357.5             59.6           297.9
Patient relationships . . . . .       .   .   .   .   .   .   .   .   .   .   .     280.1         127.8             152.3          212.5             67.0           145.5
Other intangible assets . . . .       .   .   .   .   .   .   .   .   .   .   .      33.7          27.8               5.9           37.3             16.8            20.5
  Total . . . . . . . . . . . . . .   .   .   .   .   .   .   .   .   .   .   . $ 4,686.7     $ 2,257.9         $ 2,428.8      $ 4,622.2      $   1,955.8       $ 2,666.4

     For intangible assets existing as of December 26, 2009, aggregate intangible asset amortization expense in each
of the five succeeding fiscal years is estimated as follows ($ in millions):
             Fiscal Years Ending December
             2010    ..........                   ................................................. $                                                  278.5
             2011    ..........                   .................................................                                                    259.8
             2012    ..........                   .................................................                                                    251.2
             2013    ..........                   .................................................                                                    246.7
             2014    ..........                   .................................................                                                    244.1
             Total . . . . . . . . . . . . . . . . . . . . . . . . . . . . . . . . . . . . . . . . . . . . . . . . . . . . . . . . . . .          $   1,280.3


                                                                                                 89
The annual intangible asset amortization expense for intangible assets existing as of December 26, 2009 is
estimated to be $278.5 million in 2010, a $27.1 million decrease from $305.6 million in 2009. The decrease is
primarily due to the application of accelerated amortization to PolyMedica customer relationships.
     The weighted average useful life of intangible assets subject to amortization is 23 years in total. The weighted
average useful life is approximately 23 years for the PBM client relationships and approximately 21 years for the
Specialty Pharmacy segment-acquired intangible assets. The Company expenses the costs to renew or extend
contracts associated with intangible assets in the period the costs are incurred. For PBM client relationships, the
weighted average contract period prior to the next renewal date as of December 26, 2009 is approximately 2.1 years.
The Company has experienced client retention rates of over 98% for the past two years.

8. DEBT
    The Company’s debt consists of the following ($ in millions):
                                                                                                         December 26,   December 27,
                                                                                                             2009           2008
         Short-term debt:
           Accounts receivable financing facility . . . . . . . . . . . . . . . . . . .                  $       —      $    600.0
           Other . . . . . . . . . . . . . . . . . . . . . . . . . . . . . . . . . . . . . . . . . . .          15.8            —
               Total short-term debt. . . . . . . . . . . . . . . . . . . . . . . . . . . . . .                 15.8         600.0
         Long-term debt:
           Senior unsecured revolving credit facility . . . . . . . . . . . . . . . .                        1,000.0        1,000.0
           Senior unsecured term loan. . . . . . . . . . . . . . . . . . . . . . . . . . .                   1,000.0        1,000.0
           7.25% senior notes due 2013, net of unamortized discount. . . .                                     498.2          497.8
           6.125% senior notes due 2013, net of unamortized discount . . .                                     298.8          298.5
           7.125% senior notes due 2018, net of unamortized discount . . .                                   1,189.1        1,188.2
           Fair value of interest rate swap agreements . . . . . . . . . . . . . . .                            14.0           18.4
               Total long-term debt . . . . . . . . . . . . . . . . . . . . . . . . . . . . . .              4,000.1        4,002.9
         Total debt . . . . . . . . . . . . . . . . . . . . . . . . . . . . . . . . . . . . . . . . .    $   4,015.9    $   4,602.9

      6.125% and 7.125% Senior Notes. On March 18, 2008, the Company completed an underwritten public
offering of $300 million aggregate principal amount of 5-year senior notes at a price to the public of 99.425 percent
of par value, and $1.2 billion aggregate principal amount of 10-year senior notes at a price to the public of
98.956 percent. The 5-year senior notes bear interest at a rate of 6.125% per annum, with an effective interest rate
of 6.261%, and mature on March 15, 2013. The 10-year senior notes bear interest at a rate of 7.125% per annum,
with an effective interest rate of 7.274%, and mature on March 15, 2018. Medco may redeem all or part of these
notes at any time or from time to time at its option at a redemption price equal to the greater of (i) 100% of the
principal amount of the notes being redeemed plus accrued and unpaid interest to the redemption date or (ii) a
“make-whole” amount based on the yield of a comparable U.S. Treasury security plus 50 basis points. The Company
pays interest on both series of senior notes semi-annually on March 15 and September 15 of each year. The
Company used the net proceeds from the sale of these senior notes to repay borrowings under its revolving credit
facility used to fund the acquisitions in 2007, which are described in Note 3, “Acquisitions of Businesses.”
     On December 12, 2007, the Company entered into forward-starting interest rate swap agreements in contempla-
tion of the issuance of long-term fixed-rate financing described above. The Company entered into these cash flow
hedges to manage the Company’s exposure to changes in benchmark interest rates and to mitigate the impact of
fluctuations in the interest rates prior to the issuance of the long-term financing. The cash flow hedges entered into
were for a notional amount of $500 million on the then-current 10-year treasury interest rate, and for a notional
amount of $250 million on the then-current 30-year treasury interest rate, both with a settlement date of March 31,
2008. At the time of purchase, the cash flow hedges were anticipated to be effective in offsetting the changes in the
expected future interest rate payments on the proposed debt offering attributable to fluctuations in the treasury
benchmark interest rate.


                                                                            90
In connection with the issuance of the 5-year and 10-year senior notes described above, a portion of the
$250 million notional amount 30-year treasury interest rate cash flow hedge was deemed an ineffective hedge. The
cash flow hedges were settled on March 17, 2008 for approximately $45.4 million and included the ineffective
portion that was recorded as an increase of $9.8 million to interest (income) and other (income) expense, net, for the
year ended December 27, 2008. The effective portion was recorded in accumulated other comprehensive income and
is reclassified to interest expense over the ten-year period in which the Company hedged its exposure to variability
in future cash flows. The effective portion reclassified to interest expense in 2009 and 2008 amounted to $3.6 million
and $2.8 million, respectively. The effective portion expected to be reclassified to interest expense in 2010 amounts
to $3.6 million. The unamortized effective portion reflected in accumulated other comprehensive loss as of
December 26, 2009 and December 27, 2008 was $18.1 million and $20.0 million, net of tax, respectively.
     7.25% Senior Notes. In August 2003, in connection with Medco’s spin-off, the Company completed an
underwritten public offering of $500 million aggregate principal amount of 10-year senior notes at a price to the
public of 99.195 percent of par value. The senior notes bear interest at a rate of 7.25% per annum, with an effective
interest rate of 7.365%, and mature on August 15, 2013. Medco may redeem all or part of these notes at any time or
from time to time at its option at a redemption price equal to the greater of (i) 100% of the principal amount of the
notes being redeemed, or (ii) the sum of the present values of 107.25% of the principal amount of the notes being
redeemed, plus all scheduled payments of interest on the notes discounted to the redemption date at a semi-annual
equivalent yield to a comparable treasury issue for such redemption date plus 50 basis points.
      The Company entered into five interest rate swap agreements in 2004. These swap agreements, in effect,
converted $200 million of the $500 million of 7.25% senior notes to variable interest rates. The swaps have been
designated as fair value hedges and have an expiration date of August 15, 2013, consistent with the maturity date of
the senior notes. The fair value of the derivatives outstanding, which is based upon observable market-based inputs
that reflect the present values of the difference between estimated future fixed rate payments and future variable rate
receipts, represented net receivables of $14.0 million and $18.4 million as of December 26, 2009 and December 27,
2008, respectively, which are reported in other noncurrent assets, with offsetting amounts recorded in long-term
debt, net, on the Company’s consolidated balance sheets. These are the amounts that the Company would have
received from third parties if the derivative contracts had been settled. Under the terms of these swap agreements,
the Company receives a fixed rate of interest of 7.25% on $200 million and pays variable interest rates based on the
six-month London Interbank Offered Rate (“LIBOR”) plus a weighted average spread of 3.05%. The payment dates
under the agreements coincide with the interest payment dates on the hedged debt instruments and the difference
between the amounts paid and received is included in interest expense. Interest expense was reduced by $5.1 million
and $1.5 million in fiscal years 2009 and 2008, respectively, and was increased by $2.6 million for fiscal year 2007
as a result of the swap agreements. The weighted average LIBOR associated with the swap agreements was 1.6%,
3.3% and 5.4% for fiscal years 2009, 2008, and 2007, respectively.
     Five-Year Credit Facilities. On April 30, 2007, the Company entered into a senior unsecured credit agreement,
which is available for general working capital requirements. The facility consists of a $1 billion, 5-year senior
unsecured term loan and a $2 billion, 5-year senior unsecured revolving credit facility. The term loan matures on
April 30, 2012, at which time the entire facility is required to be repaid. If there are pre-payments on the term loan
prior to the maturity date, that portion of the loan would be extinguished. At the Company’s current debt ratings, the
credit facilities bear interest at LIBOR plus a 0.45 percent margin, with a 10 basis point commitment fee due on the
unused portion of the revolving credit facility.
     The outstanding balance under the revolving credit facility was $1.0 billion as of December 26, 2009 and
December 27, 2008. There was no activity under the revolving credit facility during 2009. As of December 26,
2009, the Company had $993 million available for borrowing under its revolving credit facility, after giving effect to
prior net draw-downs of $1 billion and $7 million in issued letters of credit.
      During 2008, the Company’s net borrowings under the revolving credit facility decreased by approximately
$400 million, consisting of repayments of $2.2 billion and draw-downs of $1.8 billion. As a result of this activity,
the revolving credit facility’s outstanding balance decreased from $1.4 billion at fiscal year-end 2007 to $1.0 billion
as of December 27, 2008. As of December 27, 2008, the Company had $987 million available for borrowing under
its revolving credit facility, after giving effect to prior net draw-downs of $1 billion and $13 million in issued letters
of credit. The revolving credit facility is available through April 30, 2012.


                                                            91
Accounts Receivable Financing Facility and Other Short-Term Debt. Through a wholly-owned subsidiary, the
Company has a $600 million, 364-day renewable accounts receivable financing facility that is collateralized by the
Company’s pharmaceutical manufacturer rebates accounts receivable. During 2009, the Company repaid the entire
$600 million outstanding balance, which resulted in no amounts outstanding and $600 million available for
borrowing under the facility at December 26, 2009. At December 27, 2008, there was $600 million outstanding with
no additional amounts available for borrowing under the facility. The Company pays interest on amounts borrowed
under the agreement based on the funding rates of the bank-related commercial paper programs that provide the
financing, plus an applicable margin and liquidity fee determined by the Company’s credit rating. The weighted
average annual interest rate on amounts outstanding under the facility at December 27, 2008 was 3.10%. This
facility is renewable annually at the option of both Medco and the banks and was renewed on July 27, 2009.
Amounts outstanding under the accounts receivable financing facility are classified as short-term debt on the
Company’s consolidated balance sheet. Additionally, the Company has short-term debt of $15.8 million outstanding
as of December 26, 2009 under an $18.7 million short-term revolving credit facility. The weighted average annual
interest rate on amounts outstanding under the short-term revolving credit facility at December 26, 2009 was 1.58%.
      Covenants. All of the senior notes discussed above are subject to customary affirmative and negative covenants,
including limitations on sale/leaseback transactions; limitations on liens; limitations on mergers and similar
transactions; and a covenant with respect to certain change of control triggering events. The 6.125% senior notes
and the 7.125% senior notes are also subject to an interest rate adjustment in the event of a downgrade in the ratings
to below investment grade. In addition, the senior unsecured credit facilities and the accounts receivable financing
facility are subject to covenants, including, among other items, maximum leverage ratios. The Company was in
compliance with all covenants at December 26, 2009 and December 27, 2008.
     Aggregate Maturities and Interest Expense. The aggregate maturities of long-term debt are as follows ($ in
millions):
          Fiscal Years Ending December
          2010    to 2011 . . . .    .................................................                                                   $         —
          2012    ..........         .................................................                                                         2,000.0
          2013    ..........         .................................................                                                           800.0
          2014    to 2017 . . . .    .................................................                                                             —
          2018    ..........         .................................................                                                         1,200.0
          Total . . . . . . . . . . . . . . . . . . . . . . . . . . . . . . . . . . . . . . . . . . . . . . . . . . . . . . . . . . .    $     4,000.0

    Interest expense on total debt was $172.5 million in 2009, $233.7 million in 2008 and $134.2 million in 2007.

9. PENSION AND OTHER POSTRETIREMENT BENEFITS
    Net Pension and Postretirement Benefit Cost. The Company has various plans covering the majority of its
employees. The net cost for the Company’s pension plans consisted of the following components ($ in millions):
    Fiscal Years                                                                                                    2009                2008           2007
    Service cost . . . . . . . . . . . . . . . . . . . . . . . .    ...................... $                           24.3        $     24.6      $    18.0
    Interest cost . . . . . . . . . . . . . . . . . . . . . . . .   ......................                             13.2               9.6            7.9
    Expected return on plan assets . . . . . . . . . .              ......................                             (9.9)            (13.0)         (11.0)
    Amortization of prior service cost . . . . . . . .              ......................                              0.2               0.3             —
    Net amortization of actuarial losses. . . . . . .               ......................                              5.4               —               —
    Net pension cost. . . . . . . . . . . . . . . . . . . . . . . . . . . . . . . . . . . . . . . . . . . $            33.2        $     21.5      $     14.9

     The increase in the net pension cost for fiscal year 2009 compared to fiscal year 2008 primarily resulted from
lower than expected return on plan assets during 2008. The increase in the net pension cost for fiscal year 2008
compared to fiscal year 2007 is primarily due to additional employees participating in the cash balance retirement
plan, as well as a plan amendment from graduated seven-year vesting to three-year cliff vesting, which became
effective January 1, 2008.


                                                                               92
The Company maintains an unfunded postretirement healthcare benefit plan covering the majority of its
employees. The net credit for these postretirement benefits consisted of the following components ($ in millions):
      Fiscal Years                                                                                                      2009            2008                2007
      Service cost . . . . . . . . . . . . . . . . . . . . . . . . . . . . . . . . . . . . . . . . . . . . . . .    $     1.2       $        1.0        $     0.9
      Interest cost . . . . . . . . . . . . . . . . . . . . . . . . . . . . . . . . . . . . . . . . . . . . . . .         0.8                0.8              0.7
      Amortization of prior service credit . . . . . . . . . . . . . . . . . . . . . . . . . . . . .                     (4.2)              (4.2)            (4.3)
      Net amortization of actuarial losses . . . . . . . . . . . . . . . . . . . . . . . . . . . . .                      0.5                0.5              0.6
      Net postretirement benefit credit . . . . . . . . . . . . . . . . . . . . . . . . . . . . . . . .             $ (1.7)         $       (1.9)       $ (2.1)

     The Company amended the postretirement healthcare benefit plan in 2003, which reduced and capped benefit
obligations, the effect of which is reflected in the amortization of the prior service credit component of the net
postretirement benefit credit.
     Changes in Plan Assets, Benefit Obligation and Funded Status. Summarized information about the funded
status and the changes in plan assets and benefit obligation is as follows ($ in millions):
                                                                                                                                         Other Postretirement
                                                                                                       Pension Benefits                        Benefits
Fiscal Years                                                                                          2009        2008                    2009          2008
Fair value of plan assets at beginning of year . . . . . . . . . . . . . . . . . $                      119.2       $     152.0         $         —          $         —
Actual return on plan assets . . . . . . . . . . . . . . . . . . . . . . . . . . . . . .                 23.2             (44.9)                  —                    —
Company contributions . . . . . . . . . . . . . . . . . . . . . . . . . . . . . . . . .                  11.5              17.2                  0.7                  1.0
Employee contributions . . . . . . . . . . . . . . . . . . . . . . . . . . . . . . . . .                  —                  —                   0.4                  0.8
Benefits paid . . . . . . . . . . . . . . . . . . . . . . . . . . . . . . . . . . . . . . . . .          (6.3)             (5.1)                (1.1)                (1.8)
Fair value of plan assets at end of year. . . . . . . . . . . . . . . . . . . . . . $                   147.6       $     119.2         $           —        $        —
                                                      (1)
Benefit obligation at beginning of year . . .                    ................. $                    192.9       $     161.0         $      14.1          $     12.7
Service cost. . . . . . . . . . . . . . . . . . . . . . . . .    .................                       24.3              24.6                 1.2                 1.1
Interest cost. . . . . . . . . . . . . . . . . . . . . . . . .   .................                       13.2               9.6                 0.8                 0.7
Employee contributions . . . . . . . . . . . . . . . .           .................                        —                  —                  0.4                 0.8
Amendments . . . . . . . . . . . . . . . . . . . . . . . .       .................                        —                  —                   —                  1.0
Actuarial (gains) losses . . . . . . . . . . . . . . . .         .................                       (9.5)              2.8                 0.2                (0.4)
Benefits paid . . . . . . . . . . . . . . . . . . . . . . . .    .................                       (6.4)             (5.1)               (1.1)               (1.8)
Benefit obligation at end of year(1) . . . . . . . . . . . . . . . . . . . . . . . . . $                214.5       $     192.9         $      15.6          $     14.1
Underfunded status at end of year . . . . . . . . . . . . . . . . . . . . . . . . . $                    (66.9)     $      (73.7)       $ (15.6)             $     (14.1)
(1)
      Represents the projected benefit obligation for pension benefits and the accumulated postretirement benefit obli-
      gation for other postretirement benefits.
    The pension and other postretirement benefits liabilities recognized at December 26, 2009 and December 27,
2008 are as follows ($ in millions):
                                                                                                                                         Other Postretirement
                                                                                                        Pension Benefits                       Benefits
                                                                                                       2009        2008                   2009          2008
Accrued expenses and other current liabilities . . . . . . . . . . . . . . . . . $                        (0.1)      $        —         $       (0.7)        $      (0.9)
Other noncurrent liabilities . . . . . . . . . . . . . . . . . . . . . . . . . . . . . . .               (66.8)            (73.7)              (14.9)              (13.2)
Total pension and other postretirement liabilities . . . . . . . . . . . . . . . $                       (66.9)      $ (73.7)           $ (15.6)             $     (14.1)

     The accumulated benefit obligation for defined benefit pension plans was $172.6 million and $180.0 million at
December 26, 2009 and December 27, 2008, respectively, and the projected benefit obligation for defined benefit
pension plans was $214.5 million and $192.9 million at December 26, 2009 and December 27, 2008, respectively.
The projected benefit obligation amounts are higher because they include projected future salary increases through
expected retirement.


                                                                                93
Net actuarial gains and losses reflect experience differentials relating to differences between expected and
actual returns on plan assets, differences between expected and actual demographic changes, differences between
expected and actual healthcare cost increases, and the effects of changes in actuarial assumptions. The fair value of
the Company’s pension plan assets increased from $119.2 million at the end of 2008 to $147.6 million at the end of
2009 primarily resulting from investment gains. The investment gains were partially offset by increased benefit
obligations related to the 2009 benefit accrual and resulted in a decrease in the pension plans’ unfunded status from
$73.7 million at fiscal year-end 2008 to $66.9 million at fiscal year-end 2009 and a decrease of $28.5 million pre-
tax, reflected in comprehensive income in stockholders’ equity. This decrease in unfunded status did not have an
impact on the consolidated statement of income for 2009. The increase in the net pension cost for fiscal year 2009
compared to fiscal year 2008 resulted from lower than expected return on plan assets in 2008, reflected in the
increased amortization of actuarial losses and the decrease in the expected return on assets. Net actuarial gains and
losses, in excess of certain thresholds, are amortized into the consolidated statement of income over the 12-year
average remaining service life of participants. The Company estimates the 2010 net periodic benefit cost for its
pension plans to be included in its consolidated statement of income will be approximately $30 million.
     The net gain or loss and net prior service cost or credit recognized in other comprehensive income and
reclassification adjustments for the periods presented, pre-tax, are as follows ($ in millions):
                                                                                                                      Other Postretirement
                                                                                            Pension Benefits                Benefits
             Balances at December 29, 2007, pre-tax. . . . . . . . . . . .                         $     15.3               $ (33.7)
             Loss (gain) arising during period . . . . . . . . . . . . . . . . .                         60.7                  (0.4)
             Amortization of actuarial loss included in net periodic
               benefit cost . . . . . . . . . . . . . . . . . . . . . . . . . . . . . . .                  —                    (0.5)
             Prior service cost (credit). . . . . . . . . . . . . . . . . . . . . . .                       —                    1.0
             Amortization of prior service (cost) credit . . . . . . . . . .                              (0.2)                  4.2
             Balances at December 27, 2008, pre-tax. . . . . . . . . . . .                         $     75.8               $ (29.4)
             Loss (gain) arising during period . . . . . . . . . . . . . . . . .                        (22.9)                  0.2
             Amortization of actuarial loss included in net periodic
               benefit cost . . . . . . . . . . . . . . . . . . . . . . . . . . . . . . .                 (5.4)                 (0.5)
             Amortization of prior service (cost) credit . . . . . . . . . .                              (0.2)                  4.2
             Balances at December 26, 2009, pre-tax. . . . . . . . . . . .                         $     47.3               $ (25.5)

     The estimated actuarial loss and prior service cost for the Company’s pension plans that are expected to be
amortized from accumulated other comprehensive income into net pension cost in fiscal year 2010 is $2.0 million
($1.2 million after tax) and $0.2 million ($0.1 million after tax), respectively. The estimated net actuarial loss and
prior service credit for the Company’s other postretirement plans that are expected to be amortized from
accumulated other comprehensive income into net postretirement benefit credit in fiscal year 2010 are $0.5 million
($0.3 million after tax) and $(4.2) million ($(2.5) million after tax), respectively.
    See Note 2, “Summary of Significant Accounting Policies—Other Comprehensive Income and Accumulated
Other Comprehensive Income,” for more information.
     Actuarial Assumptions. Actuarial weighted average assumptions used in determining plan information are as
follows:
                                                                                                                                 Other Postretirement
                                                                                                          Pension Benefits             Benefits
                                                                                                       2009     2008     2007   2009    2008      2007

Weighted average assumptions used to determine benefit obligations
 at fiscal year-end:
 Discount rate . . . . . . . . . . . . . . . . . . . . . . . . . . . . . . . . . . . . . . . . .       5.70% 6.00% 6.00% 5.85% 6.00% 6.00%
 Salary growth rate . . . . . . . . . . . . . . . . . . . . . . . . . . . . . . . . . . . . .          4.50% 4.50% 4.50% —       —     —
Weighted average assumptions used to determine net cost for the
 fiscal year ended:
 Discount rate . . . . . . . . . . . . . . . . . . . . . . . . . . . . . . . . . . . . . . . . .       6.00% 6.00% 5.75% 6.00% 6.00% 5.75%
 Expected long-term rate of return on plan assets . . . . . . . . . . . . . . .                        8.25% 8.25% 8.00% —       —     —
 Salary growth rate . . . . . . . . . . . . . . . . . . . . . . . . . . . . . . . . . . . . .          4.50% 4.50% 4.50% —       —     —


                                                                             94
The expected rate of return for the pension plan represents the average rate of return to be earned on the plan
assets over the period the benefits included in the benefit obligation are to be paid. The expected return on plan
assets is determined by multiplying the expected long-term rate of return by the fair value of the plan assets and
contributions, offset by expected return on expected benefit payments. In developing the expected rate of return, the
Company considers long-term compounded annualized returns of historical market data, as well as historical actual
returns on our plan assets. Using this reference information, the Company develops forward-looking return
expectations for each asset category and a weighted average expected long-term rate of return for a targeted
portfolio allocated across these investment categories.
     Future costs of the amended postretirement benefit healthcare plan are being capped based on 2004 costs. As a
result, employer liability is not affected by healthcare cost trend.
     Pension Plan Assets. The Company believes the oversight of the investments held under its pension plans is
rigorous and the investment strategies are prudent. The investment objectives of the Company’s qualified pension
plan are designed to generate total asset returns both sufficient to meet its expected future benefit obligations, as
well as returns greater than its policy benchmark reflecting the target weights of the asset classes used in its strategic
asset allocation investment policy. The plan’s targeted strategic allocation to each asset class was determined through
an asset/liability modeling study. The currently adopted strategic asset allocation targets approximately 70 percent in
equity securities and 30 percent in fixed income and diversification within specific asset classes of these broad
categories. The Company believes that the portfolio’s equity weighting strategy is consistent with investment goals
and risk management practices applicable to the long-term nature of the plan’s benefit obligation. The precise
amount for which the benefit obligations will be settled depends on future events, including interest rates, salary
increases, and the life expectancy of the plan’s members. The obligations are estimated using actuarial assumptions,
based on the current economic environment.
     The following table sets forth the target allocation for 2010 by asset category and the plan assets at fair value
at the year-end 2009 reporting date by level within the fair value hierarchy ($ in millions):
                                                                          Percent of
                                                             Target      Plan Assets
                                                            Allocation   at Year-end
Asset Category                                                 2010          2009          Total    Level 1(1)   Level 2(1)   Level 3(1)
U.S. equity securities . . . . . . . . . . . . . .           50 – 60%          57%
   U.S. large-cap . . . . . . . . . . . . . . . . .                                    $     43.9   $    27.1    $ 16.8(2)     $   —
   U.S. small/mid-cap . . . . . . . . . . . . .                                              39.6        39.6        —             —
International equity securities . . . . . . . .              12 – 18%          13%           19.9        19.9        —             —
Fixed income . . . . . . . . . . . . . . . . . . .           27 – 33%          30%           44.2        23.5      20.7(3)         —
Total . . . . . . . . . . . . . . . . . . . . . . . . . .                   100%       $    147.6   $ 110.1      $ 37.5        $   —
 (1)
       See Note 4, “Fair Value Disclosures,” for a description of the fair value hierarchy.
 (2)
       Consists of a common collective trust that invests in common stock of S&P 500 companies.
 (3)
       Primarily consists of a common collective trust that invests in passive bond market index lending funds and a
       short-term investment fund.
      Assets classified as Level 1 are valued at the readily available quoted price from an active market where there
is significant transparency in the executed quoted price. Assets classified as Level 2 include units held in common
collective trust funds, which have no readily available quoted market price but whose unit values are reported by the
funds’ investment managers, and a short-term fixed income investment fund which is valued using other significant
observable inputs such as quoted prices for comparable securities.


                                                                          95
Cash Flows.
     Employer Contributions. The Company has a remaining minimum pension funding requirement of $16.3 million
under the Internal Revenue Code (“IRC”) during 2010 for our 2009 plan year.
     The Company expects to contribute an additional amount up to $14 million to its pension plans during fiscal
2010 above the aforementioned remaining minimum pension funding requirement. The expected contributions to the
pension plans during 2010 are estimated to reflect amounts necessary to satisfy the minimum funding requirements
or Medco’s discretion in bringing the plans to a higher funded status. The Company anticipates that contributions
will consist solely of cash.
    Estimated Future Benefit Payments. The following benefit payments, which reflect expected future service, as
appropriate, are expected to be paid ($ in millions):
                                                                                                                       Other
                                                                                                Pension            Postretirement
                        Fiscal Years                                                           Benefits(1)            Benefits
                        2010 . . . . . . .     .........................                       $      16.9               $    0.8
                        2011 . . . . . . .     .........................                       $      18.5               $    0.6
                        2012 . . . . . . .     .........................                       $      19.7               $    0.6
                        2013 . . . . . . .     .........................                       $      21.2               $    0.6
                        2014 . . . . . . .     .........................                       $      26.8               $    0.7
                        2015-2019 . . .        .........................                       $     134.3               $    6.1
(1)
      The estimated future benefit payments increased from the amounts disclosed in the Company’s Annual Report on
      Form 10-K for the fiscal year ended December 27, 2008 primarily due to new employees participating in the
      cash balance retirement plan.

  Other Plans.
    The Company sponsors defined contribution retirement plans for all eligible employees, as defined in the plan
documents. These plans are qualified under Section 401(k) of the IRC. Contributions to the plans are based on
employee contributions and a Company matching contribution. The Company’s matching contributions to the plans
were $37.6 million in 2009, $34.8 million in 2008 and $28.6 million in 2007.

10. TAXES ON INCOME
    Provision for Income Taxes. The components of the provision for income taxes are as follows ($ in millions):
           Fiscal Years                                                                             2009                 2008             2007
           Current provision:
             Federal . . . . . . . . . . . . . . . . . . . . . . . . . . . . . . . . . . .     $          844.9     $        664.1    $    594.7
             State . . . . . . . . . . . . . . . . . . . . . . . . . . . . . . . . . . . . .              170.1              102.3         122.6
             Foreign . . . . . . . . . . . . . . . . . . . . . . . . . . . . . . . . . . .                 (2.6)              (1.2)          —
                 Total . . . . . . . . . . . . . . . . . . . . . . . . . . . . . . . . . . .         1,012.4                 765.2         717.3
           Deferred provision (benefit):
             Federal . . . . . . . . . . . . . . . . . . . . . . . . . . . . . . . . . . .            (145.9)                (63.8)       (114.0)
             State . . . . . . . . . . . . . . . . . . . . . . . . . . . . . . . . . . . . .           (42.3)                (13.5)        (12.0)
             Foreign . . . . . . . . . . . . . . . . . . . . . . . . . . . . . . . . . . .              (1.2)                  —             —
                 Total . . . . . . . . . . . . . . . . . . . . . . . . . . . . . . . . . . .          (189.4)                (77.3)       (126.0)
           Total provision for income taxes. . . . . . . . . . . . . . . . . . .               $          823.0     $        687.9    $    591.3

      A reconciliation of the Company’s effective tax rate and the U.S. statutory rate is as follows:
                        Fiscal Years                                                               2009        2008            2007
                        U.S. statutory rate applied to pretax income . . .                          35.0%          35.0%         35.0%
                        Differential arising from:
                          State taxes . . . . . . . . . . . . . . . . . . . . . . . . . .            3.9           3.2            4.8
                          Other . . . . . . . . . . . . . . . . . . . . . . . . . . . . . .          0.2           0.2           (0.5)
                        Effective tax rate . . . . . . . . . . . . . . . . . . . . . . .            39.1%          38.4%         39.3%


                                                                              96
The Company’s 2009 effective tax rate reflects a fourth-quarter 2009 income tax benefit of $22 million,
primarily reflecting state-related tax items. The Company’s 2008 effective tax rate reflects a net state income tax
benefit of $28 million recorded in the third quarter of 2008 resulting primarily from statute of limitations expirations
in certain states, partially offset by state tax law changes.
     The Company may achieve additional state income tax savings in future quarters. To the extent that these state
tax savings are realized, they will be recorded as a reduction to the provision for income taxes at the time the audit
by the respective state taxing jurisdiction is complete or when the applicable statute of limitations has expired.
       Deferred Income Taxes. Deferred income taxes at year-end consisted of ($ in millions):
                                                                                                   December 26, 2009           December 27, 2008
                                                                                                  Assets    Liabilities       Assets    Liabilities
Intangible assets . . . . . . . . . . . . . . . . . . . . . . . . . . . . . . . . . . .       $       —     $     865.1   $        —    $     991.6
Accelerated depreciation . . . . . . . . . . . . . . . . . . . . . . . . . . . . .                    —           199.0            —          173.9
Accrued expenses . . . . . . . . . . . . . . . . . . . . . . . . . . . . . . . . . .                55.6            —            63.7            —
Accrued rebates . . . . . . . . . . . . . . . . . . . . . . . . . . . . . . . . . . .              101.3            —            57.9            —
Stock-based compensation . . . . . . . . . . . . . . . . . . . . . . . . . . . .                   123.4            —            99.1            —
Other . . . . . . . . . . . . . . . . . . . . . . . . . . . . . . . . . . . . . . . . . . .         92.6           36.8          85.3          46.6
Total deferred taxes. . . . . . . . . . . . . . . . . . . . . . . . . . . . . . . . .         $    372.9    $   1,100.9   $    306.0    $ 1,212.1
Net deferred income taxes . . . . . . . . . . . . . . . . . . . . . . . . . . . .                           $     728.0                 $     906.1
Recognized as:
  Current deferred tax asset . . . . . . . . . . . . . . . . . . . . . . . . . .              $    230.8                  $    159.2
  Noncurrent deferred tax liability . . . . . . . . . . . . . . . . . . . . .                               $     958.8                 $ 1,065.3
     Other. Income taxes payable of $5.4 million and $34.8 million as of December 26, 2009 and December 27,
2008, respectively, are reflected in accrued expenses and other current liabilities on the audited consolidated balance
sheets. Liabilities for income tax contingencies are primarily included in other noncurrent liabilities on the
consolidated balance sheets.
     In the third quarter of 2006, the IRS commenced a routine examination of the Company’s U.S. income tax
returns for the period subsequent to the spin-off, from August 20, 2003 through December 31, 2005, which was
completed in December 2009. In the fourth quarter of 2008, the IRS commenced a routine examination of the
Company’s 2006 and 2007 U.S. income tax returns, which is anticipated to be completed in 2010. The Company
has agreed to extend the statute of limitations for the 2003 tax period and the 2004 and 2005 tax years to
September 15, 2010. The IRS proposed and the Company had previously recorded certain adjustments to the
Company’s 2003 to 2005 tax returns, which did not have a material impact on the consolidated financial statements.
The Company is also undergoing various routine examinations by state and local tax authorities for various filing
periods.
     During the third quarter of 2006, the Company recorded income taxes receivable associated with the IRS
approval of an accounting method change for the timing of the deductibility of certain rebates passed back to clients.
The income taxes receivable balance including interest was $198.3 million at December 26, 2009, of which
$171.9 million represented a receivable from the IRS that was collected in February 2010. The Company expects to
collect the remaining income taxes receivable representing the amounts due from various states plus interest in
2010. The income taxes receivable balance including interest was $213.4 million at December 27, 2008. The income
tax receivable decreased as a result of the IRS examination where the Company and the IRS agreed that a portion of
the deduction for such rebates would be deferred.


                                                                                  97
Liabilities for Income Tax Contingencies. The Company’s total gross liabilities for income tax contingencies
as of December 26, 2009 amounted to $99.9 million, remain subject to audit, and may be released on audit closure
or as a result of the expiration of statutes of limitations. A reconciliation of the beginning and ending gross liabilities
for income tax contingencies is as follows ($ in millions):
     Fiscal Years                                                                                            2009            2008        2007
     Liabilities, beginning of year . . . . . . . . . . . . . . . . . . . .           . . . . . . . . . . . . $ 78.3     $ 104.5     $     89.8
     Gross increases, acquisition effects . . . . . . . . . . . . . . . .             ............                 —          —             3.0
     Gross increases, prior period tax positions . . . . . . . . . . .                ............               35.6       17.2           11.5
     Gross decreases, prior period tax positions . . . . . . . . . .                  ............               (8.4)      (7.1)          (5.6)
     Gross increases, current period tax positions . . . . . . . . .                  ............               18.7        0.9           16.5
     Settlements. . . . . . . . . . . . . . . . . . . . . . . . . . . . . . . . . .   ............              (14.6)      (0.1)          (3.2)
     Lapse of statutes of limitations . . . . . . . . . . . . . . . . . . .           ............               (9.7)     (37.1)          (7.5)
     Liabilities, end of year . . . . . . . . . . . . . . . . . . . . . . . . . . . . . . . . . . . . . $      99.9      $    78.3   $    104.5

      For the year ended December 26, 2009, there was a net increase of $21.6 million in the total gross liabilities
for income tax contingencies primarily associated with current period tax positions. For the year ended December 27,
2008, there was a net decrease of $26.2 million in the total gross liabilities for income tax contingencies primarily
due to statute of limitations expirations in certain states. As of December 26, 2009, if the Company’s liabilities for
income tax contingencies were reversed into income from expense, income tax expense would be reduced by
$52.8 million, net of federal income tax expense. The majority of the income tax contingencies are subject to
statutes of limitations that are scheduled to expire by the end of 2014. In addition, approximately 30% of the income
tax contingencies are anticipated to settle over the next twelve months.
     The Company recognizes interest related to liabilities for income tax contingencies in the provision for income
taxes for which the Company had approximately $10.8 million and $14.2 million accrued at December 26, 2009 and
December 27, 2008, respectively. Total (income) expense, net, recognized for interest related to liabilities for income
tax contingencies was $(3.4) million for both 2009 and 2008 and $4.6 million for 2007. The Company’s policy for
penalties related to liabilities for income tax contingencies is to recognize such penalties in the provision for income
taxes. The Company has had no significant penalties for liabilities for income tax contingencies.

11. STOCK-BASED COMPENSATION
     Overview. The Compensation Committee of the Company’s Board of Directors regularly reviews the
Company’s compensation structure and practices, including the timing of its stock-based awards. The Audit
Committee of the Company’s Board of Directors also reviews the Company’s option-granting practices from time to
time. The Company grants options to employees and directors to purchase shares of Medco common stock at the
fair market value on the date of grant. The options generally vest over three years (director options vest in one year)
and expire within 10 years from the date of the grant. Vested options held by employees may expire earlier
following termination of employment. The post-termination exercise period varies from 90 days for a voluntary
termination to the full remaining term for termination of employment following a change in control. Directors
always have the full term to exercise vested options. All option exercises are subject to restrictions on insider
trading, and directors, officers and certain other employees with regular access to material information are subject to
quarterly restrictions on trading. Under the terms of the Medco Health Solutions, Inc. 2002 Stock Incentive Plan, as
of December 26, 2009, 18.2 million shares of the Company’s common stock are available for awards. As of
December 26, 2009, under the terms of the Accredo Health, Incorporated 2002 Long-Term Incentive Plan as
amended and restated on August 18, 2005, there are 0.5 million shares of the Company’s common stock available
for awards.


                                                                             98
The fair value of options granted is estimated on the date of grant using the Black-Scholes option-pricing
model. The Medco volatility assumption is based on the Company’s stock price volatility, and for the initial years as
a publicly traded company was blended with a PBM industry volatility average. The Company uses historical data
to estimate the expected option life. The expected option life represents the period of time that options granted are
expected to be outstanding. Groups of employees that have similar historical exercise behavior are considered
separately for valuation purposes. The risk-free rate is based on the U.S. Treasury yield curve in effect at the time of
grant. The weighted average fair value of options granted for fiscal years 2009, 2008 and 2007 was $11.40, $14.60
and $11.86, respectively. The weighted average assumptions utilized for options granted during the periods presented
are as follows:
      Fiscal Years                                                                                                       2009     2008       2007

      Medco stock options Black-Scholes assumptions (weighted average):
         Expected dividend yield. . . . . . . . . . . . . . . . . . . . . . . . . . . . . . . . . . . . . . . . . .       —    —     —
         Risk-free interest rate . . . . . . . . . . . . . . . . . . . . . . . . . . . . . . . . . . . . . . . . . . . 2.0% 2.8% 4.7%
         Expected volatility. . . . . . . . . . . . . . . . . . . . . . . . . . . . . . . . . . . . . . . . . . . . . . 27.0% 27.0% 29.0%
         Expected life (years) . . . . . . . . . . . . . . . . . . . . . . . . . . . . . . . . . . . . . . . . . . . . 5.0     5.0   5.0

     Stock Option Plans. Summarized information related to stock options held by the Company’s employees and
directors is as follows:
                                                                                                                            Weighted
                                                                                                                            Average        Aggregate
                                                                                         Number of        Weighted         Remaining        Intrinsic
                                                                                           Shares         Average          Contractual        Value
                                                                                       (in thousands)   Exercise Price       Term         (in millions)

Outstanding at December 27, 2008 . . . . . . . . . . . . . . . . . .                     27,387.3          $29.55
Granted . . . . . . . . . . . . . . . . . . . . . . . . . . . . . . . . . . . . . .       6,578.0           41.66
Exercised . . . . . . . . . . . . . . . . . . . . . . . . . . . . . . . . . . . . .      (7,027.0)          23.09
Forfeited. . . . . . . . . . . . . . . . . . . . . . . . . . . . . . . . . . . . . .       (620.5)          36.23
Outstanding at December 26, 2009 . . . . . . . . . . . . . . . . . .                    26,317.8           $34.14             6.77           $787.2
Exercisable at December 26, 2009 . . . . . . . . . . . . . . . . . . .                  14,306.7           $27.23             5.53           $526.7

     The total intrinsic value of options exercised during fiscal years 2009, 2008 and 2007 was $202.6 million,
$89.0 million and $254.7 million, respectively.
     Net income, as reported, includes stock-based compensation expense related to stock options for fiscal years
2009, 2008 and 2007 of $45.3 million ($74.8 million pre-tax), $39.8 million ($65.7 million pre-tax) and $29.3 million
($48.2 million pre-tax), respectively. As of December 26, 2009, there was $74.1 million of total unrecognized
compensation cost related to outstanding stock options. That cost is expected to be recognized over a weighted
average period of 1.8 years. The total fair value of shares vested during fiscal years 2009, 2008 and 2007 was
$70.0 million, $65.7 million and $69.1 million, respectively. The Company expects the majority of outstanding non-
vested options to vest. The activity related to non-vested options is as follows:
                                                                                                                                 Weighted
                                                                                                               Number of         Average
                                                                                                                 Shares         Grant-Date
                                                                                                             (in thousands)     Fair Value

             Non-vested at December 27, 2008.                   ..........................                     11,820.5          $12.55
             Granted . . . . . . . . . . . . . . . . . . . .    ..........................                      6,578.0           12.07
             Vested . . . . . . . . . . . . . . . . . . . . .   ..........................                     (6,056.2)          11.56
             Forfeited . . . . . . . . . . . . . . . . . . .    ..........................                       (331.2)          17.01
             Non-vested at December 26, 2009. . . . . . . . . . . . . . . . . . . . . . . . . . .              12,011.1          $12.66

     Restricted Stock Units. The Company grants restricted stock units to employees and directors. Restricted stock
units generally vest after three years (director restricted stock units vest in one year). The fair value of restricted
stock units granted is determined by the product of the number of shares granted and the grant-date market price of
the Company’s common stock. The fair value of the restricted stock units is expensed on a straight-line basis over
the requisite service period. Net income, as reported, includes stock-based compensation expense related to restricted
stock units for fiscal years 2009, 2008 and 2007 of $41.2 million ($68.1 million pre-tax), $38.3 million ($63.1 mil-
lion pre-tax) and $31.8 million ($52.2 million pre-tax), respectively.

                                                                                 99
Upon vesting, certain employees and directors may defer conversion of the restricted stock units to common
stock. Restricted stock units granted to directors are required to be deferred until their service on the Board of
Directors ends. Summarized information related to restricted stock units held by the Company’s employees and
directors is as follows:
                                                                                                                         Aggregate
                                                                                                         Number of        Intrinsic
                                                                                                           Shares           Value
              Restricted Stock Units                                                                   (in thousands)   (in millions)

              Outstanding at December 27, 2008 . . . . . . . . . . . . . . . . . .                        5,849.0
              Granted . . . . . . . . . . . . . . . . . . . . . . . . . . . . . . . . . . . . . .         1,753.1
              Converted . . . . . . . . . . . . . . . . . . . . . . . . . . . . . . . . . . . . .        (1,641.8)
              Forfeited . . . . . . . . . . . . . . . . . . . . . . . . . . . . . . . . . . . . . .        (178.9)
              Outstanding at December 26, 2009 . . . . . . . . . . . . . . . . . .                        5,781.4         $370.3

              Vested and deferred at December 26, 2009. . . . . . . . . . . . .                             730.4         $ 46.8

     The weighted average grant-date fair value of restricted stock units granted during fiscal years 2009, 2008 and
2007 was $40.71, $50.15 and $36.01, respectively. The total intrinsic value of restricted stock units converted during
fiscal years 2009, 2008 and 2007 was $66.9 million, $86.8 million and $6.2 million, respectively. The increase in
the restricted stock unit converted figures for 2008 compared with 2007 reflects restricted stock units becoming a
larger component of total employee stock compensation beginning in fiscal 2005; those grants vested and converted
in 2008.
     Summarized information related to non-vested restricted stock units held by the Company’s employees and
directors is as follows:
                                                                                                                         Weighted
                                                                                                         Number of       Average
                                                                                                           Shares       Grant-Date
              Non-vested Restricted Stock Units                                                        (in thousands)   Fair Value

              Non-vested at December 27, 2008 . . . . . . . . . . . . . . . . . . .                       5,190.5         $37.32
              Granted . . . . . . . . . . . . . . . . . . . . . . . . . . . . . . . . . . . . . . .       1,753.1          40.71
              Vested . . . . . . . . . . . . . . . . . . . . . . . . . . . . . . . . . . . . . . . .     (1,713.7)         29.60
              Forfeited . . . . . . . . . . . . . . . . . . . . . . . . . . . . . . . . . . . . . .        (178.9)         40.78
              Non-vested at December 26, 2009 . . . . . . . . . . . . . . . . . . .                       5,051.0         $41.21

      As of December 26, 2009, there was $82.5 million of total unrecognized compensation cost related to non-
vested restricted stock units. That cost is expected to be recognized over a weighted average period of 1.7 years.
The total grant-date fair value of restricted stock units vested during fiscal years 2009, 2008 and 2007 was
$50.7 million, $50.2 million and $2.8 million, respectively. The Company expects the majority of non-vested
restricted stock units to vest.
      Employee Stock Purchase Plan. The Company’s Board of Directors adopted the 2007 Employee Stock
Purchase Plan (“2007 ESPP”) on January 24, 2007 and the Company’s shareholders approved the 2007 ESPP on
May 24, 2007. Under the terms of the 2007 ESPP, 6,000,000 shares of the Company’s common stock are available
for issuance, and eligible employees may have up to 10% of gross pay deducted from their payroll up to a
maximum of $15,000 of fair market value per year to purchase shares of Medco common stock. The Company
matches payroll deductions at the rate of 17.65% and the deductions and contributions accumulate; on the last day
of trading each calendar quarter the accumulated amounts are applied to the purchase of Medco stock. The effect of
the matching contribution is that employees pay 85% of the cost of shares under the ESPP. The 2007 ESPP became
effective on July 1, 2007 and will expire the earlier of June 30, 2017 or the date as of which the maximum number
of shares has been purchased.
    Purchases of Medco stock under the 2007 ESPP were 460,724 shares at a weighted average price of $45.05 in
2009, and 400,251 shares at a weighted average price of $46.73 in 2008.
     Net income, as reported, includes stock-based compensation expense related to the ESPP for fiscal years 2009,
2008 and 2007 of $1.9 million ($3.1 million pre-tax), $1.8 million ($2.9 million pre-tax) and $1.3 million
($2.1 million pre-tax), respectively.


                                                                          100
The above share data has been retrospectively adjusted to reflect the January 24, 2008 two-for-one stock split.
See Note 1, “Background and Basis of Presentation,” for more information.

12. SHARE REPURCHASE PROGRAMS
     Since 2005, the Company has executed share repurchases of 186.3 million shares at a cost of $6.9 billion
through its share repurchase programs. The Company is currently authorized to repurchase its shares under a
$3 billion share repurchase program (the “2008 Program”), which was announced in November 2008 and expires in
November 2010, with $1.6 billion remaining under its current authorization as of December 26, 2009. During fiscal
year 2009 under the 2008 Program, the Company repurchased 27.3 million shares at a total cost of $1.24 billion
with an average per-share cost of $45.38. In the fourth quarter 2008, the Company repurchased 5.2 million shares at
a cost of $200 million under the 2008 Program. Since the inception of the 2008 Program, the Company has
repurchased 32.4 million shares for a total cost of $1.44 billion with an average per-share cost of $44.34.
     The Company’s $5.5 billion share repurchase program, which was approved in August 2005 (the
“2005 Program”), originally authorized share repurchases of $500 million and was increased at various times. The
Company completed the 2005 Program in October 2008. During fiscal year 2008, the Company repurchased
42.4 million shares at a cost of $1.98 billion under the 2005 Program.
     From time to time, the Company may make additional share repurchases, which it intends to fund with the
Company’s free cash flow (cash flow from operations less capital expenditures). The Company’s Board of Directors
periodically reviews the Company’s share repurchase programs and approves the associated trading parameters.

13. SEGMENT AND GEOGRAPHIC DATA
      Reportable Segments. The Company has two reportable segments, PBM and Specialty Pharmacy. The PBM
segment involves sales of traditional prescription drugs and supplies to the Company’s clients and members, either
through the Company’s networks of contractually affiliated retail pharmacies or the Company’s mail-order pharma-
cies. The PBM segment also includes the operating results of PolyMedica, a provider of diabetes testing supplies
and related products, as well as majority-owned Europa Apotheek, which primarily provides mail-order pharmacy
services in Germany, commencing on the April 28, 2008 acquisition date. The Specialty Pharmacy segment, which
was formed at the time of the Accredo acquisition in 2005, includes the sale of higher-margin specialty pharmacy
products and services for the treatment of chronic and complex (potentially life-threatening) diseases. The Specialty
Pharmacy segment also includes the operating results of Critical Care, a provider of specialty infusion services.
     The Company defines the Specialty Pharmacy segment based on a product set and associated services, broadly
characterized to include drugs that are high-cost, usually developed by biotechnology companies and often injectable
or infusible, and which require elevated levels of patient support. When dispensed, these products frequently require
ancillary administration equipment, special packaging, and a higher degree of patient-oriented customer service than
is required in the traditional PBM business model, including in-home nursing services and administration. In
addition, specialty pharmacy products and services are often covered through medical benefit programs with the
primary payors being insurance companies and government programs. Additionally, payors include patients, as well
as PBM clients.
    Factors Used to Identify Reportable Segments. The Specialty Pharmacy segment was formed as a result of the
2005 acquisition of Accredo in response to a management desire to manage the acquired business together with
Medco’s pre-existing specialty pharmacy activity as a separate business from Medco’s PBM operations. This
acquisition complemented the pre-existing Medco specialty pharmacy operation, which was evolving in 2005.


                                                         101
Selected Segment Income and Asset Information. Total net revenues and operating income are measures used
by the chief operating decision maker to assess the performance of each of the Company’s operating segments. The
following tables present selected financial information about the Company’s reportable segments, including a
reconciliation of operating income to income before provision for income taxes ($ in millions):
For Fiscal Years Ended:                                             December 26, 2009                             December 27, 2008                          December 29, 2007
                                                                           Specialty                                    Specialty                                  Specialty
                                                               PBM         Pharmacy           Total        PBM(1)       Pharmacy       Total(1)        PBM(2)     Pharmacy(3)      Total(2)(3)
Product net revenues . . . . . . . . . . . . . . . . . . . $49,526.2        $9,435.2      $58,961.4       $42,678.5     $7,897.7      $50,576.2       $37,981.4    $5,980.5        $43,961.9
Total service revenues . . . . . . . . . . . . . . . . . .       750.5            92.3          842.8          605.3          76.5          681.8         482.1          62.2            544.3

Total net revenues . . . . . . . . . . . . . . . . . . . . .   50,276.7         9,527.5       59,804.2     43,283.8         7,974.2       51,258.0     38,463.5        6,042.7         44,506.2
Total cost of revenues . . . . . . . . . . . . . . . . . .     46,951.5         8,825.7       55,777.2     40,186.2         7,343.4       47,529.6     35,997.7        5,563.2         41,560.9
Selling, general and administrative expenses . . . . .          1,158.3          297.2         1,455.5        1,120.0        305.0         1,425.0        884.3         229.8           1,114.1
Amortization of intangibles . . . . . . . . . . . . . . .        258.1            47.5          305.6          240.5          44.6          285.1         188.6          39.5            228.1

Operating income . . . . . . . . . . . . . . . . . . . . . $ 1,908.8        $ 357.1       $ 2,265.9       $ 1,737.1     $ 281.2       $ 2,018.3       $ 1,392.9    $ 210.2         $ 1,603.1
Reconciling items to income before provision for
  income taxes:
Interest expense . . . . . . . . . . . . . . . . . . . . . .                                    172.5                                       233.7                                        134.2
Interest (income) and other (income) expense, net . .                                             (9.9)                                       (6.2)                                       (34.4)

Income before provision for income taxes . . . . . .                                      $ 2,103.3                                   $ 1,790.8                                    $ 1,503.3

Capital expenditures . . . . . . . . . . . . . . . . . . . $     209.1      $     29.7    $     238.8     $    258.5    $     28.4    $     286.9     $   142.4    $     35.3      $     177.7

(1)
      Includes majority-owned Europa Apotheek’s operating results commencing on the April 28, 2008 acquisition date, and for the subsequent
      period.
(2)
      Includes PolyMedica’s operating results commencing on the October 31, 2007 acquisition date, and for the subsequent periods.
(3)
      Includes Critical Care’s operating results commencing on the November 14, 2007 acquisition date, and for the subsequent periods.
Identifiable Assets:                                                          As of December 26, 2009                                          As of December 27, 2008
                                                                                     Specialty                                                        Specialty
                                                                          PBM        Pharmacy         Total                                PBM        Pharmacy         Total

Total identifiable assets . . . . . . . . . . . . $14,226.8                               $3,688.7              $17,915.5             $13,267.2            $3,743.7              $17,010.9
     Geographic Information. The Company’s net revenues from its European operations represented less than 1%
of the Company’s consolidated net revenues for fiscal years 2009 and 2008. There were no revenues from European
operations in fiscal 2007. All other revenues are primarily earned in the United States.

14. COMMITMENTS AND CONTINGENCIES
Legal Proceedings
     In the ordinary course of business, the Company is involved in litigation, claims, government inquiries,
investigations, charges and proceedings, including, but not limited to, those relating to regulatory, commercial,
employment, employee benefits and securities matters. The significant matters are described below.
      There is uncertainty regarding the possible course and outcome of the proceedings discussed below. Although it
is not feasible to predict or determine the final outcome of any proceedings with certainty, the Company believes
there is no litigation pending against the Company that could have, individually or in the aggregate, a material
adverse effect on the Company’s business, financial condition, liquidity and operating results. However, there can be
no assurances that an adverse outcome in any of the proceedings described below will not result in material fines,
penalties and damages, changes to the Company’s business practices, loss of (or litigation with) clients or a material
adverse effect on the Company’s business, financial condition, liquidity and operating results. It is also possible that
future results of operations for any particular quarterly or annual period could be materially adversely affected by
the ultimate resolution of one or more of these matters, or changes in the Company’s assumptions or its strategies
related to these proceedings. The Company continues to believe that its business practices comply in all material
respects with applicable laws and regulations and is vigorously defending itself in the actions described below. The
Company believes that most of the claims made in these proceedings would not likely be covered by insurance.


                                                                                          102
In accordance with the FASB’s standard on accounting for contingencies, the Company records accruals for
contingencies when it is probable that a liability will be incurred and the amount of loss can be reasonably
estimated. These assessments can involve a series of complex judgments about future events and may rely heavily
on estimates and assumptions that have been deemed reasonable by management.
     Government Proceedings and Requests for Information. The Company is aware of the existence of three
sealed qui tam matters. The first action is filed in the Eastern District of Pennsylvania and it appears to allege that
the Company billed government payors using invalid or out-of-date national drug codes (“NDCs”). The second
action is filed in the District of New Jersey and appears to allege that the Company charged government payors a
different rate than it reimbursed pharmacies; engaged in duplicate billing; refilled prescriptions too soon; and billed
government payors for prescriptions written by unlicensed physicians and physicians with invalid Drug Enforcement
Agency authorizations. The Department of Justice has not yet made any decision as to whether it will intervene in
either of these matters. The matters are under seal and U.S. District Court orders prohibit the Company from
answering inquiries about the complaints. The Company was notified of the existence of these two qui tam matters
during settlement negotiations on an unrelated matter with the Department of Justice in 2006. The Company does
not know the identities of the relators in either of these matters.
      A third qui tam matter relates to PolyMedica, a subsidiary of the Company acquired in the fourth quarter of
2007. The Company is currently complying with a subpoena for documents relating to this matter from the
Department of Health and Human Services Office of the Inspector General and fully cooperating with the
Government’s investigation. The Company has learned that the Government’s investigation arose from a qui tam
complaint that was filed against the Company and PolyMedica. The Company was able to make the public
disclosure of the existence of the qui tam pursuant to an order issued by the Court where the qui tam complaint was
filed, permitting disclosure of the existence of the qui tam complaint. The qui tam complaint itself, and all filings in
the case, remain under seal until further order of the applicable Court. By order of the Court, Medco is prohibited
from disclosing any additional information regarding the qui tam complaint. The Government has not made an
intervention decision at this time.
      ERISA and Similar Litigation. In December 1997, a lawsuit captioned Gruer v. Merck-Medco Managed Care,
L.L.C. was filed in the U.S. District Court for the Southern District of New York against Merck & Co., Inc.
(“Merck”) and the Company. The suit alleges that the Company should be treated as a “fiduciary” under the
provisions of ERISA (the Employee Retirement Income Security Act of 1974) and that the Company had breached
fiduciary obligations under ERISA in a variety of ways. After the Gruer case was filed, a number of other cases
were filed in the same Court asserting similar claims. In December 2002, Merck and the Company agreed to settle
the Gruer series of lawsuits on a class action basis for $42.5 million, and agreed to certain business practice
changes, to avoid the significant cost and distraction of protracted litigation. In September 2003, the Company paid
$38.3 million to an escrow account, representing the Company’s portion, or 90%, of the proposed settlement. The
release of claims under the settlement applies to plans for which the Company administered a pharmacy benefit at
any time between December 17, 1994 and the date of final approval. It does not involve the release of any potential
antitrust claims. In May 2004, the U.S. District Court granted final approval to the settlement and a final judgment
was entered in June 2004.
      Various appeals were taken and in October 2007, the U.S. Court of Appeals for the Second Circuit overruled
all but one objection to the settlement that had been the subject of the appeals. The appeals court vacated the lower
court’s approval of the settlement in one respect, and remanded the case to the District Court for further proceedings
relating to the manner in which the settlement funds should be allocated between self-funded and insured plans.
Since that time, the settlement has been revised to allocate a greater percentage of the settlement funds to self-
funded plans, and in June 2009, the District Court approved the modified plan of allocation. The plaintiff in one of
the similar Gruer series of cases discussed above, Blumenthal v. Merck-Medco Managed Care, L.L.C., et al., has
elected to opt out of the settlement.


                                                          103
Similar ERISA-based complaints against the Company and Merck were filed in eight additional actions by
ERISA plan participants, purportedly on behalf of their plans, and, in some of the actions, similarly situated self-
funded plans. The ERISA plans themselves, which were not parties to these lawsuits, had elected to participate in
the Gruer settlement discussed above and, accordingly, seven of these actions had been dismissed pursuant to the
final judgment discussed above. The plaintiff in another action, Betty Jo Jones v. Merck-Medco Managed Care,
L.L.C., et al., has filed a Second Amended Complaint, in which she seeks to represent a class of all participants and
beneficiaries of ERISA plans that required such participants to pay a percentage co-payment on prescription drugs.
The effect of the release under the Gruer settlement discussed above on the Jones action has not yet been litigated.
In addition to these cases, a proposed class action complaint against Merck and the Company has been filed in the
U.S. District Court for the Northern District of California by trustees of another benefit plan, the United Food and
Commercial Workers Local Union No. 1529 and Employers Health and Welfare Plan Trust. This plan has elected to
opt out of the Gruer settlement. The United Food and Commercial Workers Local Union No. 1529 and Employers
Health and Welfare Plan Trust v. Medco Health Solutions, Inc. and Merck & Co., Inc. action has been transferred
and consolidated in the U.S. District Court for the Southern District of New York by order of the Judicial Panel on
Multidistrict Litigation.
      In September 2002, a lawsuit captioned Miles v. Merck-Medco Managed Care, L.L.C., based on allegations
similar to those in the ERISA cases discussed above, was filed against Merck and the Company in the Superior
Court of California. The theory of liability in this action is based on a California law prohibiting unfair business
practices. The Miles case was removed to the U.S. District Court for the Southern District of California and was
later transferred to the U.S. District Court for the Southern District of New York and consolidated with the ERISA
cases pending against Merck and the Company in that Court.
     The Company does not believe that it is a fiduciary under ERISA (except in those instances in which it has
expressly contracted to act as a fiduciary for limited purposes), and believes that its business practices comply with
all applicable laws and regulations.
      Antitrust and Related Litigation. In August 2003, a lawsuit captioned Brady Enterprises, Inc., et al. v. Medco
Health Solutions, Inc., et al. was filed in the U.S. District Court for the Eastern District of Pennsylvania against
Merck and the Company. The plaintiffs, who seek to represent a national class of retail pharmacies that had
contracted with the Company, allege that the Company has conspired with, acted as the common agent for, and used
the combined bargaining power of plan sponsors to restrain competition in the market for the dispensing and sale of
prescription drugs. The plaintiffs allege that, through the alleged conspiracy, the Company has engaged in various
forms of anticompetitive conduct, including, among other things, setting artificially low reimbursement rates to such
pharmacies. The plaintiffs assert claims for violation of the Sherman Act and seek treble damages and injunctive
relief. The plaintiffs’ motion for class certification is currently pending before the Multidistrict Litigation Court.
      In October 2003, a lawsuit captioned North Jackson Pharmacy, Inc., et al. v. Medco Health Solutions, Inc.,
et al. was filed in the U.S. District Court for the Northern District of Alabama against Merck and the Company. In
their Second Amended Complaint, the plaintiffs allege that Merck and the Company engaged in price fixing and
other unlawful concerted actions with others, including other PBMs, to restrain trade in the dispensing and sale of
prescription drugs to customers of retail pharmacies who participate in programs or plans that pay for all or part of
the drugs dispensed, and conspired with, acted as the common agent for, and used the combined bargaining power
of plan sponsors to restrain competition in the market for the dispensing and sale of prescription drugs. The
plaintiffs allege that, through such concerted action, Merck and the Company engaged in various forms of
anticompetitive conduct, including, among other things, setting reimbursement rates to such pharmacies at unreason-
ably low levels. The plaintiffs assert claims for violation of the Sherman Act and seek treble damages and injunctive
relief. The plaintiffs’ motion for class certification has been granted, but this matter has been consolidated with other
actions where class certification remains an open issue.


                                                          104
In December 2005, a lawsuit captioned Mike’s Medical Center Pharmacy, et al. v. Medco Health Solutions,
Inc., et al. was filed against the Company and Merck in the U.S. District Court for the Northern District of
California. The plaintiffs seek to represent a class of all pharmacies and pharmacists that had contracted with the
Company and California pharmacies that had indirectly purchased prescription drugs from Merck and make factual
allegations similar to those in the Alameda Drug Company action discussed below. The plaintiffs assert claims for
violation of the Sherman Act, California antitrust law and California law prohibiting unfair business practices. The
plaintiffs demand, among other things, treble damages, restitution, disgorgement of unlawfully obtained profits and
injunctive relief.
     In April 2006, the Brady plaintiffs filed a petition to transfer and consolidate various antitrust actions against
PBMs, including North Jackson, Brady, and Mike’s Medical Center before a single federal judge. The motion was
granted in August 2006. These actions are now consolidated for pretrial purposes in the U.S. District Court for the
Eastern District of Pennsylvania. The consolidated action is known as In re Pharmacy Benefit Managers Antitrust
Litigation. The plaintiffs’ motion for class certification in certain actions is currently pending before the Multidistrict
Litigation Court.
     In January 2004, a lawsuit captioned Alameda Drug Company, Inc., et al. v. Medco Health Solutions, Inc., et al.
was filed against the Company and Merck in the Superior Court of California. The plaintiffs, which seek to
represent a class of all California pharmacies that had contracted with the Company and that had indirectly
purchased prescription drugs from Merck, allege, among other things, that since the expiration of a 1995 consent
injunction entered by the U.S. District Court for the Northern District of California, if not earlier, the Company
failed to maintain an Open Formulary (as defined in the consent injunction), and that the Company and Merck had
failed to prevent nonpublic information received from competitors of Merck and the Company from being disclosed
to each other. The plaintiffs further allege that, as a result of these alleged practices, the Company has been able to
increase its market share and artificially reduce the level of reimbursement to the retail pharmacy class members,
and that the prices of prescription drugs from Merck and other pharmaceutical manufacturers that do business with
the Company had been fixed and raised above competitive levels. The plaintiffs assert claims for violation of
California antitrust law and California law prohibiting unfair business practices. The plaintiffs demand, among other
things, compensatory damages, restitution, disgorgement of unlawfully obtained profits and injunctive relief. In the
complaint, the plaintiffs further allege, among other things, that the Company acts as a purchasing agent for its plan
sponsor customers, resulting in a system that serves to suppress competition.
      Contract Litigation. In 2006, a group of independent pharmacies filed an arbitration demand against Medco
captioned Tomeldon Company, Inc. et al. v. Medco Health Solutions, Inc. The claimant pharmacies allege, among
other things, breach of contract arising out of Medco’s Pharmacy Services Manual and Medco’s retail pharmacy
audits of compound claims. The arbitration demand was filed on behalf of a purported class of retail pharmacies
that had been audited for overpriced compounds. The claimants later expanded their claims to include two additional
classes: one for pharmacies that claimed they lost profits after leaving Medco’s network following an audit finding
of overpriced compounds and one for pharmacies subject to audits that were not yet finalized. In August 2008, the
arbitration panel certified the original class but only concerning certain breach of contract claims. The panel
declined to certify the additional proposed classes and also declined to certify the original class based on business
tort or quasi-contract claims. In June 2009, the parties reached an agreement in principle to settle the dispute for an
immaterial amount. The arbitration panel issued a final order approving the settlement on November 11, 2009.
      PolyMedica Shareholder Litigation. In August 2007, a putative stockholder class action lawsuit related to the
merger was filed by purported stockholders of PolyMedica in the Superior Court of Massachusetts for Middlesex
County against, amongst others, the Company and its affiliate, MACQ Corp. The lawsuit captioned Groen v.
PolyMedica Corp. et al., alleged, among other things, that the price agreed to in the merger agreement was
inadequate and unfair to the PolyMedica stockholders and that the defendants breached their duties to the
stockholders and/or aided breaches of duty by other defendants in negotiating and approving the merger agreement.
Shortly thereafter, two virtually identical lawsuits (only one of which named the Company as a defendant) were
filed in the same Court. In September 2007, the parties to these actions reached an agreement in principle to settle
the actions for an immaterial amount and in May 2008, the Court granted final approval of the settlement and
dismissed the actions with prejudice on the merits. Plaintiffs’ counsel’s application for attorneys’ fees was rejected
by the Court, resulting in the award of costs only. Plaintiffs’ counsel has filed a motion for reconsideration of the
fees with the Court.


                                                           105
Other Matters
      The Company entered into an indemnification and insurance matters agreement with Merck in connection with
the Company’s spin-off in 2003. To the extent that the Company is required to indemnify Merck for liabilities
arising out of a lawsuit, an adverse outcome with respect to Merck could result in the Company making
indemnification payments in amounts that could be material, in addition to any damages that the Company is
required to pay.
     In the ordinary course of business, the Company is involved in disputes with clients, retail pharmacies and
vendors, which may involve litigation, claims, arbitrations and other proceedings. Although it is not feasible to
predict or determine the final outcome of any proceedings with certainty, the Company does not believe that any of
these disputes could have, individually or in the aggregate, a material adverse effect on the Company’s business,
financial condition, liquidity or operating results.

Purchase Commitments
     As of December 26, 2009, the Company has purchase commitments primarily for contractual commitments to
purchase inventory from certain biopharmaceutical manufacturers associated with Accredo’s Specialty Pharmacy
business consisting of a firm commitment of $324.6 million, and firm commitments for 2010 of $123.5 million with
additional commitments through 2012 subject to price increases or variable quantities based on patient usage or days
on hand. The Company also has purchase commitments for diabetes supplies of $69.9 million, technology-related
agreements of $44.0 million and advertising commitments of $11.8 million.

Insurance
     The Company maintains insurance coverage with deductibles and self-insurance that management considers
adequate for its needs under current circumstances, including commercial professional liability coverage of
$85 million per individual claim. Such coverage reflects market conditions (including cost and availability) existing
at the time coverage is written. In addition to the Company’s commercial professional liability insurance policies,
the Company has a retained liability component requiring certain self-insurance reserves to cover potential claims.
The Company currently processes any claims included in self-insured retention levels through a captive insurance
company. The Company’s PBM operations, including, for example, the dispensing of prescription drugs by its mail-
order pharmacies, may subject the Company to litigation and liability for damages. Historically, the Company has
not had any professional liability claims that have exceeded its insurance coverage amount, and any claims have not
been material. The Company believes that its insurance coverage protection for these types of claims is adequate.
However, the Company might not be able to maintain its professional and general liability insurance coverage in the
future, and insurance coverage might not be available on acceptable terms or adequate to cover any or all potential
professional liability claims. A successful professional liability claim in excess of the Company’s insurance
coverage, or one for which an exclusion from coverage applies, could have a material adverse effect on the
Company’s financial condition and results of operations.


                                                        106
Item 9. Changes in and Disagreements with Accountants on Accounting and Financial Disclosure.
     Not applicable.

Item 9A. Controls and Procedures.
Management’s Responsibility for Financial Statements
     Our management is responsible for the integrity and objectivity of all information presented in this Annual Report
on Form 10-K. The consolidated financial statements were prepared in conformity with accounting principles generally
accepted in the United States of America and include amounts based on management’s best estimates and judgments.
     The Audit Committee of the Board of Directors, which is comprised solely of independent directors, meets
regularly with our independent registered public accounting firm, PricewaterhouseCoopers LLP, the internal auditors
and representatives of management to review accounting, financial reporting, internal control and audit matters, as
well as the nature and extent of the related audit efforts. The Audit Committee is responsible for the engagement of
our independent registered public accounting firm. Our independent registered public accounting firm and internal
auditors have free access to the Audit Committee.

Conclusion Regarding the Effectiveness of Disclosure Controls and Procedures
      The Company maintains disclosure controls and procedures that are designed to provide reasonable assurance
that information required to be disclosed by the Company in reports that we file or submit under the Securities
Exchange Act of 1934, as amended (the “Exchange Act”) is recorded, processed, summarized, and reported within
the time periods specified in SEC rules and forms, and is accumulated and communicated to management, including
our Chief Executive Officer and Chief Financial Officer, as appropriate, to allow timely decisions regarding required
disclosure. As of the end of the period covered by this Report, our management, with the participation of the Chief
Executive Officer and Chief Financial Officer, evaluated the effectiveness of the design and operation of the
Company’s disclosure controls and procedures (as defined in Rules 13a-15(e) and 15d-15(e) under the Exchange
Act). Based on this evaluation our Chief Executive Officer and Chief Financial Officer have concluded that the
Company’s disclosure controls and procedures were effective to provide reasonable assurance that the objectives
described above were met as of the end of the period covered by this Annual Report on Form 10-K.

Management’s Report on Internal Control over Financial Reporting
     The Company’s management is responsible for establishing and maintaining adequate internal control over financial
reporting, as such term is defined in Rules 13a-15(f) and 15d-15(f) under the Securities Exchange Act of 1934.
     Because of its inherent limitations, internal control over financial reporting may not prevent or detect
misstatements. Also, projections of any evaluation of effectiveness to future periods are subject to the risk that
controls may become inadequate because of changes in conditions, or that the degree of compliance with the
policies or procedures may deteriorate.
     The Company’s management, with the participation of its Chief Executive Officer and Chief Financial Officer,
assessed the effectiveness of the Company’s internal control over financial reporting as of December 26, 2009. In
making this assessment, the Company’s management used the criteria set forth by the Committee of Sponsoring
Organizations of the Treadway Commission in Internal Control—Integrated Framework (the “COSO criteria”).
     Based on its assessment, management has concluded that, as of December 26, 2009, the Company’s internal
control over financial reporting is effective based on the COSO criteria.
     The effectiveness of the Company’s internal control over financial reporting as of December 26, 2009 has been
audited by PricewaterhouseCoopers LLP, an independent registered public accounting firm, as stated in their report,
which is set forth in Part II, Item 8 of this Annual Report on Form 10-K.

Changes in Internal Control
     There were no changes in our internal control over financial reporting identified in connection with the
evaluation of our controls performed during the quarter ended December 26, 2009 that have materially affected, or
are reasonably likely to materially affect, our internal control over financial reporting.

Item 9B. Other Information.
     Not applicable.


                                                          107
PART III

Item 10. Directors, Executive Officers and Corporate Governance.
     Information about our directors and nomination procedures is incorporated by reference to the discussion under
the heading “Proposal 1. Election of Directors” and “Corporate Governance and Related Matters” of our Proxy
Statement for the 2010 Annual Meeting of Shareholders. Information about compliance with Section 16(a) of the
Securities Exchange Act of 1934 is incorporated by reference to the discussion under the heading “Other Matters—
Section 16(a) Beneficial Ownership Reporting Compliance” in our Proxy Statement for the 2010 Annual Meeting of
Shareholders. Information about our Audit Committee, including the members of the committee and our Audit
Committee financial experts, is incorporated by reference to the discussion under the headings “Corporate
Governance and Related Matters—Board and Committee Membership” and “Audit Committee Report” in our Proxy
Statement for the 2010 Annual Meeting of Shareholders. The balance of the information required by this Item 10 is
contained in the discussion entitled “Executive Officers of the Company” in Part I of this Annual Report on
Form 10-K.
      The Company’s Code of Conduct is available on our website at http://www.medcohealth.com. We intend to
satisfy the disclosure requirement under Item 5.05 of Form 8-K regarding an amendment to, or waiver from, a
provision of our Code of Conduct by posting such information on our website at http://www.medcohealth.com.

Item 11. Executive Compensation.
     Information about director and executive compensation is incorporated by reference to the discussion under the
headings “Director Compensation,” “Executive Compensation,” “Compensation Discussion and Analysis,” “Compen-
sation Committee Report” and “Corporate Governance and Related Matters—Compensation Committee Interlocks
and Insider Participation” in our Proxy Statement for the 2010 Annual Meeting of Shareholders.

Item 12. Security Ownership of Certain Beneficial Owners and Management and Related Shareholder
          Matters.
     Information required by this item is incorporated by reference to the discussion under the caption “Ownership
of Securities” and “Other Matters—Equity Compensation Plan Information” in our Proxy Statement for the
2010 Annual Meeting of Shareholders.
     Rule 10b5-1 Sales Plans. Medco’s comprehensive compliance program includes a broad policy against insider
trading. The procedures promulgated under that policy include regularly scheduled blackout periods that apply to
over 600 employees. Executive officers are prohibited from trading in Company stock during the period that begins
on the first day of the last month of the fiscal period and ends on the third trading day after the release of earnings.
In addition, executive officers are required to pre-clear all of their trades. Medco’s executive officers are also subject
to share ownership guidelines and retention requirements. The ownership targets are based on a multiple of salary
(5, 3 or 1.5 times salary), but are expressed as a number of shares. The targets are determined using base salary and
the closing price of our stock on the date of our Annual Meeting of Shareholders. The number of shares required to
be held has been calculated using a $44.38 stock price, the closing price of our stock on the date of the
2009 Annual Meeting of Shareholders.
      To facilitate compliance with the ownership guidelines and retention requirements, Medco’s Board of Directors
authorized the use of prearranged trading plans under Rule 10b5-1 of the Securities Exchange Act of 1934.
Rule 10b5-1 permits insiders to adopt predetermined plans for selling specified amounts of stock or exercising stock
options under specified conditions and at specified times. Executive officers may only enter into a trading plan
during an open trading window and they must not possess material nonpublic information regarding the Company at
the time they adopt the plan. Using trading plans, insiders can diversify their investment portfolios while avoiding
concerns about transactions occurring at a time when they might possess material nonpublic information. Under
Medco’s policy, sales instructions made pursuant to a written trading plan may be executed during a blackout period.
In addition, the use of trading plans provides Medco with a greater ability to monitor trading and compliance with
its stock ownership guidelines. Generally, under these trading plans, the individual relinquishes control over the
transactions once the trading plan is put into place. Accordingly, sales under these plans may occur at any time,
including possibly before, simultaneously with, or immediately after significant events involving our company.


                                                           108
All trading plans adopted by Medco executives are reviewed and approved by the Office of the General
Counsel. For ease of administration, executives have been permitted to add new orders to existing plans rather than
requiring the adoption of a new plan. Once modified, a plan cannot be changed for at least 90 days. Both new plans
and modifications are subject to a mandatory “waiting period” designed to safeguard the plans from manipulation or
market timing.
     The following table, which we are providing on a voluntary basis, sets forth the Rule 10b5-1 sales plans entered
into by our executive officers in effect as of February 19, 2010(1):

                                                                                           Number of
                                       Number of                                           Shares Sold    Projected     Projected
                                    Shares to be Sold                                       Under the     Beneficial    Aggregate
          Name and Position         Under the Plan(2)     Timing of Sales Under the Plan     Plan(3)     Ownership(4)   Holdings(5)
  Gabriel Cappucci                           12,136     Option exercise of                          0        41,877        93,664
  Senior Vice President and                             12,136 shares shall occur when
  Controller, Chief Accounting                          stock reaches specific prices.
  Officer

  John P. Driscoll(6)                    —(6)           See footnote(6).                            0       214,888      483,959
  President, New Markets

  Robert S. Epstein                          51,440     Option exercise of                          0        73,882      335,382
  Chief Medical Officer and                             51,440 shares shall occur when
  President, Medco Research                             stock reaches a specific price.
  Institute

  Brian T. Griffin(6)                      280,245      Option exercise of                          0        53,877      313,816
  Group President, Health Plans                         268,164 shares shall occur
                                                        when stock reaches specific
                                                        prices; sale of 12,081
                                                        previously acquired shares
                                                        shall occur when stock reaches
                                                        a specific price. See
                                                        footnote(6).

  Laizer Kornwasser(6)                   —(6)           See footnote(6).                            0        87,789      259,004
  President, Liberty Medical and
  Senior Vice President, Channel
  and Generic Strategy

  Karin Princivalle(6)                       21,621     Option exercise of                          0        99,763      236,015
  Senior Vice President,                                21,621 shares shall occur when
  Human Resources                                       stock reaches specific prices.
                                                        See footnote(6).

  Timothy C. Wentworth(6)                  136,165      Option exercise of                          0        49,429      307,548
  Group President,                                      136,165 shares shall occur
  Employer Accounts                                     when stock reaches specific
                                                        prices. See footnote(6).

(1)
      This table does not include any trading plans entered into by any executive officer that have been terminated or
      expired by their terms or have been fully executed through February 19, 2010.
(2)
      This column reflects the number of shares remaining to be sold as of February 19, 2010.
(3)
      This column reflects the number of shares sold under the plan through February 19, 2010.
(4)
      This column reflects an estimate of the number of whole shares each identified executive officer will beneficially
      own following the sale of all shares under the Rule 10b5-1 sales plans currently in effect. This information
      reflects the beneficial ownership of our common stock as of February 19, 2010, and includes shares of our com-
      mon stock subject to options or restricted stock units that were then vested or exercisable and unvested options
      and restricted stock units that are included in a current trading plan for sales periods that begin after the applica-
      ble vesting date. Options cannot be exercised and restricted stock units cannot be converted prior to vesting. The
      estimates reflect option exercises and sales under the plan, but do not reflect any changes to beneficial ownership
      that may have occurred since February 19, 2010 outside of the plan.


                                                               109
(5)
       This column reflects an estimate of the total aggregate number of whole shares each identified executive officer
       will have an interest in following the sale of all shares under the Rule 10b5-1 sales plans currently in effect. This
       information reflects the beneficial ownership of our common stock as of February 19, 2010, and includes shares
       of our common stock subject to options (whether or not currently exercisable) or restricted stock units (whether
       or not vested). Options cannot be exercised and restricted stock units cannot be converted prior to vesting. The
       estimates reflect option exercises and sales under the plan, but do not reflect any changes to beneficial ownership
       that may have occurred since February 19, 2010 outside of the plan.
(6)
       The trading plans for Mr. Driscoll, Mr. Griffin, Mr. Kornwasser, Ms. Princivalle and Mr. Wentworth also cover
       100 percent of the net shares that will be delivered upon the vesting of the individual’s restricted stock unit
       granted on February 23, 2007, after the payment of withholding taxes and provided the stock reaches a specific
       price. The exact number of shares will be determined on the vesting date. As a result, the shares are not reflected
       in this table.
     Certain directors who have served on the Board since Medco became a publicly traded company in August
2003 entered into Rule 10b5-1 sales plans to diversify a portion of their holdings in Company common stock. The
following table, which we are providing on a voluntary basis, sets forth the Rule 10b5-1 sales plans entered into by
our directors in effect as of February 19, 2010(1):

                                                                                             Number of
                             Number of                                                       Shares Sold    Projected     Projected
                          Shares to be Sold                                                   Under the     Beneficial    Aggregate
      Name and Position   Under the Plan(2)           Timing of Sales Under the Plan           Plan(3)     Ownership(4)   Holdings(5)
  John L. Cassis              16,000          Option exercise of 16,000 shares shall occur       0           73,900        83,900
                                              when stock reaches specific price.

  Michael Goldstein           16,000          Option exercise of 16,000 shares shall occur       0           50,090        60,090
                                              when stock reaches specific price.

(1)
       This table does not include any trading plans entered into by any director that have been terminated or expired
       by their terms or have been fully executed through February 19, 2010.
(2)
       This column reflects the number of shares remaining to be sold as of February 19, 2010.
(3)
       This column reflects the number of shares sold under the plan through February 19, 2010.
(4)
       This column reflects an estimate of the number of whole shares each identified director will beneficially own fol-
       lowing the sale of all shares under the Rule 10b5-1 sales plans currently in effect. This information reflects the
       beneficial ownership of our common stock as of February 19, 2010, and includes shares of our common stock
       subject to options or restricted stock units that were then vested or exercisable and unvested options and
       restricted stock units that are included in a current trading plan for sales periods that begin after the applicable
       vesting date. Options cannot be exercised and restricted stock units cannot be converted prior to vesting. The esti-
       mates reflect option exercises and sales under the plan, but do not reflect any changes to beneficial ownership
       that may have occurred since February 19, 2010 outside of the plan.
(5)
       This column reflects an estimate of the total aggregate number of whole shares each identified director will have
       an interest in following the sale of all shares under the Rule 10b5-1 sales plans currently in effect. This informa-
       tion reflects the beneficial ownership of our common stock as of February 19, 2010, and includes shares of our
       common stock subject to options (whether or not currently exercisable) or restricted stock units (whether or not
       vested). Options cannot be exercised and restricted stock units cannot be converted prior to vesting. The estimates
       reflect option exercises and sales under the plan, but do not reflect any changes to beneficial ownership that may
       have occurred since February 19, 2010 outside of the plan.

Item 13. Certain Relationships and Related Transactions, and Director Independence.
     Information required by this item is incorporated by reference to the discussions under the captions “Transac-
tions with Related Persons” and “Corporate Governance and Related Matters—Director Independence,” in our Proxy
Statement for the 2010 Annual Meeting of Shareholders.

Item 14. Principal Accounting Fees and Services.
     Information about the fees for 2009 and 2008 for professional services rendered by our independent registered
public accounting firm is incorporated by reference to the discussion under the heading “Proposal 2. Ratification of
Independent Registered Public Accounting Firm” of our Proxy Statement for the 2010 Annual Meeting of
Shareholders. Our Audit Committee’s policy on pre-approval of audit and permissible non-audit services of our
independent auditors is incorporated by reference to the discussion under the heading “Proposal 2. Ratification of
Independent Registered Public Accounting Firm” of our Proxy Statement for the 2010 Annual Meeting of
Shareholders.


                                                                  110
PART IV

Item 15. Exhibits, Financial Statement Schedules.
(a) The following documents are filed as part of this report:
   (1) Financial Statements. The following financial statements are filed as part of this report under Item 8,
       “Financial Statements and Supplementary Data”:
              Report of Independent Registered Public Accounting Firm
              Consolidated Balance Sheets as of December 26, 2009 and December 27, 2008
              Consolidated Statements of Income for the Years Ended December 26, 2009, December 27, 2008 and
                  December 29, 2007
              Consolidated Statements of Stockholders’ Equity for the Years Ended December 29, 2007,
                  December 27, 2008 and December 26, 2009
              Consolidated Statements of Cash Flows for the Years Ended December 26, 2009, December 27, 2008
                  and December 29, 2007
              Notes to Consolidated Financial Statements
    (2) Financial Statement Schedule:
              Schedule II—Valuation and Qualifying Accounts
     All other schedules are omitted as the required information is inapplicable or the information is presented in
the consolidated financial statements and notes thereto in Item 8 above.
    (3) Exhibits:
Exhibit
Number        Exhibit Description
  3.1         Third Amended and Restated Certificate of Incorporation of Medco Health Solutions, Inc. as of
              May 22, 2008. Incorporated by reference to Exhibit 3.1 to the Registrant’s Current Report on
              Form 8-K filed May 23, 2008.

  3.2         Amended and Restated Bylaws of Medco Health Solutions, Inc. as of December 10, 2008.
              Incorporated by reference to Exhibit 3.1 to the Registrant’s Current Report on Form 8-K filed
              December 11, 2008.

  4.1         Form of Medco Health Solutions, Inc. common stock certificate. Incorporated by reference to
              Exhibit 4.1 to the Registrant’s Amendment No. 3 to Form 10, File No. 1-31312, filed July 25, 2003.

  4.2         Indenture between the Registrant and U.S. Bank Trust National Association, as Trustee, relating to the
              Registrant’s senior notes due 2013. Incorporated by reference to Exhibit 4.2 to the Registrant’s Annual
              Report on Form 10-K for the fiscal year ended December 27, 2003, File No. 001-31312.


                                                         111
Exhibit
Number    Exhibit Description
 4.3      Indenture between the Registrant and U.S. Bank Trust National Association, as Trustee, relating to the
          Registrant’s senior notes due 2018. Incorporated by reference to Exhibit 4.3 to the Registrant’s Current
          Report on Form 8-K filed March 18, 2008.

10.1      Credit Agreement, dated as of April 30, 2007, among the Registrant, the lenders party thereto and
          Bank of America, N.A., as administrative agent and Citicorp North America, Inc. and JPMorgan
          Chase Bank, N.A., as Co-Syndication Agents. Incorporated by reference to Exhibit 10.1 to the
          Registrant’s Quarterly Report on Form 10-Q filed May 2, 2007.

10.2      Second Amended and Restated Receivables Purchase Agreement dated July 28, 2008, among Medco
          Health Receivables, LLC, the financial institutions and commercial paper conduits party thereto and
          Citicorp North America, Inc., as administrative agent. Incorporated by reference to Exhibit 10.3 to the
          Registrant’s Annual Report on Form 10-K filed February 24, 2009.

10.3*     Amendment No. 1 dated July 27, 2009 to Second Amended and Restated Receivables Purchase
          Agreement dated July 28, 2008, among Medco Health Receivables, LLC, the financial institutions and
          commercial paper conduits party thereto and Citicorp North America, Inc., as administrative agent.

10.4†     Medco Health Solutions, Inc. 2002 Stock Incentive Plan, as amended. Incorporated by reference to
          Exhibit 10.1 to the Registrant’s Quarterly Report on Form 10-Q filed July 29, 2005.

10.5†     Medco Health Solutions, Inc. 2006 Executive Severance Plan. Incorporated by reference to
          Exhibit 10.1 to the Registrant’s Current Report on Form 8-K filed February 7, 2006.

10.6†     Medco Health Solutions, Inc. 2006 Change in Control Executive Severance Plan. Incorporated by
          reference to Exhibit 10.2 to the Registrant’s Current Report on Form 8-K filed February 7, 2006.

10.7      Indemnification and Insurance Matters Agreement between Merck & Co., Inc. and the Registrant.
          Incorporated by reference to Exhibit 10.4 to the Registrant’s Annual Report on Form 10-K for the
          fiscal year ended December 27, 2003, File No. 001-31312.

10.8      Tax Responsibility Allocation Agreement, dated as of August 12, 2003, between Merck & Co., Inc.
          and the Registrant. Incorporated by reference to Exhibit 10.5 to the Registrant’s Annual Report on
          Form 10-K for the fiscal year ended December 27, 2003, File No. 001-31312.

10.9†     Employment Agreement with David B. Snow, Jr., dated as of February 10, 2009. Incorporated by
          reference to Exhibit 10.1 to the Registrant’s Current Report on Form 8-K filed February 13, 2009.

10.10*†   Assignment and Assumption Agreement, dated as of December 27, 2009 to the February 10, 2009
          Employment Agreement with David B. Snow, Jr.

10.11†    Medco Health Solutions, Inc. Executive Annual Incentive Plan. Incorporated by reference to
          Exhibit 10.1 to the Registrant’s Current Report on Form 8-K, filed February 8, 2005, File
          No. 001-31312.


                                                     112
Exhibit
Number    Exhibit Description
10.12†    Performance Goals for 2010 under the Registrant’s Executive Annual Incentive Plan. Incorporated by
          reference to the Registrant’s Current Report on Form 8-K filed January 29, 2010.

10.13†    Form of terms and conditions for director stock option and restricted stock unit awards. Incorporated
          by reference to Exhibit 10.2 to the Registrant’s Current Report on Form 8-K, filed February 8, 2005,
          File No. 001-31312.

10.14†    Accredo Health, Incorporated 2002 Long-Term Incentive Plan. Incorporated by reference to
          Exhibit 10.3 of the Registrant’s Current Report on Form 8-K filed August 24, 2005.

10.15†    Form of terms and conditions of the 2008 Restricted Stock Unit Grants under the Medco Health
          Solutions, Inc. 2002 Stock Incentive Plan. Incorporated by reference to Exhibit 10.22 to the
          Registrant’s Annual Report on Form 10-K filed February 19, 2008.

10.16†    Form of terms and conditions of 2008 Non-Qualified Stock Option Grants under the Medco Health
          Solutions, Inc. 2002 Stock Incentive Plan. Incorporated by reference to Exhibit 10.23 to the
          Registrant’s Annual Report on Form 10-K filed February 19, 2008.

10.17†    Medco Health Solutions, Inc. Deferred Compensation Plan for Directors. Incorporated by reference to
          Exhibit 10.24 to the Registrant’s Annual Report on Form 10-K filed February 19, 2008.

10.18     Settlement Agreement and Mutual Releases, dated as of October 23, 2006, entered into by and among
          the United States of America, acting through the United States Department of Justice, on behalf of the
          Office of the Inspector General of the Department of Health and Human Services, the Office of
          Personnel Management, and the Department of Defense TRICARE Management Activity; Medco
          Health Solutions, Inc.; Diane M. Collins; and relators George Bradford Hunt, Walter William Gauger
          and Joseph Piacentile. Incorporated by reference to Exhibit 10.1 to the Registrant’s Current Report on
          Form 8-K filed October 27, 2006.

10.19     Settlement Agreement and Mutual Releases, dated as of October 23, 2006, entered into by and among
          the United States of America, acting through the United States Department of Justice, on behalf of the
          Office of the Inspector General of the Department of Health and Human Services and the Office of
          Personnel Management; Medco Health Solutions, Inc.; and relator Karl S. Schumann. Incorporated by
          reference to Exhibit 10.2 to the Registrant’s Current Report on Form 8-K filed October 27, 2006.

10.20     Settlement Agreement and Mutual Releases, dated as of October 23, 2006, entered into by and among
          the United States of America, acting through the United States Department of Justice, on behalf of the
          Office of the Inspector General of the Department of Health and Human Services and Medco Health
          Solutions, Inc. Incorporated by reference to Exhibit 10.3 to the Registrant’s Current Report on
          Form 8-K filed October 27, 2006.

10.21     Corporate Integrity Agreement, dated as of October 23, 2006, between the Office of the Inspector
          General of the Department of Health and Human Services and the Office of the Inspector General of
          the Office of Personnel Management and Medco Health Solutions, Inc. Incorporated by reference to
          Exhibit 10.4 to the Registrant’s Current Report on Form 8-K filed October 27, 2006.

12.1*     Statement of Consolidated Ratios of Earnings to Fixed Charges.

21.1*     List of Subsidiaries.

23.1*     Consent of PricewaterhouseCoopers LLP, dated February 23, 2010.


                                                    113
Exhibit
Number      Exhibit Description
 31.1*      Certification of Chief Executive Officer pursuant to Section 302 of the Sarbanes-Oxley Act of 2002.

 31.2*      Certification of Chief Financial Officer pursuant to Section 302 of the Sarbanes-Oxley Act of 2002.

 32.1**     Certification of Chief Executive Officer pursuant to 18 U.S.C. Section 1350, as adopted pursuant to
            Section 906 of the Sarbanes-Oxley Act of 2002.

 32.2**     Certification of Chief Financial Officer pursuant to 18 U.S.C. Section 1350, as adopted pursuant to
            Section 906 of the Sarbanes-Oxley Act of 2002.

101.INS**   XBRL Instance Document.

101.SCH**   XBRL Taxonomy Extension Schema.

101.CAL** XBRL Taxonomy Extension Calculation Linkbase.

101.DEF**   XBRL Taxonomy Extension Definition Linkbase.

101.LAB** XBRL Taxonomy Extension Label Linkbase.

101.PRE**   XBRL Taxonomy Extension Presentation Linkbase.

† Management contract or compensatory plan or arrangement
* Filed herewith
** Furnished herewith


                                                      114
MEDCO HEALTH SOLUTIONS, INC.
                                                       SCHEDULE II

                                    VALUATION AND QUALIFYING ACCOUNTS
                                                ($ in millions)

Allowance for Doubtful Accounts Receivable:
                                                                 Balance at
                                                                 Beginning                                         Balance at
                                                                 of Period    Other   Provision   Write-offs(1)   End of Period

Fiscal Year Ended December 26, 2009 . . . . . . . . . . . . .     $120.0      $ 0.2     $133.1     $(120.0)         $133.3
Fiscal Year Ended December 27, 2008 . . . . . . . . . . . . .     $130.0      $ 1.0     $ 91.8     $(102.8)         $120.0
                                                                                    (2)
Fiscal Year Ended December 29, 2007 . . . . . . . . . . . . .     $ 81.8      $41.2     $ 61.9     $ (54.9)         $130.0
(1)
      Uncollectible accounts, net of recoveries.
(2)
      Primarily represents balances acquired as a result of the PolyMedica and Critical Care acquisitions.


                                                                115
Signatures
Pursuant to the requirements of Section 13 or 15(d) of the Securities Exchange Act of 1934, the Registrant has duly
caused this report to be signed on its behalf by the undersigned, thereunto duly authorized.

                                                 Medco Health Solutions, Inc.


                                                              /s/ David B. Snow, Jr.
                                                         Name: David B. Snow, Jr.
                                                         Title: Chairman and Chief Executive Officer
                                                         Date: February 23, 2010
Pursuant to the requirements of the Securities Exchange Act of 1934, this report has been signed below by the
following persons on behalf of the Registrant and in the capacities and on the dates indicated.


Dated: February 23, 2010                                   /s/ David B. Snow, Jr.
                                                          Name: David B. Snow, Jr.
                                                          Title: Chairman and Chief Executive Officer


Dated: February 23, 2010                                   /s/ Richard J. Rubino, CPA
                                                          Name: Richard J. Rubino, CPA
                                                          Title: Senior Vice President, Finance and Chief
                                                                   Financial Officer


Dated: February 23, 2010                                   /s/ Gabriel R. Cappucci, CPA
                                                          Name: Gabriel R. Cappucci, CPA
                                                          Title: Senior Vice President and Controller, Chief
                                                                  Accounting Officer


Dated: February 23, 2010                                   /s/ Howard W. Barker, Jr., CPA
                                                          Name: Howard W. Barker, Jr., CPA
                                                          Title: Director


Dated: February 23, 2010                                   /s/ John L. Cassis
                                                          Name: John L. Cassis
                                                          Title: Director


Dated: February 23, 2010                                   /s/ Michael Goldstein, CPA
                                                          Name: Michael Goldstein, CPA
                                                          Title: Director


Dated: February 23, 2010                                   /s/ Charles M. Lillis, Ph.D.
                                                          Name: Charles M. Lillis, Ph.D.
                                                          Title: Director


                                                        116
Dated: February 23, 2010     /s/ Myrtle S. Potter
                            Name: Myrtle S. Potter
                            Title: Director


Dated: February 23, 2010     /s/ William L. Roper, M.D., M.P.H.
                            Name: William L. Roper, M.D., M.P.H.
                            Title: Director


Dated: February 23, 2010     /s/ David D. Stevens
                            Name: David D. Stevens
                            Title: Director


Dated: February 23, 2010     /s/ Blenda J. Wilson, Ph.D.
                            Name: Blenda J. Wilson, Ph.D.
                            Title: Director


                           117
(This page intentionally left blank)
INVESTOR INFORMATION


BOARD OF DIRECTORS                                                                                 EXECUTIVE OFFICERS

David B. Snow, Jr.                                William L. Roper, M.D., M.P.H.3, 5               David B. Snow, Jr.                                   Laizer D. Kornwasser
Chairman and Chief Executive Officer,             Dean of the School of Medicine at the            Chairman and                                         President,
Medco Health Solutions, Inc.                      University of North Carolina (UNC),              Chief Executive Officer                              Liberty Medical and
                                                  Vice Chancellor for Medical Affairs,                                                                  Senior Vice President,
Howard W. Barker, Jr., CPA1,2,4                   and Chief Executive Officer,                     Kenneth O. Klepper                                   Channel and Generic Strategy
Partner (Retired), KPMG LLP                       UNC Health Care System                           President and
                                                                                                   Chief Operating Officer                              Thomas M. Moriarty
John L. Cassis1,2,4                               David D. Stevens1, 4, 5                                                                               General Counsel, Secretary and
Partner, Cross Atlantic Partners, Inc.            Private investor and former Chairman             Gabriel R. Cappucci, CPA                             Senior Vice President,
                                                  and Chief Executive Officer,                     Senior Vice President and Controller,                Pharmaceutical Strategies and
Michael Goldstein, CPA1,3,4                       Accredo Health, Incorporated                     Chief Accounting Officer                             Solutions
Former Chairman and Chief Executive
                                                                                                                                                        Karin V. Princivalle
Officer, Toys “R” Us                              Blenda J. Wilson, Ph.D.3, 5                      Mary T. Daschner
                                                                                                                                                        Senior Vice President,
                                                  Consultant and former President,                 Group President,
                                                                                                                                                        Human Resources
Charles M. Lillis, Ph.D.2,4                       Nellie Mae Education Foundation                  Retiree Solutions
Managing Partner,                                                                                                                                       Richard J. Rubino, CPA
                                                  1
LoneTree Capital Management LLC and                   Audit Committee                              John P. Driscoll                                     Senior Vice President, Finance
former Chairman and Chief Executive                   (Howard W. Barker, Jr., CPA, Chairman)       President,                                           and Chief Financial Officer
Officer, MediaOne Group, Inc.                     2
                                                                                                   New Markets
                                                      Compensation Committee
                                                      (John L. Cassis, Chairman)                                                                        Jack A. Smith
                2, 5
Myrtle Potter                                                                                      Robert S. Epstein, M.D., M.S.                        Senior Vice President,
Consultant and former                             3
                                                      Corporate Governance and                     Chief Medical Officer and                            Chief Marketing Officer
Chief Operating Officer,                              Nominating Committee                         President, Medco Research Institute
Genentech, Inc.                                       (Michael Goldstein, CPA, Chairman)                                                                Glenn C. Taylor
                                                                                                   Steven R. Fitzpatrick                                Group President,
                                                  4
                                                      Mergers and Acquisitions Committee           President, Accredo Health Group, Inc.                Key Accounts
                                                  5
                                                      Public Policy Committee (William L. Roper,
                                                                                                   Brian T. Griffin                                     Timothy C. Wentworth
                                                      Chairman)                                                                                         Group President,
                                                                                                   Group President,
                                                                                                   Health Plans                                         Employer Accounts


On June 17, 2009, David B. Snow, Jr., Chairman and Chief Executive Officer, submitted to the NYSE the Written Affirmation required by the rules of the NYSE certifying that he was not aware of any
violations by Medco of NYSE Corporate Governance listing standards.

The certifications of Mr. Snow and Mr. Rubino, Senior Vice President, Finance and Chief Financial Officer, made pursuant to Section 302 of the Sarbanes-Oxley Act of 2002 regarding the quality of
Medco’s public disclosure, have been filed as exhibits to Medco’s Annual Report on Form 10-K for the fiscal year ended December 26, 2009.


                                                                                                                                                 SHAREHOLDER INFORMATION

Transfer Agent and Registrar                                       Corporate Headquarters                                          Independent Registered Public Accounting Firm
Wells Fargo Shareowner Services                                    Medco Health Solutions, Inc.                                    PricewaterhouseCoopers LLP
P.O. Box 64874                                                     100 Parsons Pond Drive                                          Florham Park, NJ 07932
St. Paul, MN 55164-0874                                            Franklin Lakes, NJ 07417-2603
1 866 808-8310                                                     1 201 269-3400                                                  Shareholder Information
1 651 554-3957 (Outside the United States)                         www.medcohealth.com                                             Medco’s Corporate Governance Guidelines; Standards
1 651 450-4144 (Hearing-Impaired TDD Phone)                                                                                        of Business Conduct; Code of Conduct; Conflict of
www.wellsfargo.com/shareownerservices                              Common Stock                                                    Interest; Safety, Health and Environmental Policy;
                                                                   Medco’s common stock is listed on the New York                  Audit, Compensation, Corporate Governance and
Investor Inquiries                                                 Stock Exchange under the ticker symbol MHS.                     Nominating and Public Policy Committee charters;
1 866 MHS-NEWS (1 866 647-6397)                                    On March 12, 2010, the closing market price of our              and the reports and registration statements it files
1 678 999-4574 (Outside the United States)                         common stock on the NYSE was $64.70 and there                   with the Securities and Exchange Commission are
investor_relations@medco.com                                       were 78,417 shareholders of record.                             posted on Medco’s website at
                                                                                                                                   www.medcohealth.com/investor. Shareholders may
Annual Meeting                                                     Dividends                                                       receive, free of charge, printed copies of these
Medco’s 2010 Annual Meeting of                                     Medco currently does not pay dividends and does                 documents, including Medco’s 2009 Annual Report on
Shareholders will be held on May 12, 2010,                         not plan to pay dividends in the foreseeable future.            Form 10-K, by contacting Medco Health Solutions, Inc.,
at 9:00 a.m. at the Park Ridge Marriott,                                                                                           100 Parsons Pond Drive, Franklin Lakes, NJ 07417-2603,
Park Ridge, NJ.                                                                                                                    Attention: Investor Relations.

All rights in the product names, trade names, or logos of all third-party products appearing in this annual report, whether or not appearing with the trademark symbol,
belong exclusively to their respective owners.
www.medco.com


To minimize our environmental impact, this annual report
                                                       t
was printed on paper with 10 percent post-consumer fiber,
which accounted for the following savings:
• 26 trees were not harvested
• 8 million BTUs of energy (the equivalent of operating one
  home for 1 month) were saved
• 2,400 pounds of carbon dioxide (the equivalent of driving an
  average car for 82 days) were not released into the atmosphere
• 11,800 gallons of water were not used

The f
    facility printing the report purchases 100 percent renewable,
Green-
Green-e certified wind energy and is a Leadership Club
member of the EPA Green Power Partnership.


Medco and Medco Therapeutic Resource Centers are registered trademarks and Making Medicine Smarter, Medco Making Medicine Smarter, Medco
          Medc                                                                                                                        Medco
Pharmacy, Medc Health Store, Medco Foundation, Medco Research Institute, and Genetics for Generics are trademarks of Medco Health Solutions, Inc.
          Medco                                                                                                                            ,

© 2010 Medco Health Solutions, Inc. All rights reserved.
       Medco        Solutions, Inc.

Medco health solution report

  • 1.
    2009 ANNUAL REPORT MEDCOHEALTH SOLUTIONS, INC. TM It’s what we do. It’s who we are. It’s in our DNA. .
  • 2.
    DELIVERING SMARTER MEDICINE MANAGING THROUGH THE MEDCO PHARMACY TM SMARTER MEDICINE THROUGH THE MEDCO PBM SHARING SMARTER MEDICINE THROUGH THE ADVANCING MEDCO FOUNDATION TM SMARTER MEDICINE THROUGH THE MEDCO RESEARCH INSTITUTE TM Cover: Rakhee Patel, R.Ph. Medco Cardiovascular Specialist Pharmacist Access to Medco’s prescription and evidence-based protocol information systems helps Rakhee drive better health outcomes by educating members about the importance of medication adherence.
  • 3.
    WE’RE MAKING MEDICINESMARTER At Medco, innovation, precision, and advocacy are in our DNA. We strive to make all of medicine smarter and, as a result, make healthcare better.
  • 4.
    2 0 09 A N N UA L R E PO RT David B. Snow, Jr. Chairman & Chief Executive Officer DEAR SHAREHOLDERS, CLIENTS, MEMBERS, AND EMPLOYEES: Making medicine smarter is more than a theme for an Record cash flows from operations of $3.5 billion, annual report. It’s our calling. up 114.1 percent Record Specialty Pharmacy revenues of over It describes the value that nearly 23,000 Medco $9.5 billion, up 19.5 percent people are committed to delivering every day for the Record generic dispensing rate of 67.5 percent, benefit of our clients and members. up 3.4 percentage points It’s leveraging the power of advanced pharmacy to Record adjusted prescription volume of redefine the standards of clinical excellence as we 898.8 million, up 12.9 percent drive down overall healthcare costs. Beyond this exceptional performance in 2009, and despite the ongoing global economic uncertainty, our It’s also the reason why, since 2008, we’ve won more ability to deliver value-driven solutions to our clients than $21 billion in new business and exceeded and members gives us the confidence to continue to virtually every metric used to gauge our success. expect strong earnings growth into the future. We’ve also delivered value to our shareholders as We will remain vigilant around expense control and Medco stock reached a series of new all-time highs continue to re-architect our organization for greater throughout 2009—appreciating more than 436 speed and agility, even as we add millions of lives to percent since we became an independent public our book of business. company a little more than 6 years ago. Our transformation into a clinically focused It’s my privilege to share the highlights of our pharmacy leader has made us a winner in the full-year 2009 performance: marketplace and a key partner with our clients, Record 2009 annualized new-named sales of helping them to drive total healthcare costs lower. over $10.0 billion Medco’s influence has extended beyond our Record net-new sales of over $8.0 billion industry. Last year Forbes named Medco to its 100 Record net revenues of $59.8 billion, up 16.7 percent “Most Trustworthy” list; and for the third consecutive Record GAAP diluted EPS of $2.61, up 22.5 percent year, Fortune listed Medco as among the world’s “Most Admired” companies. Record EBITDA of over $2.75 billion, up 11.8 percent 2. |
  • 5.
    M E DC O H E A LT H S O L U T I O N S , I N C . NARROWING THE CLINICAL GAP With real-time prescription drug and integrated medical databases, and guided by nationally Medco’s focus is innovation. Our investments in accepted, evidence-based protocols, the building a protocol-driven, evidence-based pharmacy Medco Pharmacy™closed more than 1.5 million practice to address the needs of patients with chronic gaps in clinical care in 2009, representing a projected and complex conditions—and our ability to document $700 million in total healthcare cost savings. and publish our results—have revealed the clinical As a result of our technologically advanced quality gap that extends the Medco advantage pharmacy environment and use of Six Sigma® compared to other PBMs and traditional pharmacies. techniques, Medco measures virtually every aspect When we trained more than one thousand Medco of pharmacy-related care and treatment, allowing Specialist Pharmacists and organized them into for continuous improvement. This wired Medco Therapeutic Resource Centers®, each focused environment creates efficiencies and visibility, which on handling a specific condition, such as diabetes or are at the heart of driving meaningful healthcare cardiovascular disease, we developed the clinical reform—delivering better health outcomes, while at capacity to identify and correct medication-related the same time lowering costs. issues for millions of higher-risk, higher-cost patients. Six of our 15 Therapeutic Resource Centers represent some of the largest patient practices of their kind in the United States—with 5 million patients under treatment for diabetes, more than 10 million patients under care for neurological and psychiatric conditions, and 11 million being treated for cardiovascular issues. CLOSING 1.5M GAPS IN CARE $700M PROJECTED HEALTHCARE SAVINGS Rahul Purohit, R.Ph. Medco Cardiovascular Specialist Pharmacist | 3.
  • 6.
    2 0 09 A N N UA L R E PO RT SMARTER MEDICINE MAKES A While an averted cardiovascular event could save a MEANINGFUL DIFFERENCE client $20,000 or more in hospital costs, this clinical quality gap in care is not just about lowering costs— Our work as a clinical trailblazer is already changing for members, it could save a life. the way medicine is practiced and delivered in the United States. Late last year, Medco and one of our clients launched what we believe will become the most far-reaching As just one example in a growing compendium, late in experimental partnership of its kind—uniting our 2008 Medco research reported a correlation between advanced pharmacy with local community-based the use of certain heartburn medicines in tandem with pharmacies in a coordinated and wired initiative to the widely used anticlotting agent, Plavix® (clopidogrel close medication-related gaps in healthcare. This pilot bisulfate). This often-prescribed combination project is designed to determine the effectiveness of counteracts the protective effects of Plavix and is training community pharmacists who have access to associated with a greater than 50 percent higher risk of Medco data to identify issues and provide interventions heart attack, stroke, and other negative cardiovascular to help improve the health of patients with chronic events. Following this report and the work of other and complex conditions, and lowering their cost of investigators, the Food and Drug Administration (FDA) care. If successful, this program could redefine the revised the Plavix product information and retail pharmacy practice paradigm. subsequently issued a public health advisory warning consumers of the potentially dangerous interaction To help accelerate the transfer of critical knowledge from between Plavix and certain heartburn medicines, research discovery to mainstream medical practice, including some over-the-counter versions. we have formed the Medco Research Institute™. This new Medco subsidiary will coordinate, extend, PROOF TO Based on these findings, Medco and amplify our internal genomics research PRACTICE IN quickly placed safety warnings in 12 MONTHS initiatives and further the growing number of its system to alert pharmacists collaborations with institutions and organizations, and physicians to the potential 33% danger. In 12 months, and to the REDUCTION IN benefit of our clients, this resulted such as the Mayo Clinic, LabCorp, Harvard University, Indiana University School of Medicine, and the FDA, A POTENTIALLY among other leading research institutions, in DANGEROUS in a 33 percent reduction in the addition to forging new relationships as we create INTERACTION dispensing of these medicines, in catalysts for discovery and innovation. combination, for patients using the Medco Pharmacy. For the safety of all members, we are working to help retail pharmacies achieve the same high standards set by the Medco Pharmacy. 4. |
  • 7.
    M E DC O H E A LT H S O L U T I O N S , I N C . EXTENDING OUR REACH; In the United Kingdom, we announced a joint ACCELERATING OUR GROWTH venture to offer quality in-home care to specialty pharmacy patients served by the National Health By improving generic and mail-order dispensing Service (NHS), enabling greater independence and rates for our current clients and members, we could reducing cost pressures on the public health system. maintain healthy growth even if we never added a single new member. However, in addition to record In Germany, we extended our market presence with new business and earning a greater share of wallet the acquisition of shop-apotheke.com, a leading across our book of business, we are pursuing website for healthcare and over-the-counter products. opportunities that move far beyond the current This adds channel depth to our existing prescription boundaries of the historical PBM. drug and specialty subsidiary, Europa Apotheek Venlo. In mid-2009, we launched the Medco Health Store™, In Sweden, the first nationwide wired safety net extending the drug utilization review safety protections providing drug utilization review (DUR)—developed that have been a mainstay for prescription medicines through a Medco joint partnership with the to cover the growing number of nonprescription government of Sweden—was deployed to protect medicines, vitamins, and dietary supplements. patients from harmful drug interactions. Offering more than 22,000 healthcare products, We also asserted our pioneering leadership in organized by therapeutic condition, the Medco pharmacogenomics—the science of personalized Health Store complements the prescription-based medicine—enrolling more than 200 clients, services we provide patients through our representing nearly 8 million lives, in our growing Therapeutic Resource Centers. The store has quickly portfolio of gene-based testing programs. surpassed 1 million registered users. Our research It’s estimated that nearly one in four Medco patients demonstrates that Medco members find compelling currently takes a drug with gene-based indications listed value in the store’s combination of safety, within the product labeling. However, a survey we convenience, quality, and affordability. conducted in partnership with the American Medical Medco also furthered its international initiatives— Association revealed that fewer than 25 percent of leveraging our innovation, technologies, and doctors have received education on pharmacogenomics, solutions to transcend geographic, political, and and only half of them feel informed about genetic cultural healthcare conventions in addressing testing. Our extensive series of research initiatives and quality and cost issues abroad. growing slate of published findings are designed to change that; as In Vivo recently noted, “Medco is steadily becoming the go-to organization” for assessing the impact of pharmacogenomic tests on improving patient outcomes. | 5.
  • 8.
    2 0 09 A N N UA L R E PO RT Our capabilities will be enhanced through our recent SMARTER MEDICINE—THE MODEL FOR acquisition of DNA Direct, a leader in providing REAL HEALTHCARE REFORM guidance and decision support to payors, physicians, Healthcare reform has many faces. and patients, on a range of complex issues related to genomic medicine. This will enable us to build a new As the debate in Washington commanded headlines generation of solutions to deliver on the promise of throughout 2009, Medco was actively engaged in what we’re calling “precision medicine.” the process, contributing expertise, sharing research, and advocating for solutions that improve the Our newly launched Genetics for Generics™ initiative will quality of care for patients, reduce costs for payors, help physicians determine whether individual patients and broaden access to all. require expensive branded medicines when they may be best served by proven generic therapies, which are also We also established the Medco Foundation™, a less expensive. This is a critical consideration as new nonprofit organization whose mission is to support branded drugs are soon expected to reach the market activities aimed at educating and informing the as patents expire on some of the world’s most widely general public about health, wellness, and medicine used medicines treating the same conditions. safety issues; providing low-income, disadvantaged, and other distressed populations and communities Most recently, the Medco Research Institute and with access to medicine and information about their Mayo Clinic announced the results of the first care; and fostering and promoting opportunities for national prospective comparative effectiveness study volunteerism and civic engagement through our examining patient outcomes when incorporating corporate social-responsibility programs. genetic testing to the usual management of warfarin, the world’s most prescribed blood thinner. But most importantly, through our focused approach to Hospitalization rates for heart patients taking warfarin the needs of our clients and members, Medco is today dropped by approximately 30 percent when genetic reforming healthcare by pursuing our four-point strategy: information was available to prescribers. This study Managing smarter medicine through the validates that genetic testing to reveal a patient’s Medco PBM unique sensitivity to warfarin can significantly improve Delivering smarter medicine through the the drug’s safety and effectiveness. Medco Pharmacy Advancing smarter medicine through the Consistent with our clinical leadership, Medco has Medco Research Institute put in place the first pharmacogenomics-specific Sharing smarter medicine through the drug utilization rules to provide Medco Foundation alerts that warn when a prescribed medication is It’s not only what we do. It’s who we are. We are Medco. incompatible with a And we are making medicine smarter for our clients patient’s genomic profile based and members every day. on data stored in our HIPAA- compliant secure database. Sincerely, Gene-based prescribing is the technology of the future. Medco is speeding these innovations to mainstream pharmacy practice today. David B. Snow, Jr. Chairman & Chief Executive Officer 6. |
  • 9.
    MEDCO HEALTH SOLUTIONS,INC. FINANCIAL HIGHLIGHTS (In millions, except for per share data) 2009 2008 % Increase/(Decrease) CONSOLIDATED STATEMENT OF INCOME HIGHLIGHTS Total net revenues $ 59,804.2 $ 51,258.0 16.7 % Income before provision for income taxes $ 2,103.3 $ 1,790.8 17.5 % Net income $ 1,280.3 $ 1,102.9 16.1 % Net income per diluted share(a) $ 2.61 $ 2.13 22.5 % CONSOLIDATED BALANCE SHEET HIGHLIGHTS Cash and cash equivalents $ 2,528.2 $ 938.4 169.4 % Working capital(e) $ 1,810.9 $ 1,299.5 39.4% Total assets $ 17,915.5 $ 17,010.9 5.3 % Total debt $ 4,015.9 $ 4,602.9 (12.8 %) NET CASH PROVIDED BY OPERATING ACTIVITIES $ 3,501.4 $ 1,635.1 114.1 % PRESCRIPTION VOLUMES Adjusted prescription volume(d) 898.8 795.9 12.9 % Total prescriptions administered 694.5 586.0 18.5 % Retail 591.4 480.2 23.2 % Mail order 103.1 105.8 (2.6 %) (a) Per share amounts have been retrospectively adjusted for a two-for-one stock split, which was effected in the form of a 100% stock dividend and distributed on January 24, 2008, to shareholders of record at the close of business on January 10, 2008. (b) For a reconciliation of reported net income to EBITDA and a presentation of EBITDA per adjusted prescription, refer to page 58 of Management’s Discussion and Analysis included in our Annual Report on Form 10-K. (c) The consolidated statement of income data for 2006 includes a pre-tax legal settlements charge of $162.6 million recorded in the first quarter of 2006. (d) Adjusted prescription volume equals substantially all mail-order prescriptions multiplied by three, plus retail prescriptions. These mail-order prescriptions are multiplied by three to adjust for the fact that they include approximately three times the amount of product days supplied compared with retail prescriptions. (e) Calculated as current assets less current liabilities. | 7.
  • 10.
    “I’ve always beenproud of the many ways in which Medco and its employees, in times of crisis, have applied the values that are at the core of our organization, along with our pharmacy expertise, to share smarter medicine with those in great need.” David B. Snow, Jr. MEDCO RESPONDS TO THE NATURAL DISASTER IN HAITI Within days after devastating earthquakes destroyed much of Haiti’s capital city, critical medicines valued at more than $5 million and donated through Medco pharmacies were en route to emergency responders. Within weeks, employee contributions, supplemented by a Medco corporate match and totaling more than $400,000, were heading to agencies that were speeding relief to the island. Meantime, Medco pharmacists, doctors, and nurses came forward to volunteer for assignments serving aboard the USNS Comfort, a naval vessel that became the island’s most advanced critical-care facility for earthquake victims.
  • 11.
    UNITED STATES SECURITIES AND EXCHANGE COMMISSION Washington, D.C. 20549 FORM 10-K ANNUAL REPORT PURSUANT TO SECTION 13 OR 15(d) OF THE SECURITIES EXCHANGE ACT OF 1934 For the fiscal year ended December 26, 2009 Commission File Number: 1-31312 MEDCO HEALTH SOLUTIONS, INC. (Exact name of Registrant as specified in its charter) Delaware 22-3461740 (State or other jurisdiction of incorporation) (I.R.S. Employer Identification No.) 100 Parsons Pond Drive, Franklin Lakes, NJ 07417-2603 (Address of principal executive offices) (Zip Code) Registrant’s telephone number, including area code: 201-269-3400 Securities registered pursuant to Section 12(b) of the Act: Title of Each Class Name of Each Exchange on Which Registered Common Stock, par value $0.01 New York Stock Exchange 7.25% Senior Notes Due 2013 New York Stock Exchange 6.125% Senior Notes Due 2013 New York Stock Exchange 7.125% Senior Notes Due 2018 New York Stock Exchange Securities registered pursuant to Section 12(g) of the Act: None Indicate by check mark if the Registrant is a well-known seasoned issuer, as defined in Rule 405 of the Securities Act. Yes ¥ No n Indicate by check mark if the Registrant is not required to file reports pursuant to Section 13 or Section 15(d) of the Exchange Act. Yes n No ¥ Indicate by check mark whether the Registrant: (1) has filed all reports required to be filed by Section 13 or 15(d) of the Securities Exchange Act of 1934 during the preceding 12 months (or for such shorter period that the Registrant was required to file such reports), and (2) has been subject to such filing requirements for the past 90 days. Yes ¥ No n Indicate by check mark whether the Registrant has submitted electronically and posted on its corporate Web site, if any, every Interactive Data File required to be submitted and posted pursuant to Rule 405 of Regulation S-T (§232.405 of this chapter) during the preceding 12 months (or for such shorter period that the Registrant was required to submit and post such files). Yes ¥ No n Indicate by check mark if disclosure of delinquent filers pursuant to Item 405 of Regulation S-K is not contained herein and will not be contained, to the best of Registrant’s knowledge, in definitive proxy or information statements incorporated by reference in Part III of this Form 10-K or any amendment to this Form 10-K. n Indicate by check mark whether the Registrant is a large accelerated filer, an accelerated filer, a non-accelerated filer, or a smaller reporting company. See the definitions of “large accelerated filer,” “accelerated filer” and “smaller reporting company” in Rule 12b-2 of the Exchange Act. Large accelerated filer ¥ Accelerated filer n Non-Accelerated filer n Smaller reporting company n Indicate by check mark whether the Registrant is a shell company (as defined in Rule 12b-2 of the Exchange Act). Yes n No ¥ The aggregate market value of the Registrant’s voting stock held by non-affiliates as of June 27, 2009 was $21,559,406,368. The Registrant has no non-voting common equity. As of February 17, 2010, the Registrant had 464,060,676 shares of common stock outstanding. DOCUMENTS INCORPORATED BY REFERENCE Portions of Medco Health Solutions, Inc.’s Proxy Statement for its 2010 Annual Meeting of Shareholders are incorporated by reference in this Annual Report on Form 10-K in response to Part III (Items 10 through 14).
  • 12.
    MEDCO HEALTH SOLUTIONS,INC. ANNUAL REPORT ON FORM 10-K TABLE OF CONTENTS Form 10-K Item Number: Page No. PART I Item 1. Business. . . . . . . . . . . . . . . . . . . . . . . . . . . . . . . . . . . . . . . . . . . . . . . . . . . . . . . . . . . . . . . . 1 Item 1A. Risk Factors . . . . . . . . . . . . . . . . . . . . . . . . . . . . . . . . . . . . . . . . . . . . . . . . . . . . . . . . . . . . . 21 Item 1B. Unresolved Staff Comments . . . . . . . . . . . . . . . . . . . . . . . . . . . . . . . . . . . . . . . . . . . . . . . . . 29 Item 2. Properties . . . . . . . . . . . . . . . . . . . . . . . . . . . . . . . . . . . . . . . . . . . . . . . . . . . . . . . . . . . . . . . 29 Item 3. Legal Proceedings . . . . . . . . . . . . . . . . . . . . . . . . . . . . . . . . . . . . . . . . . . . . . . . . . . . . . . . . 29 Item 4. Submission of Matters to a Vote of Security Holders . . . . . . . . . . . . . . . . . . . . . . . . . . . . . . . 29 Executive Officers of the Company . . . . . . . . . . . . . . . . . . . . . . . . . . . . . . . . . . . . . . . . . . . . 29 PART II Item 5. Market for Registrant’s Common Equity, Related Shareholder Matters and Issuer Purchases of Equity Securities . . . . . . . . . . . . . . . . . . . . . . . . . . . . . . . . . . . . . . . . . . . . . . . . . . . . . . . 33 Item 6. Selected Financial Data . . . . . . . . . . . . . . . . . . . . . . . . . . . . . . . . . . . . . . . . . . . . . . . . . . . . 36 Item 7. Management’s Discussion and Analysis of Financial Condition and Results of Operations . . . 39 Item 7A. Quantitative and Qualitative Disclosures About Market Risk . . . . . . . . . . . . . . . . . . . . . . . . . 69 Item 8. Financial Statements and Supplementary Data . . . . . . . . . . . . . . . . . . . . . . . . . . . . . . . . . . . . 69 Item 9. Changes in and Disagreements with Accountants on Accounting and Financial Disclosure . . . 107 Item 9A. Controls and Procedures . . . . . . . . . . . . . . . . . . . . . . . . . . . . . . . . . . . . . . . . . . . . . . . . . . . . 107 Item 9B. Other Information. . . . . . . . . . . . . . . . . . . . . . . . . . . . . . . . . . . . . . . . . . . . . . . . . . . . . . . . . 107 PART III Item 10. Directors, Executive Officers and Corporate Governance . . . . . . . . . . . . . . . . . . . . . . . . . . . . 108 Item 11. Executive Compensation . . . . . . . . . . . . . . . . . . . . . . . . . . . . . . . . . . . . . . . . . . . . . . . . . . . . 108 Item 12. Security Ownership of Certain Beneficial Owners and Management and Related Shareholder Matters . . . . . . . . . . . . . . . . . . . . . . . . . . . . . . . . . . . . . . . . . . . . . . . . . . . . . . . . . . . . . . . . 108 Item 13. Certain Relationships and Related Transactions, and Director Independence . . . . . . . . . . . . . . 110 Item 14. Principal Accounting Fees and Services . . . . . . . . . . . . . . . . . . . . . . . . . . . . . . . . . . . . . . . . 110 PART IV Item 15. Exhibits, Financial Statement Schedules . . . . . . . . . . . . . . . . . . . . . . . . . . . . . . . . . . . . . . . . 111 Signatures . . . . . . . . . . . . . . . . . . . . . . . . . . . . . . . . . . . . . . . . . . . . . . . . . . . . . . . . . . . . . . . . . . . . . . . 116
  • 13.
    PART I Item 1. Business. Overview We are a leading healthcare company that is pioneering the world’s most advanced pharmacy» and our clinical research and innovations are part of Medco making medicine smarterTM for approximately 65 million members. Medco provides clinically-driven pharmacy services designed to improve the quality of care and lower total healthcare costs for private and public employers, health plans, labor unions and government agencies of all sizes, and for individuals served by Medicare Part D Prescription Drug Plans. Our unique Medco Therapeutic Resource Centers», which conduct therapy management programs using Medco specialist pharmacists who have expertise in the medications used to treat certain chronic conditions, and Accredo Health Group, Medco’s Specialty Pharmacy, represent innovative models for the care of patients with chronic and complex conditions. Our business model requires collaboration with retail pharmacies, physicians, the Centers for Medicare & Medicaid Services (“CMS”) for Medicare, pharmaceutical manufacturers and, particularly in Specialty Pharmacy, collaboration with state Medicaid agencies, and other third-party payors such as health insurers. Our programs and services help control the cost and enhance the quality of prescription drug benefits. We accomplish this by providing pharmacy benefit management (“PBM”) services through our national networks of retail pharmacies and our own mail-order pharmacies, as well as through Accredo Health Group, which we believe is the nation’s largest specialty pharmacy based on revenues. Medco’s Therapeutic Resource Center focused on diabetes was augmented with the 2007 acquisition of PolyMedica Corporation (“PolyMedica”), through which we believe we became the largest diabetes pharmacy care practice based on covered patients. In 2008, we also extended our capabilities abroad when we acquired a majority interest in Europa Apotheek Venlo B.V. (“Europa Apotheek”), a privately held company based in the Netherlands that primarily provides mail-order pharmacy services in Germany. See Note 3, “Acquisi- tions of Businesses,” to our audited consolidated financial statements included in Part II, Item 8 of this Annual Report on Form 10-K for more information. In 2009, Medco advanced its European healthcare initiatives through a joint venture with United Drug plc, a pan-European healthcare leader, to provide home-based specialty pharmacy care services in the United Kingdom for patients covered by the country’s National Health Service. Additionally, our commitment to advancing the science of personalized medicine is further demonstrated by our January 2010 acquisition of DNA Direct, Inc., a leader in providing guidance and decision support to payors, physicians and patients, on a range of complex issues related to genomic medicine. Our clients are generally entities that provide prescription drug benefits to their underlying membership, such as members of their benefit plans or their employees. We operate in a competitive environment as clients and other payors seek to control the growth in the cost of providing prescription drug benefits and leverage prescription drug therapy to lower overall medical costs. Our business model is designed to reduce the level of drug cost increase, also known as drug trend, but also to close gaps in pharmacy care to improve patient health and reduce total medical spending levels. We do this primarily through programs that: maximize the substitution rate of expensive brand- name drugs for lower-cost clinically equivalent generic drugs; drive competitive discounts from brand-name and generic drug pharmaceutical manufacturers, including rebates from brand-name pharmaceutical manufacturers; secure discounts from retail pharmacies; and apply our sophisticated service innovations and efficiently administer prescription dispensing through our mail-order pharmacies. Traditional prescription drug programs include the dispensing of pills primarily in capsule or tablet form. These medicines are produced by brand-name and generic pharmaceutical manufacturers, and are not as complicated to dispense or administer as specialty products. Specialty pharmacy drugs are generally manufactured by biopharma- ceutical or biotechnology companies and tend to be more expensive than traditional medicines and can cost as much as several hundred thousand dollars per patient per year. These specialty drugs are often infusible or injectable and require special handling, temperature control and ancillary equipment, as well as a higher level of individualized patient care as compared to traditional medicines. Disease states treated by specialty drugs, including for example hemophilia and autoimmune disorders, are often the most complex to manage. 1
  • 14.
    The advanced technologieswe have developed are instrumental to our ability to drive growth, improve service and reduce costs. Our technology platform is designed to seamlessly integrate prescription management at both mail order and retail with our client and member services. The cornerstone of our mail-order pharmacy technology is our single networked information technology platform, which connects prescription ordering functions at our prescription order processing pharmacies with our state-of-the-art automated dispensing pharmacies in Willingboro, New Jersey and Las Vegas, Nevada, and our soon to be connected third automated dispensing pharmacy in Whitestown, Indiana, which is expected to be operational in 2010. At our call center pharmacies and our work-at-home locations, our experienced customer service representatives and consulting pharmacists use advanced technology to speed service and provide members with specialized prescription and health information. Our Internet and integrated voice- response phone technologies allow members to easily and quickly manage their prescription drug benefits. These technologies also allow members to enroll in mail-order pharmacy service, submit a refill or renewal mail-order prescription for processing, track the status of a mail-order prescription, price a medication and locate in-network retail pharmacies in their area, along with other features. Our proprietary Internet-based solutions improve client and member service by facilitating prescription ordering and by providing important healthcare information. We support distinct websites for clients, members, physicians and pharmacists that provide critical benefit information and interactive tools aimed at helping members to take their medications as prescribed, to use lower cost drugs and to simplify benefit administration. Advanced imaging technology enables service representatives to access an online image of a member’s prescription to address a member’s needs more efficiently. Our data center links our mail-order pharmacy operations, including our call center pharmacies and work-at-home sites, our websites, and the retail pharmacies in our networks. The data center enables us to efficiently receive, process and administer claims, and dispense prescription drugs with speed and accuracy in a secure environment. It also allows us to easily detect potential adverse drug events and alert the patients and prescribing physicians of potentially harmful drug interactions. We also have reliability, change management and implementation programs that help drive excellence in execution across our operations, reducing our time to market with new capabilities and increasing our ability to implement timely, error- free updates and deliver client-oriented solutions. Our innovative and flexible programs and services have enabled us to deliver effective drug trend management for our clients and offer a portfolio of initiatives designed to improve the quality of care for members. Our services focus on: • Offering the cost-saving and clinical advantages of mail order to our clients. Our clients realize lower overall drug costs as a result of operating efficiencies derived from our high degree of automation, the value from our scale in purchasing drugs at competitive discounts, and our ability to offer up to a 90-day supply of medicine at mail compared to a 30-day supply for most retail programs. Members benefit from the convenience of mail order, the extended supply, and generally lower co-payments. • Actively identifying opportunities to increase the use of lower-cost generic drugs as alternatives to brand- name medicines. • Offering a broad base of specialty medicines at competitive prices, and with a comprehensive service model designed to ensure patient safety, product integrity, and proper drug administration. • Enhancing formulary compliance through physician, client and member communications and education programs, including therapeutic brand-to-“preferred-brand” interchange programs. The use of multi-tiered co-payment and other cost-sharing payment structures, and the increased use of mail order further enhance formulary compliance. In addition, our Internet-based tool called My Rx Choices» provides members with a simplified and personalized menu of medication choices, including generics and preferred brand-name medications, based upon their personal drug benefit coverage. Higher levels of formulary compliance, combined with our purchasing scale, allow us to generate higher rebates on a per-prescription basis from brand-name pharmaceutical manufacturers. Most of the value of these rebates is currently shared with our clients, which helps us manage their drug trend. 2
  • 15.
    • Providing highquality clinical care to members with chronic and complex conditions through access to Medco specialist pharmacists, housed in Medco Therapeutic Resource Centers» who have expertise in the medications used to treat certain chronic conditions. Our advanced clinical services benefit our members from an overall healthcare management perspective, and also assist them in making educated decisions regarding their prescription healthcare and associated costs. • Providing customized plan design. We offer ongoing consulting services and model clinical and financial outcomes for clients based on a broad range of plan design and formulary choices. Our advanced information technologies allow our professionals to design with clients the plan structure that best meets the clients’ benefit cost objectives while providing an optimized benefit to members of the clients’ plans. These include EXPERxT Advisor», an automated tool that provides real-time plan design modeling capability for our clients, as well as RationalMed», through which medical data is integrated to support better overall health outcomes for members. Recognizing the diverse plan design and administrative needs of different payors, our account teams are organized by industry-specific customer groups designed to ensure we provide customized solutions that satisfy the distinctive needs of our clients and their respective membership. • Providing a flexible array of Medicare Part D Prescription Drug Program (“Medicare Part D”) products to our clients and to individual Medicare-eligible consumers nationwide that: support their unique Prescription Drug Program (“PDP”) and facilitate benefits under a federal subsidy of traditional retiree programs, or through Medco’s own PDP offerings. • Effectively managing drug utilization, a key factor in reducing drug trend, through a wide range of trend management tools, including drug utilization review programs and rules governing the conditions under which drugs are covered, according to the requirements established by our clients. We also offer clinically based programs that identify waste related to particular categories of questionable drug claims representing unnecessary prescription use and potential abuse. In 2009, we administered 695 million prescriptions; recorded net revenues of $59.8 billion and net income of $1.3 billion; and reported earnings before interest income/expense, taxes, depreciation and amortization, or EBITDA, of nearly $2.8 billion. See Part II, Item 6, “Selected Financial Data,” for a definition and calculation of EBITDA and EBITDA per adjusted prescription. Our net income is driven by our ability to generate favorable discounts on generic prescription drugs dispensed from our mail-order pharmacies; earn discounts and rebates on brand-name drugs; negotiate competitive client pricing, including rebate sharing terms, administrative fees and price discounts, as well as negotiate favorable retail pharmacy reimbursement rates; provide competitively priced specialty pharmacy products and services; and deliver innovative services in a cost-efficient manner. Business segment information and geographic financial information is set forth in Part II, Items 7, 7A and 8 (Note 13, “Segment and Geographic Data” to our audited consolidated financial statements included in Part II, Item 8 of this Annual Report on Form 10-K) of this Annual Report on Form 10-K. When we use “Medco,” “we,” “us” and “our,” we mean Medco Health Solutions, Inc., a Delaware corporation, and its consolidated subsidiaries. When we use the term “mail order,” we mean inventory dispensed through Medco’s mail-order pharmacy operations. 3
  • 16.
    Special Note AboutForward-Looking Statements We have made forward-looking statements in this Annual Report on Form 10-K, including in the sections entitled “Business,” “Risk Factors,” “Legal Proceedings,” “Management’s Discussion and Analysis of Financial Condition and Results of Operations,” and “Quantitative and Qualitative Disclosures about Market Risk,” that are based on our management’s beliefs and assumptions and on information currently available to our management. Forward-looking statements are not historical facts, but rather are based on current expectations, estimates, assumptions and projections about the business and future financial results of the PBM and specialty pharmacy industries, and other legal, regulatory and economic developments. Forward-looking statements include, among others, information concerning our possible or assumed future results of operations, business strategies, financing plans, competitive position, potential growth opportunities, potential operating performance improvements, the effects of competition, and the effects of future legislation or regulations. We use words such as “anticipates,” “believes,” “plans,” “expects,” “projects,” “future,” “intends,” “may,” “will,” “should,” “could,” “estimates,” “pre- dicts,” “potential,” “continue” and similar expressions to identify these forward-looking statements. Forward-looking statements involve risks, uncertainties, and assumptions. Actual results may differ materially from those expressed in these forward-looking statements. You should not put undue reliance on any forward- looking statements. We do not have any intention or obligation to update forward-looking statements after we file this report except as required by law. The risk factors discussed in “Risk Factors” and other risks identified in the Annual Report on Form 10-K could cause our actual results to differ materially from those expressed in forward-looking statements. There may be other risks and uncertainties that we are unable to predict at this time or that we currently do not expect to have a material adverse effect on our business. Industry Overview PBMs emerged in the 1980s, primarily to provide cost-effective drug distribution and claims processing for the healthcare industry. The PBM industry further evolved in response to the significant escalation of healthcare costs in the 1990s, as benefit plan sponsors sought to more aggressively contain costs. PBMs developed strategies to effectively influence both supply and demand. On the supply side, PBMs leverage their buying power to negotiate purchase discounts and rebates from manufacturers, and discounts from distributors and retail pharmacies. On the demand side, PBMs educate clients, members and physicians on cost-effective prescription medications and apply various techniques to encourage members to make cost-effective choices, such as the use of less expensive generic drugs and the more efficient mail-order channel. Generic substitution for drugs on which patents have expired is a significant and growing factor in reducing costs. Business Strategy Medco’s strategy for continued success and profitability includes the following key growth drivers and other business initiatives: Key Growth Drivers • Generics: Optimizing the value of generics in light of significant brand-name patent expirations expected over the next several years, and continued development of programs designed to further reduce the cost of prescription healthcare. • Mail Order: Maximizing the mail-order prescription opportunity for chronic and complex disease through enhanced communication and plan design. 4
  • 17.
    • Specialty Pharmacy:Expanding our specialty pharmacy model by providing new and creative services that reduce drug cost, simplify the administrative process and further enhance patient safety and convenience, including home-based and ambulatory specialty infusion services. • New Business and Renewals: Retaining existing clients and winning new clients by providing quality service, engaging members, leveraging technology and delivering new products and services, all of which deliver value to our clients and members and are critical to our business strategy. • Clinical Innovation: Executing a next-generation clinical strategy that is designed to establish a new benchmark for pharmacy healthcare by engaging members and modeling behaviors to improve clinical outcomes and reduce costs. In 2007, we re-engineered our pharmacy model around Medco Therapeutic Resource Centers». Through these centers, Medco specialist pharmacists — who have expertise in the medications used to treat certain chronic conditions — help achieve better clinical outcomes for patients with chronic and complex conditions by closing gaps in care. • Solutions for Seniors: Developing innovative and flexible approaches that assist our health plan and employer clients in successfully managing a range of opportunities available to seniors through Medicare Part D and other retiree programs. • Pioneering Research: Pharmacogenomics represents an opportunity to enhance our clinical programs by identifying a patient’s genetic profile through laboratory testing, which guides prescribing physicians to more accurately and quickly select the best medicine and the most appropriate dose optimized to an individual’s unique genotype, improving health outcomes and reducing overall healthcare costs. Through our acquisition of PolyMedica, we acquired CLIA (Clinical Laboratory Improvement Amendments) — certified laboratory capabilities and we have established collaborations with various organizations, including the Mayo Clinic, LabCorp, Harvard University, Indiana University School of Medicine and the FDA (Food and Drug Administration), and have been independently recognized for our research as a leader in pharmacoge- nomics. In addition, in 2009 we established the Medco Research InstituteTM, a new subsidiary that will coordinate, extend and amplify Medco’s research initiatives. Other Business Initiatives • New Products and Markets: Making acquisitions, forming strategic alliances, and expanding into comple- mentary adjacent markets. In March 2008, we launched a collaboration with Sweden’s government-operated retail pharmacy authority, Apoteket, to develop and test the first automated electronic prescription review system to improve clinical and financial outcomes for Swedish patients and the country’s healthcare system. In April 2008, we acquired a majority interest in Europa Apotheek, a privately held company based in the Netherlands, which primarily provides mail-order pharmacy services in Germany. In 2009, we formed a joint venture with United Drug plc, a pan-European healthcare leader, to provide home-based pharmacy care services in the United Kingdom for patients covered by the country’s National Health Service. We believe these ventures leverage our proven proprietary technologies and ability to deliver customized solutions to meet the unique challenges of managing healthcare costs and improving clinical care abroad — transcending geography, political structures, and systemic healthcare structures. • Medco Health StoreTM: Providing a virtual channel for patients to purchase non-prescription products online, substantially extending our service with the convenience of mail delivery, while addressing the increasing safety concerns related to interactions between prescription and over-the-counter drugs, vitamins and supplements. • Financial Strategy: Delivering earnings growth and building shareholder value through a series of strategies, including: disciplined selling, general and administrative expense control; accelerating cash flow generation; managing debt levels; driving improvements in return on invested capital; and share repurchases. 5
  • 18.
    In order forour strategy to be successful, we must anticipate and respond to both the common and unique needs of our clients and other payors, and we must continue to deliver scalable yet flexible capabilities and solutions that are affordable for payors and profitable for us. This includes delivering high-quality client and member service; leveraging our significant technology investments to drive growth; reducing costs; actively pursuing sources of growth from new clients and increasing our clients’ use of our value-added services, including our mail-order pharmacies. We believe we have unique clinical and technological competitive advantages that enable us to deliver enhanced services to clients and members, and effectively manage drug trend, ultimately reducing the total cost of healthcare. These advantages include our specialized Therapeutic Resource Centers; our automated mail-order pharmacy capability; our specialty pharmacy; our investments in other systems technologies including the Internet; our extensive value-added programs and services offerings; our ability to generate significant discounts and rebates that translate into client and member savings; and the cost-saving potential from our comprehensive generic substitution programs. See “—Competition” below for a description of competition in the PBM industry. Products and Services To support our efforts to control prescription drug costs for our clients while supporting the appropriate use of prescription drugs, we offer a wide range of programs and services that help manage the cost, improve the quality and streamline the administration procedures for traditional and specialty drugs. Plan Design Our client teams take a consultative approach to assisting clients in the development and implementation of plan designs that suit their specific needs. Each client has access to the skills of various Medco professionals, including experienced clinical, financial and information technology specialists. Each client’s success in achieving the business objectives of their specific pharmacy benefit strategy ultimately depends on the design of their benefit plan. These customized plan designs take into account formulary structure, retail pharmacy management, mail-order initiatives, specialty pharmacy, drug coverage and exclusion, cost-share options, and generic drug utilization initiatives. Integrating Medicare Part D considerations into plan designs is increasingly important to clients with Medicare- eligible members. We support clients by managing several options they may select from: the Retiree Drug Subsidy program, which is offered by CMS to reimburse municipalities, unions and private employers for a portion of their eligible expenses for retiree prescription drug benefits; the Medco Employer Group Waiver Plan, a group-enrolled Medicare Part D option for employers and labor groups; as well as serving as the “PBM inside” for a number of Medicare Part D sponsors that offer drug-only and integrated medical and Medicare Part D drug benefits. Medco also offers an individual prescription drug plan, and the Medco Medicare Prescription Plan», which is offered to beneficiaries in all 34 Medicare regions across the U.S., as well as Puerto Rico. As an integral part of our consultative approach, our account teams use proprietary software tools that we have developed to model the effects of different plan designs based on historical data, including Medco’s EXPERxT Advisor», which provides real-time plan design modeling capability for our clients. Clients can use these models to judge the impact of specific plan design elements before they are implemented. Clinical Management We capitalize on our clinical expertise and advanced information technology infrastructure to help reduce client costs for prescription drugs in a medically appropriate manner, while striving to improve safety and the quality of care for members. We do this by delivering evidence-based clinical programs and services for our commercial clients based on clinical rationale reviewed by either the independent Pharmacy and Therapeutics Committee, or by our National Practice Leaders for programs delivered from our Therapeutic Resource Centers. 6
  • 19.
    Our Pharmacy andTherapeutics Committee makes decisions independently, and is comprised of a distinguished independent group of clinicians. This independent advisory body guides us in maintaining a consistent and therapeutically appropriate approach to the clinical content of certain programs and services, including, for example, the development of formularies and coverage criteria. We offer coverage management and utilization management programs, including drug utilization review, which is a systematic evaluation of individual and population use of prescription drugs, to identify and address over-use, under-use, and misuse of prescription drugs. As a result of these evaluations, we alert pharmacists, physicians and patients to possible issues, such as drug-drug interactions, and opportunities to consider alternate therapies including generics and formulary preferred drugs. Our clients have the option of integrating our programs into their pharmacy benefit plan. To monitor our activity under these programs, if requested by the client, we regularly report on the success of our programs, review clinical and financial data, and identify opportunities for improvement. We have also introduced a complete portfolio of innovative clinical solutions. Among them is our proprietary RationalMed» service, an advanced patient safety program designed to improve patient care and lower total healthcare costs. RationalMed» analyzes patients’ available prescriptions, inpatient and outpatient medical and laboratory claim records to detect gaps and errors in care, and then engages physicians, pharmacists and patients in making appropriate changes. Clients who make the decision to participate in RationalMed» can save money by reducing inappropriate and unsafe prescription use, reducing gaps in care and avoiding unnecessary medical costs. We offer RationalMed» as a program to health plans and plan sponsors, regardless of whether they are clients of our PBM business. For Medicare Part D plans, Medco offers a robust Medication Therapy Management program, designed to ensure that covered Medicare Part D medications prescribed to targeted beneficiaries are appropriately utilized to optimize therapeutic outcomes. Medco uses the Chronic Disease Score, a proprietary software algorithm, to identify beneficiaries who meet the criteria established by CMS. Optimal Health» is Medco’s health and care support solution, offered through our 10-year alliance with Healthways, Inc. Optimal Health» offers plan sponsors health improvement solutions across the entire population of at-risk members with chronic and complex conditions which extends our therapy management capabilities to include disease management services for those clients looking for a more comprehensive healthcare service for their members. Through innovative engagement capabilities, Optimal Health» helps patients to understand their health risks and take action with confidence to lead healthier lives. Clients who participate in Optimal Health» can save money by increasing the percent of their covered population living healthier lifestyles — improving compliance with evidence-based care guidelines for chronic conditions and avoiding unnecessary medical costs, particularly hospitalizations. Our clinical expertise will be further enhanced by our emerging pharmacogenomics capabilities. As pharmacogenomics becomes a more prominent component of prescription guidelines, our ability to build a new generation of solutions to deliver precision medicine will result in improving safety and efficacy while enhancing clinical outcomes and lowering costs. Clinical Services, Specialty Pharmacy Where appropriate, we work with the patient and the patient’s physician to implement the prescribed plan of care. Each patient is typically supported by a team consisting of a pharmacist, a customer service representative and a reimbursement specialist, and with certain therapies, a registered nurse. Generally, each patient’s team members specialize in that patient’s disease and work with payors and providers in that patient’s geographic region. We assist patients and their families in coping with a variety of difficult emotional and social challenges presented by their diseases, and in some cases participate in patient advocacy organizations, assist in the formation of patient support groups, and advocate legislation to advance patient interests. 7
  • 20.
    Pharmacy Management One of the core features of our PBM service is the management of prescription claims. Mail-Order Service. The Medco PharmacyTM, our mail-order service, is the industry’s largest pharmacy based on the number of prescriptions dispensed. In 2009, the Medco PharmacyTM filled 103.1 million prescriptions. Mail order is most appropriate for chronic and complex maintenance medications. Typically, mail order reduces costs for clients as a result of Medco’s purchasing scale, high levels of automation and efficiency, increased generic dispensing and higher rebates through enhanced formulary compliance. Many members prefer mail order for maintenance medications because they can receive up to a 90-day supply instead of the commonly dispensed 30-day supply at retail pharmacies. Members also benefit from generally lower co-payments at mail order and the convenience of receiving their prescriptions delivered to their home. Members can place first-fill, refill and renewal orders through the mail or they can request refill or renewal orders easily online through our member website, medco.com», or our integrated voice-response phone system. Additionally, physicians can fax first-fill prescriptions to the Medco Pharmacy or use point-of-care technologies. Our PBM mail-order pharmacy operations consist of seven prescription order processing pharmacies that are located throughout the United States, one of which also performs mail-order dispensing, and our two automated dispensing pharmacies in Willingboro, New Jersey and Las Vegas, Nevada. Additionally, we expect to commence operations in our third automated dispensing pharmacy in Whitestown, Indiana in 2010. In our prescription order processing pharmacies, our pharmacists, technicians and other staff focus on pharmacy activities such as reviewing, recording and interpreting incoming prescriptions, screening for interactions based on each patient’s drug history profile, resolving benefit issues with rules that are determined by plan sponsors, resolving clinical or prescription clarification issues with physicians and collecting the copayment from the patient. Once these processes are completed, the prescriptions are approved for dispensing and electronically routed to one of our mail- order dispensing pharmacies. We use image-based technology, which provides for quick access to prescription orders and promotes efficient processing. All of our Medco mail-order pharmacies are networked into one integrated systems platform. This approach to mail-order operations frees the time of our professional pharmacists so they can remain focused on patient care; it also optimizes the efficiency of the dispensing function, improving safety and reducing costs. In our dispensing pharmacies, the focus is on fulfillment and distribution of medications to patients. Our dispensing pharmacies use state-of-the-art, patented automated technology to dispense tablets and capsules, as well as items dispensed in original packaging. The dedicated teams of pharmacists and pharmacy personnel achieve Six Sigma quality levels and embrace Six Sigma process control and continuous improvement principles to ensure patients get the right medication at the right time. Through the efforts of our high-performing people and technology, we are able to use optimal dispensing methodologies to dispense prescriptions and then combine and sort orders for shipment to reduce delivery times and place the medication in the hands of the patient as quickly and efficiently as possible. PolyMedica provides diabetes testing supplies, prescriptions and related products to patients with diabetes through its Liberty brand. PolyMedica meets the needs of diabetes patients by providing delivery of supplies through locations in Florida and Virginia. For these services, PolyMedica bills Medicare, other government agencies and/or private insurance companies directly, for those diabetes-related supplies. Medco Therapeutic Resource Centers». These centers, located within our mail-order pharmacy operations, are designed around the theory that specialization leads to better pharmacy care for members with chronic and complex conditions. To better serve these members and their plans, our pharmacists receive additional specialized training in the chronic conditions that are generally associated with significant gaps in care and significant costs, such as diabetes, heart disease and asthma. Medco specialist pharmacists of a given specialty practice together in centers dedicated to the pharmacy care of people with needs in that disease category. Our scale and technology allow us to dedicate entire pharmacy practices to a single specialty and bring the services of our Medco specialist pharmacists to the members who need them, as they need them. Our acquisition of PolyMedica in 2007 complemented our Therapeutic Resource Center strategy, focusing on the rapidly growing diabetes patient base, enabling an end-to-end solution for members with diabetes who are able to order the supplies they need, along with their medications, to manage their condition. 8
  • 21.
    Specialty Pharmacy Management.Accredo Health Group provides an enhanced level of care to patients taking specialty medicines to treat complex or chronic conditions. Accredo Health Group focuses on dispensing infused, injectable, inhaled, and oral drugs that require a higher level of patient services and support compared to what typically is available from traditional pharmacies. Many specialty drugs have FDA safety and monitoring requirements. Accredo Health Group’s therapy teams may include specialty-trained pharmacists, nurses and patient service representatives. Accredo Health Group patients receive counseling and education services and access to nurses and pharmacists who are available around the clock to assist patients in managing critical aspects of care. Accredo Health Group typically dispenses a 30- to 90-day supply of specialty medications directly to the patient or the patient’s physician, with packaging and temperature-controlled handling and shipping as appropriate to maintain product integrity. The shipment may contain ancillary supplies required for administration in the patient’s home. A majority of products are dispensed and shipped from three specialty pharmacy facilities in Memphis, Tennessee; Nashville, Tennessee; and Warrendale, Pennsylvania. Accredo Health Group also maintains branch and infusion pharmacies across the United States. Retail Pharmacy Networks. We have contractual relationships covering approximately 60,000 independent and chain retail pharmacies that have agreed to participate in one or more of our retail networks. A network offers members access to a choice of pharmacies, while providing clients with contracted discount rates that we negotiate with retail pharmacies. In general, these rates for brand-name drugs are at a discount to the average wholesale price of the drug, which is the current standard pricing unit used in the industry. In addition, we determine a maximum allowable cost for most generic drugs. Our retail pharmacy network agreements also include professional dispensing fees paid to the retail pharmacy. Clients generally select a retail pharmacy network based on the number and location of pharmacies in the network and the competitiveness of the discounts that the network offers. Pharmacies in a network also agree to follow our policies and procedures designed to enhance specific performance standards regarding patient safety and service levels. Call Center Pharmacies. We operate call center pharmacies, each of which is licensed as a pharmacy in the state in which it is located and is staffed by pharmacists and service representatives. Personnel at our call center pharmacies are available to answer questions and provide information and support to members 24 hours a day, seven days a week, for members using either our mail-order service or our retail pharmacy networks. Our call center pharmacies also provide information and services to physicians and pharmacists who provide service to our clients’ members. We also have a substantial number of work-at-home call center representatives, which allows flexibility in providing appropriate coverage and contingency planning. The majority of our call center representatives are Medco employees. We have, on a limited basis, outsourced some call handling capabilities to third-party vendors, including the management of inbound calls from retail pharmacies. Reimbursement Services. With Accredo Health Group’s focus on specialty drugs to treat specific chronic diseases, significant expertise has been developed in managing reimbursement issues related to the patient’s condition and treatment program. Due to the long duration and high cost of therapy generally required to treat these chronic disorders, the availability of adequate health insurance is a constant concern for chronically ill patients. Generally, the payor, such as an insurance provider under a medical benefit, is contacted prior to each shipment to determine the patient’s health plan coverage and the portion of costs that the payor will reimburse. Reimbursement specialists review matters such as pre-authorization or other prior approval requirements, lifetime limits, pre-existing condition clauses, and the availability of special state programs. By identifying coverage limitations as part of an initial consultation, we can assist the patient in planning for alternate coverage, if necessary. In addition, we accept assignment of benefits from numerous payors, which substantially eliminates the claims submission process for most patients. Historically, drugs were primarily reimbursed by the patient’s health insurance plan through a medical benefit. This has evolved where, based on the type of drug dispensed, an increasing percentage of transactions are reimbursed through a prescription card benefit, which typically accelerates reimbursement. 9
  • 22.
    Physician Services Helping physicians to prescribe more cost-effective therapies and providing easy physician access to our mail- order pharmacy services are key Medco objectives. We offer a number of programs designed to meet these goals, from our Physician’s Service Center, which is dedicated to answering physician questions and accepting phone prescriptions, to products like RationalMed» and Physician Practice Summaries, which inform physicians about prescribing options and patterns for their Medco patients. We encourage physicians to prescribe electronically through a number of initiatives including through our founding role in Surescripts», which promotes a standardized platform to route prescriptions from prescribers to pharmacies, and our involvement in regional initiatives that promote electronic prescribing such as the Southeast Michigan ePrescribing Initiative (SEMI) undertaken by Medco and the three largest U.S. auto makers. Our approach to the physician community includes the establishment of a department for Physician Advocacy & Strategy, which considers the physician viewpoint in the development of our products and services. We use market research with practicing physicians and their staff to better understand the needs of the physician office in working with Medco effectively. Internet-Based Services Our Internet-based services have been recognized as the most advanced and comprehensive in the PBM industry. Not only do we offer what we believe is the industry’s leading consumer website for members, we also offer sites for clients and retail pharmacists that provide interactive tools aimed at improving compliance with plan goals, simplifying benefit administration, and providing critical benefit and medical information. Our My Rx Choices» prescription savings program provides members with greater transparency around their benefits and facilitates more informed patient-physician dialogue. It is designed to lead to lower costs for our clients and their members. Member-Oriented Web Services. Our member website capabilities allow members to self-manage their prescription benefits, while encouraging the use of safe, effective therapies that comply with their plan’s provisions. Our member website, medco.com», was the first Internet pharmacy site to be certified by the National Association of Boards of Pharmacy. Medicare Part D Web Services. Our member website also supports pre-enrollment and post-enrollment activities on behalf of our Medicare PDP and programs serving multiple clients. Prospective Medicare PDP participants and their caregivers can use the pre-enrollment site’s Plan Compare tool to accurately project costs for all their medications. The post-enrollment site allows members who have signed up to receive a Medicare Part D benefit from either Medco or one of our clients to securely manage all aspects of their prescription program. Client-Oriented Web Services. Our client website provides online access to Medco’s proprietary tools for reporting, analyzing and modeling data, clinical-utilization management and decision-support, plan administration, including eligibility and claims reviews, the latest industry news, and easy submission and tracking of service requests. Clients who perform their own member service can use our client website to update eligibility data and counsel members on all aspects of their pharmacy benefit, formularies, co-payments and coverage provisions, including the location of retail network pharmacies. Clients also have the ability to view detailed, consolidated claims for retail and mail-order service and issue prior-authorization approval. We can tailor access to the specific needs of different users involved in managing the pharmacy benefit within the client organization, limiting access only to authorized individuals. Pharmacist-Oriented Web Services. Our Pharmacist Resource Center offers online support for retail pharmacies that participate in our national networks. This service provides pharmacists with the latest information on new benefit plans, plan design changes, pricing information, drug recalls and alerts, as well as online access to our pharmacy services manual. Pharmacists can use this service to check patient eligibility, determine coverage and review claims status for plan members. The center also gives participating pharmacies e-mail access to our pharmacy services help desk. 10
  • 23.
    Contractual Relationships Clients. Our net revenues are principally derived from contracting with clients to provide prescription drugs to their members through our mail-order pharmacies and our networks of retail pharmacies. Our PBM client contracts provide that a client will pay for drugs dispensed to its members at specified discounts to average wholesale prices or other industry benchmarks, plus the applicable dispensing fee. Both the specified discounts to average wholesale prices and the applicable dispensing fee vary based on whether the drug dispensed is a brand-name drug, generic drug or a specialty drug, and whether the prescription is dispensed through our mail-order pharmacies or a pharmacy in our retail network. Clients may also pay an administrative fee or other fees for various services we provide. These services include claims processing, eligibility management, benefits management, formulary compliance manage- ment, clinical and retail pharmacy network management, and other related services. Client contracts may also provide that we will share with clients some or all of the rebates we receive from pharmaceutical manufacturers for that client’s utilization. Additionally, many of our contracts with clients contain provisions that guarantee the level of service we will provide to the client, the minimum level of rebates or discounts the client may receive, closure of gaps in care, or guaranteed savings levels. These clients may be entitled to performance penalties if we fail to meet a service or cost guarantee. The majority of our clients are party to these types of contracts, and our clients are generally entitled to audit our compliance with their contracts. CMS. Our product net revenues also include premiums associated with our Medicare PDP risk-based product offerings. These products involve prescription dispensing for beneficiaries enrolled in the CMS-sponsored Medicare Part D prescription drug benefit. Our two insurance company subsidiaries have been operating under contracts with CMS since 2006, and currently offer several Medicare PDP options. The products involve underwriting the benefit, charging enrollees applicable premiums, providing covered prescription drugs and administering the benefit as filed with CMS. We provide three Medicare drug benefit plan options for beneficiaries, including (i) a “standard Part D” benefit plan as mandated by statute, and (ii) two benefit plans with enhanced coverage, that exceed the standard Part D benefit plan, available for an additional premium. We also offer numerous customized benefit plan designs to employer group retiree plans under the Medicare Part D prescription drug benefit. Pharmaceutical Manufacturers. Our contracts with pharmaceutical manufacturers provide us with rebates and fees for prescription drugs dispensed through our mail-order pharmacies and retail pharmacy networks, discounts for prescription drugs we purchase and dispense from our mail-order pharmacies, and performance-based service fees associated with certain specialty drugs. Rebates and fees are generally calculated as a percentage of the aggregate dollar value of a particular drug that we dispensed, based on the manufacturer’s published wholesale price for that drug. Rebates and fees are generally invoiced to the pharmaceutical manufacturer and paid to us on a quarterly basis. We share the majority of rebates with our clients, which are based on the provisions of the applicable client contract, and may also guarantee a minimum rebate per prescription dispensed to the client’s members. Retail Pharmacies. We have contractual relationships covering approximately 60,000 independent and chain retail pharmacies that have agreed to participate in one or more of our retail networks. See “— Products and Services — Retail Pharmacy Networks” above for more information. Clients We have clients in a broad range of industry categories, including various Blue Cross/Blue Shield plans; managed care organizations; insurance carriers; third-party benefit plan administrators; employers; federal, state and local government agencies; and union-sponsored benefit plans. For the fiscal year ended December 26, 2009, our ten largest clients based on revenue accounted for approximately 49% of our net revenues, including UnitedHealth Group Incorporated (“UnitedHealth Group”), our largest client, which represented approximately $11,300 million, or 19%, of our net revenues. The UnitedHealth Group account has a lower than average mail-order penetration and, because of its size, steeper pricing than the average client, and consequently generally yields lower profitability as a percentage of net revenues than smaller client accounts. In addition, with respect to mail-order volume, which is an important contributor to our overall profitability, the mail-order volume associated with this account represented less than 10% of our overall mail-order volume for the fiscal year ended December 26, 2009. Under our current agreement with UnitedHealth Group, we are providing pharmacy benefit services through December 31, 2012. None of our other clients individually represented more than 10% of our net revenues in 2009, 2008 or 2007. 11
  • 24.
    Mail-Order Inventory Suppliers We maintain inventory in our mail-order pharmacies primarily representing a broad range of brand-name, generic and specialty pharmaceuticals. If a drug is not in our inventory, we can generally obtain it from a supplier within one or two business days. We purchase our pharmaceuticals either from our primary wholesaler, AmerisourceBergen Corp., which accounted for approximately 62% of our overall 2009 drug purchases, or directly from pharmaceutical manufacturers. Most of the purchases from our primary wholesaler were for brand-name medicines. Specialty and generic drugs are generally purchased directly from manufacturers. We believe that alternative sources of supply for most generic and brand-name pharmaceuticals are readily available, except to the extent that brand-name drugs are available to the market exclusively through the manufacturer. Accredo also has supply agreements with specialty product manufacturers. In addition, our agreements with certain biopharmaceutical manufacturers may contain minimum purchasing volume commitments. Certain biophar- maceutical manufacturers may also make selected biopharmaceuticals available to only a limited number of specialty pharmacies. Competition Competition among providers of services similar to those that we provide is intense. We compete primarily on the basis of our ability to design and administer innovative programs and services that provide a flexible, high quality prescription drug benefit management offering to our clients and their members at competitive pricing to the plan sponsor. We believe the following factors are critical to our ongoing competitiveness: • Ability to differentiate ourselves in the marketplace with our innovative member engagement model, which includes the specialized practice of pharmacy and services accessed through Medco Therapeutic Resource Centers», our initiatives in the field of pharmacogenomics and the innovative Medco Research InstituteTM. Collectively these programs and initiatives are designed to improve clinical outcomes and reduce the total cost of healthcare for plan sponsors; • Ability to effectively provide innovative plan designs focused on the specific and changing needs of clients, patients and other payors, as well as effectively administer new programs, such as those associated with Medicare Part D; • Broad capabilities, and regional and national scale to provide a fully integrated prescription benefit model, including effective mail order, retail access, specialty pharmacy, and customer service; • Quality and breadth of clinical services designed to provide a high level of care and compliance; • Proven history in effectively managing drug trend, including the ability to negotiate favorable discounts from pharmaceutical manufacturers and retail pharmacies, rebates from brand-name pharmaceutical manu- facturers, and the ability to encourage the use of lower cost generics, all of which return value to the plan sponsor; • Use of technology to deliver information and services to clients and members; and • Financial strength. 12
  • 25.
    We compete witha wide variety of market participants, including national, regional and local PBMs, Blue Cross/Blue Shield plans, insurance companies, managed care organizations, large retail pharmacy chains, large retail stores and supermarkets with in-store pharmacy operations and Internet pharmacies. Our competitors include many profitable and well-established companies that have significant financial, marketing and other resources. Some of our specialty pharmacy and clinical service offerings compete with similar services provided by smaller companies in niche markets. Our main competitors include Aetna Inc., CIGNA Corporation, CVS Caremark Corporation, Express Scripts, Inc., Humana Inc., UnitedHealth Group, Walgreen Co. and Wal-Mart Stores, Inc. Consolidation of client entities within the markets we serve, as well as the consolidation of our competitors, or suppliers could impair our ability to attract and retain clients. We believe, however, that our efficient and integrated business model, our differentiating clinical programs, our innovative services and the alignment of our business model with the demands of clients and members, will enable us to compete effectively. Corporate Compliance and Government Regulation Corporate Compliance and Ethics Program We have always been committed to the highest levels of integrity in our business operations, insisting on ethical behavior and compliance with statutory, regulatory and other legal requirements. Medco’s Corporate Compliance and Ethics Program (“Compliance and Ethics Program”) is designed to maintain a culture at Medco that promotes our core value of business with integrity and the prevention, detection and resolution of potential violations of laws or Company policies. To achieve this goal, we are committed to an effective compliance and ethics program tailored to our business and working environment. The Compliance and Ethics Program is dynamic, involving regular review and assessment to ensure that it is responsive to our changing business strategy and utilizes a broad risk management framework for planning and decision-making. The Compliance and Ethics Program supports a broad set of standards of business conduct designed to reduce the prospect of criminal and other improper conduct and to promote compliance with federal and state laws and regulations, including statutes, regulations and written directives of Medicare, Medicaid and all other federal and state programs in which we participate. These standards are embodied in our Code of Conduct, Conflict of Interest, Use and Disclosure of Individual Health Information and other key policies. These standards are delivered through our Standards of Business Conduct, which provide information about the Compliance and Ethics Program and summarize key policies, and through training to employees and contingent workers regarding the specific rules, regulations, policies and procedures that must be followed. In addition, the Compliance and Ethics Program encourages adherence to business unit and departmental procedures created to effect safe and efficient delivery of our products and services while operating our business within a compliant environment. Our Compliance and Ethics Program addresses the following elements of an effective program: • Establishing and communicating compliance-related policies and procedures; • Creating a high-level structure to oversee and implement compliance efforts; • Educating and training employees and consultants; • Internal reporting mechanisms; • Regular monitoring and auditing; • Effective performance and disciplinary standards; and • Procedures for promptly responding to potential misconduct. Oversight responsibility for our Compliance and Ethics Program is assigned to our Audit Committee of the Board of Directors, along with our Corporate Compliance Committee, consisting of members of senior management. Our Corporate Compliance Officer has day-to-day responsibility for ensuring that we maintain an effective compliance and ethics program. 13
  • 26.
    Employees are encouragedto raise concerns about improper, illegal, or unethical conduct, as well as specific instances of non-compliance. Our Compliance and Ethics Office is an available resource, either directly or via the Compliance and Ethics Line, for all employees to report compliance concerns or to raise questions about any business practices. Other reporting mechanisms are available through the Accredo Compliance Office, the PolyMedica Compliance Office, the Medicare Compliance Office or the Privacy Office. Once raised, we immedi- ately review, investigate, and resolve all concerns about non-compliant behavior and report them through the Corporate Compliance Officer in a consolidated presentation to the Corporate Compliance Committee and the Audit Committee of the Board of Directors. Government Regulation Federal and state laws and regulations govern many aspects of our business: our administration of prescription drug benefits and our drug and health education programs and services; the activities of our mail-order pharmacies; the provision of nursing services; and the operations of laboratories. We believe we are in substantial compliance with all existing legal and regulatory requirements material to the operation of our business. We have standard operating procedures and controls designed to assist in ensuring compliance with existing contractual requirements and state and federal law. We diligently monitor and audit our adherence to these procedures and controls, and we take prompt corrective and disciplinary action when appropriate. However, we cannot predict how courts or regulatory agencies may interpret existing laws or regulations or what additional federal or state legislation or regulatory initiatives may be enacted in the future regarding healthcare or the PBM industry and the application of complex standards to the operation of our business creates areas of uncertainty. Among the federal and state laws and regulations that affect aspects of our business are the following: Regulation of Our Pharmacy, Nursing, Home Health Agency, and Laboratory Operations. Our mail-order pharmacies deliver prescription drugs and supplies to individuals in all 50 states. The practice of pharmacy is generally regulated at the state level by state boards of pharmacy. Each of our dispensing pharmacies, prescription processing centers and call center pharmacies must be licensed in the state in which it is located. In some of the states where our dispensing pharmacies are located, state regulations require compliance with standards promulgated by the United States Pharmacopeia (“USP”). The USP creates standards in the packaging, storage and shipping of pharmaceuticals. Also, many of the states where we deliver pharmaceuticals, including controlled substances, have laws and regulations that require out-of-state mail-order pharmacies to register with that state’s board of pharmacy or similar regulatory body. In addition, some states have proposed laws to regulate online pharmacies, and we may be subject to this legislation if it is passed. Furthermore, those of our pharmacies that dispense durable medical equipment items, such as infusion pumps, and that bear a federal legend requiring dispensing pursuant to a prescription, are also regulated by applicable state and federal durable medical equipment laws. Accredo Health Group also operates wholesale pharmacy operations, which are subject to state licensure. Federal agencies further regulate our pharmacy operations. Pharmacies must register with the U.S. Drug Enforcement Administration and individual state controlled substance authorities in order to dispense controlled substances. In addition, the FDA (Food and Drug Administration) inspects facilities in connection with procedures to effect recalls of prescription drugs. The FTC (Federal Trade Commission) also has requirements for mail-order sellers of goods. The U.S. Postal Service (“USPS”) has statutory authority to restrict the transmission of drugs and medicines through the mail to a degree that could have an adverse effect on our mail-order operations. If the USPS restricts our ability to deliver drugs through the mail, alternative means of delivery are available to us. However, alternative means of delivery could be significantly more expensive. The Department of Transportation has regulatory authority to impose restrictions on drugs inserted in the stream of commerce. These regulations generally do not apply to the USPS and its operations. In addition, in those states that require home health or nursing licensure to provide in-home patient education or in-home administration of the pharmaceuticals we dispense, we are also regulated by those states’ Department of Health. Some states also require Certificates of Need in order to be granted home health agency licensure. Finally, our molecular genetics laboratory has received all necessary licenses including federal CLIA (Clinical Laboratory Improvement Amendments) and State of Florida Agency for Health Care Administration approval to allow us to perform and report the results for certain diagnostic tests. 14
  • 27.
    We believe thatour operations have the appropriate licenses required under the laws of the states in which they are located and that we conduct our pharmacy, laboratory and nursing operations in accordance with the laws and regulations of these states. Third-Party Administration and Other State Licensure Laws. Many states have licensure or registration laws governing companies that perform third-party administration, or TPA, services on behalf of others. The definition of a TPA required to register and comply with these laws varies from state to state. In addition, many states have laws or regulations that govern ancillary healthcare organizations, including preferred provider organizations and companies that provide utilization review and related services. The scope of these laws differs significantly from state to state, and the application of these laws to the activities of PBMs is often unclear. These regulations generally require annual or more frequent reporting and licensure renewals and impose other restrictions or obligations affecting PBM services. We have registered under these laws in states in which we have concluded, after discussion with the appropriate state agency, that registration is required. Consumer Protection Laws. Most states have consumer protection laws designed to ensure that information provided to consumers is adequate, fair and not misleading. We believe that our practices conform to the requirements of state consumer protection laws. However, we may be subject to further scrutiny under these laws as they are often interpreted broadly. Network Access Legislation. As part of our PBM services, we form and manage pharmacy networks by entering into contracts with retail pharmacies. A significant number of states have adopted legislation that may affect our ability to limit access to our retail pharmacy networks or to remove retail pharmacies from a network. This type of legislation, commonly known as “any willing provider” legislation, may require us or our clients to admit into our networks and retain any retail pharmacy willing to meet the price and other terms of our clients’ plans. To date, these statutes have not had a significant impact on our business. We will admit any licensed pharmacy that meets our network’s terms, conditions and credentialing criteria. Proposals for Direct Regulation of PBMs. Legislation directly regulating PBM activities in a comprehensive manner has been introduced in a number of states. In addition, legislation has been proposed in some states seeking to impose fiduciary obligations or disclosure requirements on PBMs. If enacted in a state in a form that is applicable to the operations we conduct there, this type of legislation could materially adversely impact us. Maine and the District of Columbia have each enacted a statute imposing fiduciary and disclosure obligations on PBMs. Other states, including Maryland, have enacted PBM regulation laws that differ from the Maine and District of Columbia laws, and are generally less onerous. ERISA Regulation. We provide PBM services to a number of different corporations and other sponsors of health plans that are subject to ERISA (the Employee Retirement Income Security Act of 1974). ERISA regulates employee pension benefit plans and employee welfare benefit plans, including health benefit and medical plans. ERISA imposes duties on any person that is a fiduciary with respect to a plan that is subject to ERISA. We administer pharmacy benefit plans according to the plan design choices made by the plan sponsor. We believe that our activities are sufficiently limited that we are not a fiduciary except in those instances in which we have expressly contracted to act as a fiduciary for the limited purpose of addressing benefit claims and appeals, including our program to meet the U.S. Department of Labor (“DOL”) regulations for claims payment and member appeals. In addition, the DOL has recently issued proposed regulations under the provisions of ERISA that regulate plan contracts with service providers, including PBMs. We anticipate that the DOL will issue amended regulations in the first quarter of 2010. The proposed regulations mandate specific disclosure by service providers. Failure to comply with the regulations could also result in a prohibited transaction. The DOL has solicited comments on the proposed regulations and we anticipate that they will change before they are finalized. As a result, we are not yet able to assess the impact on our business. We will comply with the regulations when they are finalized. 15
  • 28.
    A number oflawsuits have been filed against us, alleging that we should be treated as a “fiduciary” under ERISA and that we have breached our fiduciary obligations under ERISA in connection with our development and implementation of formularies, preferred drug listings and intervention programs. For further information on this litigation and the proposed settlement, see Note 14, “Commitments and Contingencies — Legal Proceedings,” to our audited consolidated financial statements included in Part II, Item 8 of this Annual Report on Form 10-K. Fraudulent Billing, Anti-Kickback, Stark, Civil Monetary Penalties, and False Claims Laws and Regulations. Billing. Our operations participate in federal and state programs such as Medicare and Medicaid, where we are subject to extensive government regulation including numerous state and federal laws and corresponding regulations directed at preventing fraud and abuse and regulating reimbursement. The government’s Medicare and Medicaid regulations are complex and sometimes subjective and therefore may require management’s interpretation. Our compliance with Medicare and Medicaid regulations may be reviewed by federal or state agencies, including the United States Department of Health and Human Services’ Office of the Inspector General (“OIG”), CMS, the Department of Justice (“DOJ”), and the FDA. To ensure compliance with Medicare, Medicaid and other regulations, government agencies conduct periodic audits of us to ensure compliance with various supplier standards and billing requirements. Similarly, regional health insurance carriers routinely conduct audits and request patient records and other documents to support claims submitted by us for payment. Anti-Kickback Laws and Regulations. Federal law prohibits the payment, offer, receipt or solicitation of any remuneration that is knowingly and willfully intended to induce the referral of Medicare, Medicaid or other federal healthcare program beneficiaries for the purchase, lease, ordering or recommendation of the purchase, lease or ordering of items or services reimbursable under federal healthcare programs. These laws are commonly referred to as anti-remuneration or anti-kickback laws. Several states also have similar laws, known as “all payor” statutes, which impose anti-kickback prohibitions on services not covered by federal healthcare programs. Anti-kickback laws vary between states, and courts have rarely interpreted them. Courts, the OIG, and some administrative tribunals have broadly interpreted the federal anti-kickback statute and regulations. Courts have ruled that a violation of the statute may occur even if only one of the purposes of a payment arrangement is to induce patient referrals or purchases. It is possible that our practices in the commercial sector may not be appropriate in the government payor sector. The Ethics in Patient Referrals Law (Stark Law). Federal law prohibits physicians from making a referral for certain health items or services if they, or their family members, have a financial relationship with the entity receiving the referral. No bill may be submitted in connection with a prohibited referral. Violations are punishable by civil monetary penalties upon both the person making the referral and the provider rendering the service. Such persons or entities are also subject to exclusion from Medicare and Medicaid. Many states have adopted laws similar to the Stark Law, which restrict the ability of physicians to refer patients to entities with which they have a financial relationship. The False Claims Act. The Federal False Claims Act prohibits the submission of a false claim or the making of a false record or statement in order to secure a reimbursement from a government-sponsored program. In recent years, the federal government has launched several initiatives aimed at uncovering practices that violate false claims or fraudulent billing laws. Civil monetary penalties may be assessed for many types of conduct, including conduct that is outlined in the statutes above and other federal statutes in this section. Under the Deficit Reduction Act of 2005 (“DRA”), states are encouraged to pass State False Claims Act laws similar to the Federal statute. Sanctions for fraudulent billing, kickback violations, Stark Law violations or violations of the False Claims Act include criminal or civil penalties. If we are found to have violated any state or federal kickback, Stark Law or False Claims Act law, we could be liable for significant damages, fines or penalties and potentially be ineligible to participate in federal payor programs. 16
  • 29.
    Regulation of FinancialRisk Plans. We own two insurance companies: Medco Containment Life Insurance Company (“Life”) and Medco Containment Insurance Company of New York (“NY”). On a combined basis, these subsidiary insurance companies are licensed in 50 states, the District of Columbia and the Commonwealth of Puerto Rico and are subject to extensive regulatory requirements imposed under the insurance laws of the states in which they are domiciled, as well as those in which they have obtained licenses to transact insurance business. Since 2006, the Life and NY companies have been operating under contracts with CMS and currently offer several Medicare PDP options. These products involve prescription dispensing for beneficiaries enrolled in the CMS-sponsored Medicare Part D prescription drug benefit. The products involve underwriting the benefit, charging enrollees applicable premiums, providing covered prescription drugs and administering the benefit as filed with CMS. We provide three Medicare drug benefit plan options for beneficiaries, including (i) a “standard Part D” benefit plan as mandated by statute, and (ii) two benefit plans with enhanced coverage, that exceed the standard Part D benefit plan, available for an additional premium. We also offer numerous customized benefit plan designs to employer group retiree plans under the CMS Medicare Part D prescription drug benefit. Regulation Relating to Data Transmission and Confidentiality of Patient Identifiable Information. Dispensing of prescriptions and management of prescription drug benefits require the ability to utilize patient-specific information. Government regulation of the use of patient identifiable information has grown substantially over the past several years. At the federal level, Congress enacted the Health Insurance Portability and Accountability Act of 1996, or HIPAA, and the Department of Health and Human Services, or HHS, has adopted extensive regulation, governing the transmission, use and disclosure of health information by all participants in healthcare delivery, including physicians, hospitals, insurers and other payors (“Privacy Standards”). Our pharmacy operations are covered entities under the Privacy Standards and are directly subject to these requirements. In our role as a manager of the prescription benefit, we are a business associate of health plan clients, which are covered entities subject to the Privacy Standards. In February 2009, the American Recovery and Reinvestment Act of 2009 (P.L. 111-16) was signed into law, which includes several changes to the HIPAA privacy and security rules, including an increase in penalties for HIPAA violations and making business associates directly subject to the Privacy Standards. In addition, many states have passed or are considering laws addressing the use and disclosure of health information. These proposals vary widely, some relating to only certain types of information, others to only certain uses, and yet others to only certain types of entities. These laws and regulations have a significant impact on our operations, products and services, and compliance with them is a major operational requirement. Regulations and legislation that severely restrict or prohibit our use of patient identifiable information could materially adversely affect our business. Sanctions for failing to comply with HIPAA standards include criminal and civil penalties. If we are found to have violated any state or federal statute or regulation with regard to the confidentiality, dissemination or use of patient medical information, we could be liable for significant damages, fines or penalties. Regulation Applicable to Clients. We provide services to insurers, managed care organizations, Blue Cross/Blue Shield plans and many others whose ability to offer a prescription benefit may be subject to regulatory requirements and constraints under a number of federal or state regulations. While we may not be directly subject to these regulations, they can have a significant impact on the services we provide our clients. • Formulary Restrictions. A number of states have enacted laws that regulate the establishment of formularies by insurers, Health Maintenance Organizations (“HMOs”) and other third-party payors. These laws relate to the development, review and update of formularies; the role and composition of pharmacy and therapeutics committees; the availability of formulary listings; the disclosure of formulary information to health plan members; and a process for allowing members to obtain non-preferred drugs without additional cost-sharing where the non-preferred drugs are medically necessary and the formulary drugs are determined to be inappropriate. Increasing regulation of formularies by states could significantly affect our ability to develop and administer formularies on behalf of our insurer, HMO and other health plan clients. • Industry Standards for PBM, Pharmacy, and Home Health Functions. The National Committee on Quality Assurance, the American Accreditation Healthcare Commission, known as URAC, the Joint Commission on Accreditation of Healthcare Organizations and other quasi-regulatory and accrediting bodies have developed standards relating to services performed by PBMs and specialty pharmacies, including mail order, formulary, drug utilization management, specialty pharmacy and nursing care. While the actions of these bodies do not have the force of law, PBMs and many clients for PBM services seek certification from them, as do other third parties with which our subsidiaries may contract for services. These bodies may influence the federal government or states to adopt requirements or model acts that they promulgate. The federal government and some states incorporate accreditation standards of these bodies, as well as the standards of the National Association of Insurance Commissioners and the National Association of Boards of Pharmacy, into their drug utilization review regulation. Future initiatives of these bodies are uncertain, and resulting standards or legislation could impose restrictions on us or our clients in a manner that could significantly impact our business. • Currently, Congress is considering a variety of healthcare reform proposals that may affect both PBMs and our clients. The result of this effort is uncertain, and we are evaluating appropriate actions if such legislation were to be enacted. 17
  • 30.
    Legislation and RegulationAffecting Drug Prices and Potentially Affecting the Market for Prescription Benefit Plans and Reimbursement for Durable Medical Equipment. Recently, the federal government has increased its focus on methods drug manufacturers employ to develop pricing information, which in turn is used in setting payments under the Medicare and Medicaid programs. One element common to many payment formulas, the use of “average wholesale price,” or AWP, as a standard pricing unit throughout the industry, has been criticized as not accurately reflecting prices actually charged and paid at the wholesale or retail level. The DOJ is currently conducting, and the House Energy and Commerce Committee has conducted, an investigation into the use of AWP for federal program reimbursement, and whether the use of AWP has inflated drug expenditures by the Medicare and Medicaid programs. Federal and state proposals have sought to change the basis for calculating reimbursement of certain drugs by the Medicare and Medicaid programs. The DRA revised the formula used by the federal government to set the Federal Upper Limit (FUL) for multiple source drugs by adopting 250 percent of the average manufacturer’s price (“AMP”) without regard to customary prompt pay discounts to wholesalers for the least costly therapeutic equivalent. In July 2006, HHS published a Final Rule for the Medicaid Prescription Drug Program implementing the DRA in which AMP was defined to exclude discounts and rebates to PBMs and include sales to mail-order and specialty pharmacies in the AMP calculation by manufacturers. Congress postponed implementation of the new definition for AMP until September 2009 through the Medicare Improvements for Patients and Providers Act of 2008 (“MIPPA”) enacted in July 2008. These proposals and other legislative or regulatory adjustments that may be made to the program for reimbursement of drugs by Medicare and Medicaid, if implemented, could affect our ability to negotiate discounts with pharmaceutical manufacturers. They could also impact the reimbursement our specialty pharmacies receive from government payors. In addition, they may affect our relationships with pharmacies and health plans. In some circumstances, they might also impact the reimbursement that we receive from managed care organizations that contract with government health programs to provide prescription drug benefits or otherwise elect to rely on the revised pricing information. Furthermore, private payors may choose to follow the government’s example and adopt different drug pricing bases. This could affect our ability to negotiate with plans, manufacturers and pharmacies regarding discounts and rebates. Relative to our diabetes testing supplies business, the Durable Medical Equipment, Prosthetics, Orthotics and Supplies (DMEPOS) Competitive Bid Program (the “Program”) provides for a phased-in program for competitive bidding of certain durable medical equipment items, including mail-order diabetes testing supplies. The first round of bidding under the Program was delayed in 2007, which resulted in a 9.5% reimbursement rate reduction for the Program product categories effective January 1, 2009 and also provided for no annual payment updates for 2009. The Program was re-initiated effective October 21, 2009 and the first round of bidding closed on December 21, 2009. Winning bids along with the applicable reimbursement rates are anticipated to be announced during the summer of 2010, with new reimbursement rates becoming effective in January 2011 for a limited number of geographic areas. Moreover, Congressional action has provided CMS with additional authority to use pricing information gathered during the Program for purposes of establishing reimbursement rates in geographic areas not subject to competitive bidding. Medicare Part D and Part B. The Medicare Prescription Drug, Improvement and Modernization Act of 2003 (P.L.108-173) (the “Act”) also offers far-reaching changes to the Medicare program. Important to us, the Act established a new Medicare Part D outpatient prescription drug benefit for over 40 million Americans who are eligible for Medicare. Qualified beneficiaries, including senior citizens and disabled individuals, have had the opportunity to enroll in Medicare Part D since January 1, 2006. 18
  • 31.
    Medco’s insurance subsidiarieshave been approved by CMS to participate in the Medicare Part D program as a national PDP sponsor, and Medco pharmacies may also be providers of prescription drugs and diabetes supplies to those of our patients who are covered under Medicare Part B. In addition, we have been supporting a significant number of Medco clients who have elected to continue to offer a prescription drug benefit to their Medicare retirees as primary coverage outside of the Medicare Part D benefit and receive a government subsidy. Furthermore, we support our clients with their Medicare Advantage programs that now include the Medicare Part D benefit, and with their PDP programs as the pharmacy benefit manager. State Prescription Drug Assistance Programs. Many states have expanded state prescription drug assistance programs to increase access to drugs by those currently without coverage and/or supplement the Medicare Part D benefit of those with coverage to offer options for a seamless benefit. In accordance with applicable CMS requirements, we have entered into agreements with a number of state prescription drug assistance programs and collaborated to coordinate benefits with Medicare Part D plans. This endeavor supports the coordination of benefits of our clients’ Medicare Part D offerings. Prompt Pay Regulations. Many states have adopted prompt pay regulations that require health plans to pay or deny claims within a certain timeframe. These laws generally apply to insurers and/or HMOs, although some recent initiatives have included PBMs directly. Medco currently pays pharmacies on an established two-week cycle basis as defined in the Participating Pharmacy Agreement. Pharmacies receive payment within 30 days for 100% of successful point-of-sale (POS) claims processed in a two-week cycle. Prompt pay requirements for Medicare Part D prescription drug plan claims went into effect on January 1, 2010. Drug Importation. In the face of escalating costs for plan sponsors providing a prescription drug benefit for their employees, and uninsured individuals seeking to lower their drug costs, the issue of importing drugs from Canada or other foreign countries has received significant attention. Drug importation, sometimes called drug re-importation, occurs when prescription medicines from other countries are imported for personal use or commercial distribution. Our clients have expressed interest in the potential for drug importation to reduce their drug benefit costs. Individual importation activities are generally prohibited under U.S. law, and the FDA has issued warnings and safety alerts to a number of entities seeking to promote or facilitate systematic importation activities. However, there has been considerable legislative and political activity seeking to change the FDA requirements to enable drug importation, and we are evaluating appropriate actions if such legislation were to be enacted. Health Management Services Regulation. All states regulate the practice of medicine and the practice of nursing. We believe our nurses in our Specialty Pharmacy business are properly licensed in the state in which they practice. We believe that the activities undertaken by specialty pharmacy nurses comply with all applicable laws or rules governing the practice of nursing or medicine. However, a federal or state regulatory authority may assert that some services provided by a PBM constitute the practice of medicine or the practice of nursing and are therefore subject to federal and state laws and regulations applicable to the practice of medicine and/or the practice of nursing. Employees As of year-end 2009, we had approximately 21,900 full-time employees and approximately 950 part-time employees, for a total of 22,850 employees worldwide. Approximately 30% of these employees are represented by labor organizations. Approximately 24% of employees are subject to the terms of 13 collective bargaining agreements, each of which has separate expiration dates and terms, with the United Steel, Paper and Forestry, Rubber, Manufacturing, Energy, Allied Industrial & Service Workers International Union, AFL-CIO (American Federation of Labor — Congress of Industrial Organizations) (USW); approximately 1.5% are represented by the independent union, Association of Managed Care Pharmacists (AMCP); 0.5% are represented by the Guild For Professional Pharmacists; 0.5% are represented by the International Union of Operating Engineers, AFL-CIO (IUOE); and 3.5% are represented by the Retail, Wholesale and Department Store Union, United Food and Commercial Workers (RWDSU, UFCW). Collective bargaining agreements covering these employees expire at various dates through December 2013. Six collective bargaining agreements with various labor organizations will expire during 2010. We consider our relations with our employees and their unions to be good. Accredo, Critical Care and PolyMedica employees are not represented by a labor union. Employees of our majority-owned subsidiary, Europa Apotheek based in the Netherlands, are covered by a Works Council. 19
  • 32.
    Available Information Medco files annual, quarterly and current reports, proxy and information statements and other information with the United States Securities and Exchange Commission (“SEC”). You may read and copy any document Medco files with the SEC at the SEC’s Public Reference Room at 100 F Street, N.E. Washington, DC 20549. You may obtain information regarding the operation of the Public Reference Room by calling the SEC at 1-800-SEC-0330. The SEC maintains an Internet site that contains annual, quarterly and current reports, proxy and information statements and other information regarding issuers that file electronically with the SEC. Medco’s electronic SEC filings are available to the public at http://www.sec.gov. Medco’s SEC filings are also available to the public through The New York Stock Exchange (“NYSE”), 20 Broad Street, New York, New York 10005. Medco’s common stock is listed on the NYSE and trades under the symbol “MHS.” Medco’s public Internet site is http://www.medcohealth.com. Medco makes available free of charge, through the Investor Relations page of its Internet site at http://www.medcohealth.com/investor, its annual reports on Form 10-K, quarterly reports on Form 10-Q, current reports on Form 8-K and amendments to those reports filed or furnished pursuant to Section 13(a) or 15(d) of the Securities Exchange Act of 1934, as amended (the “Exchange Act”), as soon as reasonably practicable after it electronically files such material with, or furnishes it to, the SEC. Medco also makes available, through the Investor Relations page of its Internet site, statements of beneficial ownership of Medco’s equity securities filed by its directors, officers, 10% or greater shareholders and others under Section 16 of the Exchange Act. In addition, Medco makes available on the Investor Relations page of its Internet site, its most recent proxy statements and its most recent annual reports to stockholders. Medco uses the Investor Relations page of its Internet site at http://www.medcohealth.com/investor to disclose important information to the public. Information contained on Medco’s Internet site, or that can be accessed through its Internet site, does not constitute a part of this Annual Report on Form 10-K. Medco has included its Internet site address only as an inactive textual reference and does not intend it to be an active link to its Internet site. Our corporate headquarters are located at 100 Parsons Pond Drive, Franklin Lakes, New Jersey 07417 and the telephone number at this location is (201) 269-3400. Stock Split In the first quarter of 2008, we completed a two-for-one stock split, which was effected in the form of a 100% stock dividend and distributed on January 24, 2008, to shareholders of record at the close of business on January 10, 2008. All share and per share amounts have been adjusted for the increase in issued and outstanding shares after giving effect to the stock split. For more information, see Note 1, “Background and Basis of Presentation,” to our audited consolidated financial statements included in Part II, Item 8 of this Annual Report on Form 10-K. Corporate History Medco was originally incorporated in Delaware in June 1983. Medco became an independent publicly traded enterprise on August 19, 2003. 20
  • 33.
    Item 1A. RiskFactors. The risks described below are not the only ones facing us. Additional risks not currently known to us or that we currently believe are immaterial also may impair our business operations, financial condition, and liquidity. Competition in the PBM, specialty pharmacy and the broader healthcare industry is intense and could impair our ability to attract and retain clients. Competition among providers of PBM services is intense. We compete with a wide variety of market participants, including national, regional and local PBMs, Blue Cross/Blue Shield plans, insurance companies, managed care organizations, large retail chains, large retail stores and supermarkets with in-store pharmacy operations and Internet pharmacies. Our competitors include many profitable and well-established companies that have significant financial, marketing and other resources. Some of our specialty pharmacy and clinical service offerings compete with similar services provided by smaller companies in niche markets. Our main competitors include Aetna Inc., CIGNA Corporation, CVS Caremark Corporation, Express Scripts, Inc., Humana Inc., UnitedHealth Group Incorporated (“United Health Group”), Walgreen Co. and Wal-Mart Stores, Inc. We compete based on innovation and service, as well as on price. To attract new clients and retain existing clients, we must continually develop new products and services to assist clients in managing their pharmacy benefit programs. There is no guarantee that the investments we make will result in innovative products and services that are attractive to clients, or that we will be able to execute on our strategy for such products and services. Moreover, although we need to continue to expend significant resources to develop, acquire and implement new products and services in the future, we may not be able to do so. We cannot be sure we will continue to remain competitive, nor can we be sure that we will be able to market our PBM services to clients successfully at our current levels of profitability. Part of our ability to remain profitably competitive in winning and retaining business relies on our securing competitive retail pharmacy reimbursement rates, and decreased competition among retail pharmacies may impact our ability to achieve competitive rates from retail pharmacies. Consolidation of client entities within the markets we serve, as well as the consolidation of our competitors, or suppliers could impair our ability to attract and retain clients. Failure to retain key clients and their members, either as a result of economic conditions, increased competition or other factors, could result in significantly decreased revenues, harm to our reputation and decreased profitability. Our largest client, UnitedHealth Group, represented approximately $11,300 million, or 19%, of our net revenues during 2009. Under our current agreement with UnitedHealth Group, we are providing pharmacy benefit services through December 31, 2012. Although none of our other clients individually represented more than 10% of our net revenues in 2009, our top 10 clients as of December 26, 2009, including UnitedHealth Group, represented approximately 49% of our net revenues during 2009. The loss of one or more of these clients could lead to a negative reaction in the investment community or otherwise cause harm to our reputation, resulting in stock price declines or other adverse effects. If several of our large clients terminate, cancel or do not renew their agreements with us or stop contracting with us for some of the services we provide because they accept a competing proposal or because they are involved in a merger or acquisition, and we are not successful in generating new sales with comparable operating margins to replace the lost business, our revenues and results of operations could suffer. In addition, although we believe our current liquidity and prospects for strong cash flows from operations limit the effects on our business from the weaker economy, our business may not be immune to the general risks and uncertainties affecting many other companies, such as overall U.S. and non-U.S. economic and industry conditions, global economic slowdown or geopolitical events. Our revenues and results of operations could suffer, for example, if employers drop healthcare coverage for some or all of their employees, including retirees, as a result of weakness in the economy, changes in law, or rising costs. 21
  • 34.
    Government efforts toreduce healthcare costs and alter healthcare financing practices could lead to a decreased demand for our services or to reduced profitability. During the past several years, the U.S. healthcare industry has been subject to an increase in governmental regulation at both the federal and state levels. Efforts to control healthcare costs, including prescription drug costs, are underway at the federal and state government levels. Congress frequently considers proposals that can affect the U.S. healthcare system. These proposals may increase governmental involvement in healthcare and PBM services and may otherwise change the way we and our clients conduct business. For example, if passed, proposed healthcare reform legislation could make the value of the federal Retiree Drug Subsidy less valuable to our clients. As a result, our clients may choose to drop or limit retiree prescription drug coverage. Further, healthcare organizations may react to government healthcare reform proposals and the uncertainty surrounding them by reducing or delaying the purchase of our PBM services. We cannot accurately predict the impact of proposed healthcare reform legislation, but these proposals could lead to a decreased demand for our services and other outcomes that could adversely impact our business and financial results. In addition, federal and several state-government entities are expected to consider legislation to increase regulation of managed care plans and decrease reimbursement of Medicare managed care and fee-for-service plans and Medicaid fee-for-service programs. Some of these initiatives would, among other things, require that health plan members have greater access to drugs not included on a plan’s formulary and in some instances give health plan members the right to sue their health plans for malpractice when they have been denied care. The scope of the reform proposals under consideration by Congress and state legislatures and enacted by states to date vary greatly, and we cannot predict the extent of future legislation. However, these initiatives could limit our business practices and impair our ability to serve our clients. Failure in continued execution of our retiree strategy, including the potential loss of Medicare Part D-eligible members, could adversely impact our business and financial results. Our retiree strategy is multi-faceted and includes the provision of products and services in support of our clients’ Medicare Part D plans or federal Retiree Drug Subsidy. In addition, our strategy includes managing the potential loss of Medicare-eligible members covered under our programs with our PBM clients. Lastly, we participate in the Medicare Part D benefit with our own PDP. We have made substantial investments in the personnel and technology necessary to administer our retiree strategy. In time, the Medicare Part D prescription benefit could have the effect of rendering existing prescription drug benefit plans less valuable to our clients and their members, which would reduce the total market for PBM services. In addition, some of our clients could decide to discontinue providing traditional prescription drug benefits to their Medicare-eligible members. If this occurs, the adverse effects of the loss of these members may outweigh any opportunities for new business generated by the Medicare Part D benefit through our clients’ Medicare Part D plans and our own PDP. Because of this uncertainty, we cannot accurately predict the long-term impact of these risks on our business, financial condition or results of operations. Additionally, we have various contractual and regulatory compliance requirements associated with participating in Medicare Part D. Similar to our requirements with other clients, our policies and practices associated with executing our PDP are subject to audit. If material contractual or regulatory non-compliance was to be identified, monetary penalties and/or applicable sanctions, including suspension of enrollment and marketing or debarment from participation in Medicare programs, may be imposed. Like many aspects of our business, the administration of the Medicare Part D program is complex. Any failure to execute the provisions of the Medicare Part D program, as well as our overall retiree strategy may have an adverse effect on our financial position, results of operations or cash flows. Proposed healthcare reform legislation, if passed, could also have a financial impact on our CMS-approved PDP. For a description of this risk, see “—Government efforts to reduce healthcare costs and alter healthcare financing practices could lead to a decreased demand for our services or to reduced profitability.” 22
  • 35.
    If we failto comply with complex and evolving laws and regulations domestically and internationally, we could suffer penalties, be required to pay substantial damages and/or make significant changes to our operations. We are subject to numerous federal and state regulations. If we fail to comply with existing or future applicable laws and regulations, we could suffer civil or criminal penalties, including the loss of our licenses to operate our mail-order pharmacies, and our ability to participate in federal and state healthcare programs. As a consequence of the severe penalties we may face, we must devote significant operational and managerial resources to comply with these laws and regulations. Although we believe we are substantially compliant with all existing statutes and regulations applicable to our business, different interpretations and enforcement policies related to these laws and regulations could subject our current practices to allegations of impropriety or illegality, or require us to make significant changes to our operations. In addition, we cannot predict the impact of future legislation and regulatory changes on our business or ensure we will be able to obtain or maintain the regulatory approvals required to operate our business. Our international business is also susceptible to a changing political and regulatory landscape. Changes in laws or interpretations in countries in which we operate may impair our ability to serve these customers and adversely impact the financial condition, liquidity and operating results of our international operations. If we do not continue to earn and retain purchase discounts, rebates and service fees from manufacturers at current levels, our gross margins may decline. We have contractual relationships with pharmaceutical manufacturers and wholesalers providing us with purchase discounts on drugs dispensed from our mail-order pharmacies, and service fees for activities performed for certain specialty products and, in the case of many pharmaceutical manufacturers, rebates on specified brand-name prescription drugs dispensed through mail order and retail. Most of these discounts and rebates are generally passed on to clients in the form of steeper price discounts and rebate pass-backs. Manufacturer rebates often depend on our ability to meet contractual market share or other requirements. Our clients often have contractual rights relating to their formulary structure, and while our programs aim to maximize savings to clients, clients are often making specific choices regarding which drugs to place on their formularies. Our profitability can be impacted by these client decisions. In addition, the pharmaceutical industry (both manufacturers of brand-name drugs, as well as generic drugs) continues to consolidate and this may impact our drug purchasing costs and our profitability. Changes in existing federal or state laws or regulations or in their interpretation by courts and agencies or the adoption of new laws or regulations relating to patent term extensions, purchase discount and rebate arrangements with pharmaceutical manufacturers, as well as some of the formulary and other services we provide to pharmaceu- tical manufacturers, could also reduce the discounts or rebates we receive and adversely impact our business, financial condition, liquidity and operating results. From time to time we engage in transactions to acquire other companies or businesses and if we are unable to effectively integrate acquired businesses into ours, our operating results may be adversely affected. Even if we are successful, the integration of these businesses has required, and will likely continue to require, significant resources and management attention. From time to time we engage in transactions to acquire or otherwise align with other companies or businesses. In order to realize the intended benefits of both past and future transactions, we must effectively integrate these business activities into ours. If we fail to successfully integrate these business activities or if they fail to perform as we anticipated, our revenue and operating results could be adversely affected. If the due diligence of the operations of these acquired businesses performed by us or by third parties on our behalf were inadequate or flawed, or if we later discover unforeseen financial or business liabilities, the acquired businesses may not perform as expected. Operating costs, customer loss and business disruption (including difficulties in maintaining relationships with employees, customers, clients or suppliers) may be greater than we anticipated. Finally, difficulties assimilating acquired operations and products could result in the diversion of capital and management’s attention away from other business issues and opportunities. International operations are also subject to additional risks, which could include variation in local economies, export and import restrictions, currency fluctuations, trade barriers, the burden of complying with a variety of international laws, and political and economic instability. 23
  • 36.
    New legislative orregulatory initiatives that restrict or prohibit the PBM industry’s ability to use patient identifiable information could limit our ability to use information critical to the operation of our business. Many of our products and services rely on our ability to use patient identifiable information. In addition to electronically reviewing hundreds of millions of prescriptions each year, we collect and process confidential information through many of our programs and alliances, including RationalMed» and point-of-care initiatives. There is currently substantial regulation at the federal and state levels addressing the use and disclosure of patient identifiable medical and other information. In February 2009, the American Recovery and Reinvestment Act of 2009 (P.L. 111-16) was signed into law, which adds additional requirements under the HIPAA privacy and security rules. Failure to comply with standards issued pursuant to state or federal statutes or regulations may result in criminal penalties and civil sanctions. See Item 1, “Business — Government Regulation,” above. These and future regulations and legislation severely restricting or prohibiting our use of patient identifiable medical and other information could limit our ability to use information critical to the operation of our business. If we violate a patient’s privacy or are found to have violated any state or federal statute or regulation with regard to the confidentiality, dissemination or use of patient medical information, we could be liable for significant damages, fines or penalties. Our Specialty Pharmacy business is highly dependent on our relationships with a limited number of suppliers and the loss of any of these relationships, or limitations on our ability to provide services to these suppliers, could significantly impact our ability to sustain and/or improve our financial performance. We derive a substantial percentage of our Specialty Pharmacy segment revenue and profitability from our relationships with a limited number of suppliers. Our agreements with these suppliers may be short-term and cancelable by either party without cause on 30 to 365 days prior notice. These agreements may limit our ability to provide services for competing drugs during the term of the agreement and allow the supplier to distribute through channels other than us. Further, certain of these agreements allow pricing and other terms of these relationships to be periodically adjusted for changing market conditions or required service levels. A termination or modification to any of these relationships could have a material adverse effect on our business, financial condition and results of operations. Our ability to grow our Specialty Pharmacy business could be limited if we do not expand our existing base of drugs or if we lose patients. Our Specialty Pharmacy segment focuses on complex and expensive drugs that serve relatively small patient populations. Due to the limited patient populations utilizing the drugs our Specialty Pharmacy business handles, our future growth relies in part on expanding our base of drugs or penetration in drug categories, such as oncology. Further, a loss of patient base or reduction in demand for any reason for the drugs we currently dispense could have a material adverse effect on our business, financial condition and results of operations. Our Specialty Pharmacy business, certain revenues from diabetes testing supplies and our Medicare Part D offerings expose us to increased credit risk. Additionally, current economic conditions may expose us to increased credit risk. A portion of our Specialty Pharmacy business is funded through medical benefit coverage, the majority of which is provided by private insurers, as well as reimbursement by government agencies. These Specialty Pharmacy claims are generally for very high-priced medicines, and collection of payments from insurance companies, patients and other payors generally takes substantially longer than for those claims administered through a PBM benefit. Because of the high cost of these claims, and the nature of the medical benefit coverage determination process, these accounts receivable are characterized by higher risk in collecting the full amounts due. 24
  • 37.
    Revenues from thesale of diabetes testing supplies under the Liberty brand depend on the continued availability of reimbursement by government and private insurance plans. The government’s Medicare regulations are complex and, as a result, the collection process is time-consuming and typically involves the submission of claims to multiple payors whose payment of claims may be contingent upon the payment of another payor. Because of the coordination with multiple payors and the complexity in determining reimbursable amounts, these accounts receivable have higher risk in collecting the full amounts due. Our Medicare Part D product offerings require premium payments from members for the ongoing benefit, as well as amounts due from CMS. As a result of the demographics of the consumers covered under these programs and the complexity of the calculations for amounts due from CMS, these accounts receivable are subject to realization risk in excess of what is experienced in the core PBM business. Additionally, we may be subject to increased credit risk associated with state and local government agencies experiencing increased fiscal challenges. As a result of these aforementioned risks, we may be required to record bad debt expenses potentially impacting our results of operations and liquidity. Changes in reimbursement rates, including competitive bidding for durable medical equipment suppliers, could negatively affect our revenues and profits. A portion of our Accredo Health Group revenues and the majority of our PolyMedica Corporation (“PolyMedica”) revenues are tied to the continued availability of reimbursement by government and private insurance plans. Any reduction in Medicare or other government program or private plan reimbursements currently available for our products would reduce our revenues. Without a corresponding reduction in the cost of such products, our profits would also be reduced. Additionally, our profits could be affected by the imposition of more stringent regulatory requirements for Medicare or other government program reimbursement or adjustments to previously reimbursed amounts, and due to potential budget limitations being experienced by many states, we could experience reductions in our Medicaid reimbursement for certain drugs dispensed by our specialty pharmacies under our Accredo brand. Specifically in regard to our revenues and profits associated with our diabetes testing supplies business, the Durable Medical Equipment, Prosthetics, Orthotics and Supplies (DMEPOS) Competitive Bid Program (the “Program”) provides for a phased-in program for competitive bidding of certain durable medical equipment items, including mail-order diabetes testing supplies. The first round of bidding under the Program was delayed in 2007, which resulted in a 9.5% reimbursement rate reduction for the Program product categories effective January 1, 2009 and also provided for no annual payment updates for 2009. The Program was re-initiated effective October 21, 2009 and the first round of bidding closed on December 21, 2009. Winning bids along with the applicable reimbursement rates are anticipated to be announced during the summer of 2010, with new reimbursement rates becoming effective in January 2011 for a limited number of geographic areas. Moreover, Congressional action has provided CMS with additional authority to use pricing information gathered during the Program for purposes of establishing reimbursement rates in geographic areas not subject to competitive bidding. Our operating results could be negatively affected if CMS uses this authority to impose lower reimburse- ment rates in geographic areas that would otherwise have been excluded from the impact of competitive bidding. Prescription volumes may decline, and our net revenues and profitability may be negatively impacted, if the safety risk profiles of drugs increase or if drugs are withdrawn from the market, including as a result of manufacturing issues, or if prescription drugs transition to over-the-counter products. We dispense significant volumes of brand-name and generic drugs from our mail-order pharmacies and through networks of retail pharmacies, which are the basis for our net revenues and profitability. When increased safety risk profiles or manufacturing issues of specific drugs or classes of drugs result in utilization decreases, physicians may cease writing or otherwise reduce the numbers of prescriptions for these drugs. Additionally, negative press regarding drugs with higher safety risk profiles may result in reduced global consumer demand for such drugs. On occasion, products are withdrawn by their manufacturers or transition to over-the-counter products. In cases where there are no acceptable prescription drug equivalents or alternatives for these prescription drugs, or for over-the-counter products that are not recaptured in the Medco Health StoreTM, our volumes, net revenues, profitability and cash flows may decline. 25
  • 38.
    PBMs could besubject to claims under ERISA if they are found to be a fiduciary of a health benefit plan governed by ERISA. PBMs typically provide services to corporations and other sponsors of health benefit plans subject to the Employee Retirement Income Security Act of 1974 (“ERISA”). ERISA regulates employee pension benefit plans and employee welfare benefit plans, including health and medical plans. The U.S. Department of Labor (“DOL”), which is the agency that enforces ERISA, could assert that the fiduciary obligations imposed by the statute apply to some or all of the services provided by a PBM where the PBM had not agreed to accept fiduciary responsibility. We are party to several lawsuits which claim we are a fiduciary under ERISA. See Note 14, “Commitments and Contingencies—Legal Proceedings,” to our audited consolidated financial statements included in Part II, Item 8 of this Annual Report on Form 10-K. If a court were to determine, in litigation brought by a private party or in a proceeding arising out of a position taken by the DOL, that we were a fiduciary in connection with services for which we had not agreed to accept fiduciary responsibility, we could potentially be subject to claims for breaching fiduciary duties and/or entering into certain “prohibited transactions” that could have a material adverse effect on our business, financial condition, liquidity and results of operations. Pending litigation could adversely impact our business practices and have a material adverse effect on our business, financial condition, liquidity and operating results. We are party to various legal proceedings and are subject to litigation risks. The most significant legal proceedings to which Medco is a party are described in detail in Note 14, “Commitments and Contingencies—Legal Proceedings,” to our audited consolidated financial statements included in Part II, Item 8 of this Annual Report on Form 10-K. Although we believe we have meritorious defenses in each of the matters described therein, we could in the future incur judgments or enter into settlements of claims that could have a material adverse effect on our business, financial condition, liquidity and results of operations in any particular period. Changes in industry pricing benchmarks could adversely affect our financial performance. Contracts in the prescription drug industry generally use certain published benchmarks to establish pricing for prescription drugs. Most of Medco’s PBM client contracts and Accredo and PolyMedica’s commercial contracts and most of its governmental participating provider agreements use the Average Wholesale Price, or AWP, standard. Recently, First DataBank, the company that reports AWP data to Medco, announced it would discontinue publishing AWP some time in 2011. Currently, we do not know what other pricing benchmark(s) will be adopted. Medco’s customer contracts contain terms Medco believes will enable it to mitigate any adverse effects resulting from a change in the pricing benchmark. Legislation may lead to changes in the pricing for Medicare and Medicaid programs. See Item 1, “Business— Government Regulation—Legislation and Regulation Affecting Drug Prices and Potentially Affecting the Market for Prescription Benefit Plans and Reimbursement for Durable Medical Equipment,” included in this Annual Report on Form 10-K. At least one Medicaid program has adopted, and other Medicaid programs, some states and some commercial payors may adopt, those aspects of the Medicare Prescription Drug, Improvement and Modernization Act of 2003 (P.L. 108-173) or the Deficit Reduction Act of 2005 (P.L. 109-171) that either result in or appear to result in price reductions for drugs covered by such programs. Adoption of Average Sales Price (“ASP”) or Average Manufacturer’s Price (“AMP”) in lieu of AWP as the measure for determining reimbursement by state Medicaid programs for the drugs sold in our Specialty Pharmacy business could materially reduce the revenue and gross margins of this business. 26
  • 39.
    We are subjectto a corporate integrity agreement and noncompliance may impede our ability to conduct business with the federal government. As part of a civil settlement with the Department of Justice (“DOJ”) and other federal government agencies, in October 2006, Medco entered into a five-year corporate integrity agreement with the United States Department of Health and Human Services’ Office of the Inspector General (“OIG”) and the U.S. Office of Personnel Management Office of the Inspector General. The agreement is designed to ensure that Medco’s compliance program meets certain requirements. The agreement provides for, among other things, that Medco continue to have a Compliance Officer, a Compliance Committee, a Code of Conduct that is disseminated to employees, a toll-free number for employees to report potential violations of Covered Federal Program requirements, written policies and procedures (including the establishment of new databases), regular training for all employees with regard to Medco’s Code of Conduct, and various auditing programs. Failure to comply with the obligations of this corporate integrity agreement could result in debarment from participation in certain federal business arrangements, financial penalties and damage to Medco’s reputation. The terms and covenants relating to our existing indebtedness could adversely impact our financial performance and liquidity. Like other companies that incur debt, we are subject to risks normally associated with debt financing, such as the insufficiency of cash flow to meet required debt service payment obligations and the inability to refinance existing indebtedness. Our credit facilities, accounts receivable financing facility and the indentures governing our senior notes contain customary restrictions, requirements and other limitations on our ability to incur indebtedness, including a maximum total debt-to-EBITDA ratio. Our continued ability to borrow under our credit facilities and accounts receivable financing facility is subject to our compliance with such financial and other covenants. If we fail to satisfy these covenants, we would be in default under the credit facilities, accounts receivable financing facility and/or indentures, and may be required to repay such debt with capital from other sources or not be able to draw down against our facility. Under such circumstances, other sources of capital may not be available to us, or be available only on unattractive terms. See Note 8, “Debt,” to our audited consolidated financial statements included in Part II, Item 8 of this Annual Report on Form 10-K. In addition, as of December 26, 2009, of our total outstanding borrowings of approximately $4.0 billion, $2.2 billion is impacted by variable interest rates. Increases in interest rates on variable rate indebtedness would increase our interest expense and could adversely affect our results of operations. We may be subject to liability claims for damages and other expenses not covered by insurance. Our commercial professional liability insurance policies are expected to cover up to $85 million per individual claim. In addition to our commercial professional liability insurance policies, we have a retained liability component requiring certain self-insurance reserves to cover potential claims. We currently process any claims included in self- insured retention levels through a captive insurance company. A successful professional liability claim in excess of our insurance coverage, or one for which an exclusion from coverage applies, could have a material adverse effect on our financial condition and results of operations. We believe most of the claims described in Note 14, “Commitments and Contingencies—Legal Proceedings,” to our audited consolidated financial statements included in Part II, Item 8 of this Annual Report on Form 10-K, are unlikely to be covered by insurance. The success of our business depends on maintaining a well-secured pharmacy operation and technology infrastructure. Additionally, significant disruptions to our infrastructure or any of our facilities due to failure to execute security measures or failure to execute business continuity plans in the event of an epidemic or pandemic or some other catastrophic event could adversely impact our business. We are dependent on our infrastructure, including our information systems, for many aspects of our business operations. A fundamental requirement for our business is the secure storage and transmission of personal health information and other confidential data and we must maintain our business processes and information systems, and the integrity of our confidential information. Although we have developed systems and processes that are designed to protect information against security breaches, failure to protect such information or mitigate any such breaches may adversely affect our operations. In the event we or our vendors experience malfunctions in business processes, breaches of information systems, failure to maintain effective and up-to-date information systems or unauthorized and non-compliant actions by any individual, this could disrupt our business operations or impact patient safety, result in customer and member disputes, damage our reputation, expose us to risk of loss or litigation, regulatory violations, increase administrative expenses or lead to other adverse consequences. 27
  • 40.
    We have automatedand other mail-order dispensing pharmacies, call centers, data centers and corporate facilities. All of these facilities depend on the local infrastructure and the uninterrupted operation of our computerized dispensing systems and our electronic data processing systems. Significant disruptions at any of these facilities or our vendors’ facilities due to failure of technology or any other failure or disruption to these systems or to the infrastructure due to fire, electrical outage, natural disaster, acts of terrorism or malice, an epidemic or pandemic or some other catastrophic event could, temporarily or indefinitely, significantly reduce, or partially or totally eliminate, our ability to process and dispense prescriptions and provide products and services to our clients and members. We may be required to record a material non-cash charge to income if our recorded intangible assets or goodwill are impaired, or if we shorten intangible asset useful lives. We have over $2.4 billion of recorded intangible assets, net, on our consolidated balance sheet as of December 26, 2009. For our PBM segment, our intangible assets primarily represent the value of client relationships that had been pushed down to our consolidated balance sheets and existed when we became an independent, publicly traded enterprise in 2003, and to a lesser extent, our acquisitions of PolyMedica in 2007 and a majority stake in Europa Apotheek Venlo B.V. in 2008. For our Specialty Pharmacy segment, we have intangible assets recorded primarily from our acquisition of Accredo in 2005. Under current accounting rules, intangible assets are amortized over their useful lives. These assets may become impaired with events such as the loss of significant clients or specialty product manufacturer contracts, or when other changes in circumstances indicate the carrying amount may not be recoverable. For our intangible assets, if the carrying amount of the assets exceeds the undiscounted pre-tax expected future cash flows from the lowest appropriate asset grouping, we would be required to record a non-cash impairment charge to our consolidated statement of income in the amount the carrying value of these assets exceeds the discounted expected future cash flows. In addition, while our intangible assets may not be impaired, the useful lives are subject to continual assessment. This assessment may result in a reduction of the remaining weighted average useful life of these assets, resulting in potentially significant increases to non-cash amortization expense charged to our consolidated statement of income, which could have a material adverse effect on our earnings. We also have over $6.3 billion of recorded goodwill on our consolidated balance sheet as of December 26, 2009. Goodwill is assessed for impairment annually for each of our segments’ reporting units. This assessment includes comparing the fair value of each reporting unit to the carrying value of the assets assigned to that reporting unit. If the carrying value of the reporting unit were to exceed our estimate of fair value of the reporting unit, we would then be required to estimate the fair value of the individual assets and liabilities within the reporting unit to ascertain the fair value of goodwill. If we determine that the fair value is less than our book value, we could be required to record a non-cash impairment charge to our consolidated statement of income, which could have a material adverse effect on our earnings. Anti-takeover provisions of the Delaware General Corporation Law (“DGCL”), our certificate of incorporation and our bylaws could delay or deter a change in control and make it more difficult to remove incumbent officers and directors. Our certificate of incorporation and bylaws and various provisions of the DGCL may make it more difficult to effect a change of control of our company or remove incumbent officers and directors. The existence of these provisions may adversely affect the price of our common stock, discourage third parties from making a bid to acquire our company or reduce any premium paid to our shareholders for their common stock. Our Board of Directors has authority to issue up to 10,000,000 shares of “blank check” preferred stock and to attach special rights and preferences to this preferred stock. The issuance of this preferred stock may make it more difficult for a third party to acquire control of us. 28
  • 41.
    Moreover, as aresult of our ownership of insurance companies, a third party attempting to effect a change of control of our company may be required to obtain approval from the applicable state insurance regulatory officials. The need for this approval may discourage third parties from making a bid for our company or make it more difficult for a third party to acquire our company, which may adversely affect the price of our common stock. Item 1B. Unresolved Staff Comments. None. Item 2. Properties. As of December 26, 2009, we own or lease 150 facilities throughout the United States and lease two properties in Europe. We believe our facilities are well-maintained and in good operating condition and have adequate capacity to meet our current business needs. Our existing facilities contain an aggregate of approximately 3,900,000 square feet. Our corporate headquarters office is located in Franklin Lakes, New Jersey and accommodates our executive and corporate functions. Our PBM mail-order pharmacy operations consist of seven prescription order processing pharmacies that are located throughout the United States, one of which also performs mail-order dispensing, and our two automated dispensing pharmacies in Willingboro, New Jersey and Las Vegas, Nevada. Additionally, we expect to commence operations in our third automated dispensing pharmacy in Whitestown, Indiana in 2010. In addition, as a result of our PolyMedica acquisition, we have two pharmacies that dispense diabetes supplies. We also have three Specialty Pharmacy mail-order pharmacies and 78 specialty branch pharmacies. Item 3. Legal Proceedings. In the ordinary course of business, the Company is involved in litigation, claims, government inquiries, investigations, charges and proceedings, including, but not limited to, those relating to regulatory, commercial, employment, employee benefits and securities matters. Descriptions of certain legal proceedings to which the Company is a party are contained in Note 14, “Commitments and Contingencies — Legal Proceedings,” to our audited consolidated financial statements included in Part II, Item 8 of this Annual Report on Form 10-K and are incorporated by reference herein. Item 4. Submission of Matters to a Vote of Security Holders. Not applicable. Executive Officers of the Company The executive officers of the Company, and their ages and positions as of February 1, 2010 are as follows: Name Age Position David B. Snow, Jr. . . . . . . . . . . . . . . . . . . . . . . . . . . 55 Chairman and Chief Executive Officer Gabriel R. Cappucci . . . . . . . . . . . . . . . . . . . . . . . . . 47 Senior Vice President and Controller, Chief Accounting Officer Mary T. Daschner . . . . . . . . . . . . . . . . . . . . . . . . . . . 51 Group President, Retiree Solutions John P. Driscoll . . . . . . . . . . . . . . . . . . . . . . . . . . . . 50 President, New Markets Robert S. Epstein . . . . . . . . . . . . . . . . . . . . . . . . . . . 54 Chief Medical Officer and President, Medco Research Institute Steven R. Fitzpatrick . . . . . ................... 50 President, Accredo Health Group, Inc. Brian T. Griffin . . . . . . . . . ................... 50 Group President, Health Plans Kenneth O. Klepper . . . . . . ................... 56 President and Chief Operating Officer Laizer D. Kornwasser . . . . . ................... 38 President, Liberty Medical and Senior Vice President, Channel and Generic Strategy Thomas M. Moriarty. . . . . . . . . . . . . . . . . . . . . . . . . 46 General Counsel, Secretary and Senior Vice President, Pharmaceutical Strategies and Solutions Karin V. Princivalle . . . . . . . . . . . . . . . . . . . . . . . . . 53 Senior Vice President, Human Resources Richard J. Rubino . . . . . . . . . . . . . . . . . . . . . . . . . . . 52 Senior Vice President, Finance and Chief Financial Officer Jack A. Smith. . . . . . . . . . . . . . . . . . . . . . . . . . . . . . 62 Senior Vice President, Chief Marketing Officer Glenn C. Taylor . . . . . . . . . . . . . . . . . . . . . . . . . . . . 58 Group President, Key Accounts Timothy C. Wentworth . . . . . . . . . . . . . . . . . . . . . . . 49 Group President, Employer Accounts 29
  • 42.
    David B. Snow,Jr. has served as Chief Executive Officer and as a director of the Company since March 2003. Mr. Snow was appointed Chairman of the Company’s Board of Directors in June 2003 and also served as the Company’s President from 2003 to 2006. Prior to joining the Company, Mr. Snow served as President and Chief Operating Officer at WellChoice, Inc. (formerly Empire BlueCross BlueShield) where he held the position of Executive Vice President and Chief Operating Officer beginning in 1999 and then held the position of President and Chief Operating Officer from 2001 through 2003. From 1993 to 1998, Mr. Snow was an Executive Vice President of Oxford Health Plans, a health maintenance organization, and was responsible for marketing, medical delivery systems, medical management and government programs. Mr. Snow has served in executive leadership roles for a number of other healthcare companies throughout his career, including American International Healthcare, Inc. and US HealthCare, Inc. He also co-founded and served as President and CEO of Managed Healthcare Systems, Inc., which was later renamed AmeriChoice. Mr. Snow is currently a director of Pitney Bowes Inc. (Compensation Committee; Technology Committee). Mr. Snow is also a director of various private companies and not-for-profit charitable organizations. Gabriel R. Cappucci has served as Medco’s Senior Vice President and Controller, Chief Accounting Officer since March 2008, and is directly responsible for accounting and financial reporting, financial systems, and client rebate and performance guarantee reporting and analysis. Mr. Cappucci joined Medco in July 1993 and has held a variety of accounting, financial reporting, and financial planning roles. Most recently, since June 2004, Mr. Cappucci was Vice President, Financial Reporting with responsibility for Medco’s financial reporting and accounting standards. Prior to joining the Company, Mr. Cappucci was a Senior Manager with KPMG LLP where he had been employed since August 1985. Mr. Cappucci is a Certified Public Accountant and a member of the American Institute of Certified Public Accountants. Mary T. Daschner has served as Group President, Retiree Solutions since September 2008 and in this role is responsible for strategy and business results for Medco’s retiree and Medicare eligible population. The current portfolio includes Medco’s National Prescription Drug Program, the Medco Medicare Prescription Plan» and Employer Retiree Solutions including Employer Prescription Drug Plans, Enhanced Plans, Retiree Drug Subsidy and secondary wraparound products. Ms. Daschner joined the Company in December 1999, initially serving as Senior Director of Business and Product Development, and later as Vice President, Health Plans and Government Programs since 2001, where she managed service and drug trend strategy supporting more than six million UnitedHealth Group Incorporated (“UnitedHealth Group”) members, including Medicare, Managed Medicaid and commercial fully insured populations. Ms. Daschner came to the Company from Senior Market Strategies, a healthcare consulting business focused on reimbursement, outcomes and patient access in the over 50 marketplace, where she served as President. John P. Driscoll has served as President, New Markets since April 2008, and in this role is responsible for the Company’s consumer-driven programs, insured solutions and business development, both domestically and interna- tionally. Mr. Driscoll joined the Company in June 2003 as Senior Vice President, Product and Business Development and served as President, Insured and Emerging Markets from June 2006 to April 2008. Mr. Driscoll came to the Company from Oak Investment Partners, a venture capital firm, where he served as an advisor on healthcare investments from January 2002 through May 2003. Mr. Driscoll held the position of Executive Vice President of Walker Digital from January 2000 to December 2001. Mr. Driscoll served in a number of senior positions at Oxford Health Plans from 1991 through 1999, including, most recently, as its Corporate Vice President, Government Programs. 30
  • 43.
    Robert S. Epstein,M.D., M.S. has served as the Company’s Chief Medical Officer since 1997. In this capacity, he is responsible for formulary development, clinical guidelines, drug information services, accreditation oversight, and personalized medicine services. He is also responsible for analysis and reporting for Medco’s clients. In addition, Dr. Epstein has served as President of the Medco Research Institute since December 2009. Dr. Epstein was trained as an epidemiologist, and worked in public health and academia before joining the private sector. He is past elected President of the International Society of Pharmacoeconomics and Outcomes Research, and has served on the Board of Directors for the Drug Information Association. In 2008, Dr. Epstein was nominated and elected to the Federal CDC EGAPP (Evaluation of Genomic Applications in Practice & Prevention) Stakeholder Committee, and the AHRQ CERT (Centers for Education and Research on Therapeutics) Committee. He has published more than 50 peer reviewed medical articles and book chapters, and serves as a reviewer for several influential medical journals. Steven R. Fitzpatrick has served as President, Accredo Health Group, Inc., the Company’s specialty pharmacy organization since June 2008. Mr. Fitzpatrick became an executive officer of the Company in October 2009. Mr. Fitzpatrick joined Accredo Health Group, Inc., in 2001 as President of its subsidiary, Sunrise Health Management, Inc., and was named President of Accredo Therapeutics, Inc., in February 2002. With the acquisition of Accredo Health Group, Inc., by the Company in August 2005, Mr. Fitzpatrick assumed responsibility for both Accredo Therapeutics and Accredo Specialty Care Services (formerly Medco Specialty Solutions). In March 2006, he became Chief Operating Officer of Accredo Health Group, Inc. Prior to joining Accredo, Mr. Fitzpatrick held senior management positions with Abbott Laboratories, Block Medical, PharmaThera, Inc., and Nations Healthcare. Brian T. Griffin has served as the Company’s Group President, Health Plans since January 2004. From January 1999 through December 2003 he served as Senior Vice President, Sales and was responsible for sales on a national basis. From November 1995 to December 1998, Mr. Griffin led the Insurance Carrier customer group and was responsible for sales within the Insurance Carrier Blue Cross/Blue Shield and Third-Party Administrator Markets. Mr. Griffin joined the Company in 1987. Kenneth O. Klepper has served as President and Chief Operating Officer since March 2006. He joined the Company in June 2003 and served as Executive Vice President, Chief Operating Officer from June 2003 through March 2006. Mr. Klepper oversees the Company’s sales and account groups, the Company’s Retiree Solutions group, information technology, customer service, pharmacy operations, and Accredo Health Group, Inc., the Company’s specialty pharmacy organization. Mr. Klepper joined the Company from WellChoice, Inc. where he held the position of Senior Vice President, Process Champion from March 1995 to August 1999, and then held the position of Senior Vice President for Systems, Technology and Infrastructure from August 1999 to April 2003. Laizer D. Kornwasser has served as President of Liberty Medical since the Company’s acquisition of PolyMedica Corporation in October 2007. In addition, Mr. Kornwasser has served as Senior Vice President, Channel and Generic Strategy since August 2006, and oversees the Company’s mail and retail channels and generic strategy. Mr. Kornwasser is responsible for developing and executing generic strategies and optimizing channel distribution to significantly reduce client and member pharmacy costs. Mr. Kornwasser joined the Company in August 2003, initially serving as Vice President of Business Development, and from 2005 as Senior Vice President of Business Development and Retail Networks. Prior to joining the Company, Mr. Kornwasser was the founder and Managing Partner of Edgewood Consulting LLC, a turnaround/strategic advisory firm. Mr. Kornwasser is a director of the National Bank of California. Thomas M. Moriarty has served as General Counsel and Secretary since March 2008, and is responsible for overseeing the Company’s legal affairs. In addition, he has served as Senior Vice President, Pharmaceutical Strategies and Solutions since September 2007, with responsibility for negotiations with pharmaceutical manufactur- ers, drug purchasing analysis and consulting with clients on formulary drug lists and plan design. He also served as Senior Vice President, Business Development responsible for mergers and acquisitions and strategic alliances from August 2006 until March 2008. Prior to that, he was Deputy General Counsel, Vice President and Managing Counsel, responsible for mergers and acquisitions and client and commercial contracting from December 2005 until August 2006. From November 2002 until December 2005, Mr. Moriarty served as Vice President and Counsel, Client Contracting. Mr. Moriarty joined the Company in June 2000 as Assistant Counsel, Client Contracting. Prior to joining the Company, Mr. Moriarty served as Assistant General Counsel, Pharma & North America for Merial Limited (a Merck & Co., Inc. and Sanofi Aventis Company) and as Assistant Counsel for Merck & Co., Inc. 31
  • 44.
    Karin V. Princivallehas served as Senior Vice President, Human Resources since joining the Company in May 2001, and is responsible for company-wide human resource activities. Ms. Princivalle joined the Company from TradeOut.com, an online business-to-business marketplace, where she served as Vice President for Human Resources from February 2000 to May 2001. Previously, she served as Vice President of Human Resources for Citigroup’s North America bankcards business from May 1998 to August 2000 and Vice President of Human Resources for Citigroup’s Consumer Businesses in Central/Eastern Europe, Middle East, Africa and Asia from March 1997 to May 1998. Richard J. Rubino has served as Senior Vice President, Finance and Chief Financial Officer since March 2008. Mr. Rubino has oversight responsibility for all financial activities, including accounting, reporting, accounts receivable and reimbursement activities, treasury, tax, planning, analysis, procurement, audit, investor relations and financial evaluation. Prior to this position he served as Senior Vice President and Controller, Chief Accounting Officer since April 2005 and in that role was directly responsible for accounting and financial reporting, financial systems, and client and pharmaceutical manufacturer accounts receivable. From June 1998 to April 2005, Mr. Rubino served as Vice President and Controller with responsibility for accounting and financial reporting. His previous roles with the Company include Vice President, Planning with responsibility for financial, business and strategic planning, and Director of Planning. Prior to joining the Company, Mr. Rubino held various positions at International Business Machines Corporation and Price Waterhouse & Co. Mr. Rubino is a Certified Public Accountant and a member of the American Institute of Certified Public Accountants. Jack A. Smith has served as Senior Vice President, Chief Marketing Officer since joining the Company in June 2003 and is responsible for all branding, corporate and product marketing and communications, medco.com», and related creative and production services. Mr. Smith served as the Senior Vice President, Chief Marketing Officer for WellChoice, Inc. from August 1999 to November 2002, and was the Senior Vice President, Marketing Director for RR Donnelley & Sons from June 1997 to July 1999. Mr. Smith worked as a consultant for the Gartner Group, an information and consulting company, during 2003 prior to joining the Company. He has also held marketing positions at The Readers Digest Association, Inc., Nestle USA and Unilever PLC. Glenn C. Taylor has served as Group President, Key Accounts since January 2004. From April 2002 through December 2003, he served as Senior Vice President, Account Management. Mr. Taylor served as President of the Company’s UnitedHealth Group Division from February 1999 to April 2002. From April 1997 to January 1999, Mr. Taylor held positions with Merck & Co., Inc. as Regional Vice President of the Southeast and Central business groups. From May 1993 to March 1997, Mr. Taylor was the Company’s Senior Vice President of Sales and Account Management. Mr. Taylor joined the Company in May 1993 as a result of the Company’s acquisition of FlexRx, Inc., a pharmacy benefit manager in Pittsburgh, Pennsylvania, where Mr. Taylor was President. Timothy C. Wentworth has served as Group President, Employer Accounts since September 2008 and is responsible for all activities related to Medco’s employer clients including sales, account management, marketing, clinical and pricing areas. This group integrates the oversight of the National Accounts Group with Systemed. Prior to this position he served as the President and Chief Executive Officer of Accredo Health Group, Inc. from March 2006 to September 2008. From January 2004 to March 2006, Mr. Wentworth served as the Company’s Group President, National Accounts. From April 2002 through December 2003, he served as Executive Vice President, Client Strategy and Service and was responsible for client relationships and developing and implementing strategies to acquire and renew clients. Mr. Wentworth joined the Company as Senior Vice President, Account Management in December 1998 from Mary Kay, Inc., where he spent five years, serving initially as Senior Vice President of Human Resources and subsequently as President-International. 32
  • 45.
    PART II Item 5. Market for Registrant’s Common Equity, Related Shareholder Matters and Issuer Purchases of Equity Securities. Market Information The principal market for our common stock is the NYSE, where our common stock trades under the ticker symbol “MHS.” The following table sets forth the range of high and low common stock market prices for fiscal years 2009 and 2008: Fourth Quarter Third Quarter Second Quarter First Quarter 2009 High . . . . . . . . . . . . . . . . . . . $66.00 $56.82 $48.00 $48.95 Low. . . . . . . . . . . . . . . . . . . . $53.11 $44.53 $37.93 $36.46 2008 High . . . . . . . . . . . . . . . . . . . $47.85 $51.15 $52.00 $54.63 Low. . . . . . . . . . . . . . . . . . . . $29.80 $43.89 $42.85 $40.50 On February 17, 2010, the closing market price of our common stock on the NYSE was $63.76. Holders On February 17, 2010, there were 78,671 shareholders of record. Dividend Policy The Company currently does not pay cash dividends and does not plan to pay cash dividends in the foreseeable future. 33
  • 46.
    Comparative Stock Performance The following graph compares the cumulative total shareholder return on the Company’s common stock with the cumulative total return (including reinvested dividends) of the Standard & Poor’s Healthcare Index and the Standard & Poor’s 500 Index for the period December 31, 2004 to December 31, 2009. The graph assumes that $100 was invested on December 31, 2004, in the Company’s common stock and in each index or composite. No cash dividends have been declared on the Company’s common stock. COMPARISON OF 5 YEAR CUMULATIVE TOTAL RETURN Among Medco Health Solutions, Inc., the S&P 500 Index and the S&P Healthcare Index $350 $300 $250 $200 $150 $100 $50 $0 12/04 12/05 12/06 12/07 12/08 12/09 Medco Health Solutions, Inc. S&P 500 S&P Healthcare 12/04 12/05 12/06 12/07 12/08 12/09 Medco Health Solutions, Inc. . . . . . . . . . . . . . . . . . . . . . . . . . . . . . . . 100.00 134.13 128.46 243.75 201.49 307.26 S&P 500 . . . . . . . . . . . . . . . . . . . . . . . . . . . . . . . . . . . . . . . . . . . . . 100.00 104.91 121.48 128.16 80.74 102.11 S&P Healthcare . . . . . . . . . . . . . . . . . . . . . . . . . . . . . . . . . . . . . . . . 100.00 106.46 114.48 122.67 94.69 113.34 The comparisons in the graph above are provided in response to disclosure requirements of the SEC and are not intended to forecast or be indicative of future performance of the common stock. Share Repurchase Program The Company is currently authorized to repurchase its shares under a $3 billion share repurchase program, which expires in November 2010 (the “2008 Program”). The Company’s Board of Directors periodically reviews the Company’s share repurchase programs and approves the associated trading parameters. 34
  • 47.
    The following isa summary of the Company’s share repurchase activity for the three months ended December 26, 2009 under the 2008 Program: Issuer Purchases of Equity Securities(1) Total number of Approximate shares purchased dollar value of as part of a shares publicly that may yet be Total number Average announced purchased under of shares price paid program since the program(4) Fiscal Period purchased per share(2) inception(3) (in thousands) Balances at September 26, 2009 . . . . . 28,732,762 $1,792,905 September 27 to October 24, 2009 . . . — $ — — $1,792,905 October 25 to November 21, 2009 . . . . 809,500 $59.23 809,500 $1,744,960 November 22 to December 26, 2009 . . 2,901,928 $63.23 2,901,928 $1,561,458 Fourth quarter 2009 totals . . . . . . . . 3,711,428 $62.36 3,711,428 (1) All information set forth in the table above relates to the Company’s 2008 Program. The 2008 Program was announced in November 2008 and pursuant to the 2008 Program, the Company is authorized to repurchase up to $3 billion of its common stock through November 2010. (2) Dollar amounts include transaction costs. The total average price paid per share in the table above represents the average price paid per share for repurchases settled during the three months ended December 26, 2009. The average per-share cost for repurchases under the 2008 Program from inception through December 26, 2009 is $44.34. (3) The Company repurchased all of the above-referenced shares of its common stock through its publicly announced 2008 Program. (4) The balances at December 26, 2009 reflect the remaining authorized repurchases under the 2008 Program. From December 27, 2009 (the first day of the 2010 fiscal year) through February 19, 2010, the Company repurchased 12.8 million shares at a total cost of $804 million with an average per-share cost of $62.94 and has approximately $758 million remaining under its current authorization. During the fiscal year ended December 26, 2009, no equity securities of the Company were sold by the Company that were not registered under the Securities Act of 1933, as amended. 35
  • 48.
    Item 6. Selected Financial Data. The following table presents our selected historical consolidated financial and operating data. The selected historical financial and operating data should be read in conjunction with, and is qualified in its entirety by reference to, Part II, Item 7, “Management’s Discussion and Analysis of Financial Condition and Results of Operations,” and our audited consolidated financial statements and notes thereto included in Part II, Item 8 of this Annual Report on Form 10-K ($ and volumes in millions, except for per share data and EBITDA per adjusted prescription data): December 26, December 27, December 29, December 30, December 31, As of and for Fiscal Years Ended 2009 2008(1) 2007(2) 2006(3) 2005(4) (5) Consolidated statement of income data: Total product net revenues(6) . . . . . . . . . $58,961.4 $50,576.2 $43,961.9 $42,022.6 $37,455.0 Total service net revenues. . . . . . . . . . . 842.8 681.8 544.3 521.1 415.9 Total net revenues(6) . . . . . . . . . . . 59,804.2 51,258.0 44,506.2 42,543.7 37,870.9 Cost of revenues: Cost of product net revenues(6) . . . . . 55,523.1 47,308.2 41,402.6 40,012.5 35,827.8 Cost of service revenues . . . . . . . . . . 254.1 221.4 158.3 125.8 100.2 Total cost of revenues(6) . . . . . . . . 55,777.2 47,529.6 41,560.9 40,138.3 35,928.0 Selling, general and administrative expenses . . . . . . . . . . . . . . . . . . . 1,455.5 1,425.0 1,114.1 1,109.2 757.6 Amortization of intangibles . . . . . . . . 305.6 285.1 228.1 218.5 192.5 Interest expense . . . . . . . . . . . . . . . . 172.5 233.7 134.2 95.8 73.9 Interest (income) and other (income) expense, net . . . . . . . . . . . . . . . . . (9.9) (6.2) (34.4) (29.9) (34.0) Total costs and expenses . . . . . . . . 57,700.9 49,467.2 43,002.9 41,531.9 36,918.0 Income before provision for income taxes . . . . . . . . . . . . . . . . . . . . . . . 2,103.3 1,790.8 1,503.3 1,011.8 952.9 Provision for income taxes(9) (f) . . . . . . . 823.0 687.9 591.3 381.6 350.9 Net income . . . . . . . . . . . . . . . . . . . . . $ 1,280.3 $ 1,102.9 $ 912.0 $ 630.2 $ 602.0 Earnings per share data(7): Basic earnings per share . . . . . . . . . . . . $ 2.66 $ 2.17 $ 1.66 $ 1.06 $ 1.04 Shares used in computing basic earnings per share . . . . . . . . . . . . . . . . . . . . . 481.1 508.6 550.2 594.5 576.1 Diluted earnings per share . . . . . . . . . . $ 2.61 $ 2.13 $ 1.63 $ 1.04 $ 1.03 Shares used in computing diluted earnings per share . . . . . . . . . . . . . . 490.0 518.6 560.9 603.3 587.1 Consolidated balance sheet data: Working capital(8) . . . . . . . . . . . . . . . . $ 1,810.9 $ 1,299.5 $ 1,173.5 $ 1,028.2 $ 1,300.1 Goodwill . . . . . . . . . . . . . . . . . . . . . . $ 6,333.0 $ 6,331.4 $ 6,230.2 $ 5,108.7 $ 5,152.3 Intangible assets, net . . . . . . . . . . . . . . $ 2,428.8 $ 2,666.4 $ 2,905.0 $ 2,523.1 $ 2,741.6 Total assets . . . . . . . . . . . . . . . . . . . . . $17,915.5 $17,010.9 $16,217.9 $14,388.1 $14,447.7 Total debt . . . . . . . . . . . . . . . . . . . . . . $ 4,015.9 $ 4,602.9 $ 3,494.4 $ 1,266.7 $ 1,469.4 Deferred tax liabilities . . . . . . . . . . . . . $ 958.8 $ 1,065.3 $ 1,167.0 $ 1,161.3 $ 1,213.8 Total noncurrent liabilities . . . . . . . . . . $ 5,180.6 $ 5,255.0 $ 4,213.4 $ 2,057.8 $ 2,218.0 Total stockholders’ equity. . . . . . . . . . . $ 6,387.2 $ 5,957.9 $ 6,875.3 $ 7,503.5 $ 7,724.2 36
  • 49.
    December 26, December 27, December 29, December 30, December 31, As of and for Fiscal Years Ended 2009 2008(1) 2007(2) 2006(3) 2005(4) (5) Supplemental information: EBITDA(9) . . . . . . . . . . . . . . . . . . ... $ 2,750.5 $ 2,461.1 $ 2,000.1 $ 1,469.8 $ 1,350.3 EBITDA per adjusted prescription(9) ... $ 3.06 $ 3.09 $ 2.67 $ 2.01 $ 1.89 Net cash provided by operating activities . . . . . . . . . . . . . . . . . . ... $ 3,501.4 $ 1,635.1 $ 1,367.0 $ 1,241.0 $ 1,040.8 Net cash used by investing activities ... $ (305.0) $ (416.2) $(1,713.8) $ (155.5) $(1,186.3) Net cash (used by) provided by financing activities . . . . . . . . . . . . . . $(1,606.6) $(1,054.6) $ 302.4 $(1,155.2) $ (111.8) Prescriptions administered . . . . . . . . . . 694.5 586.0 559.8 553.4 540.1 Retail . . . . . . . . . . . . . . . . . . . . . . . 591.4 480.2 465.0 464.4 452.8 Mail-order. . . . . . . . . . . . . . . . . . . . 103.1 105.8 94.8 89.0 87.3 Adjusted prescriptions(9) (h) . . . . . . . . . . 898.8 795.9 748.3 729.9 714.1 Adjusted mail-order penetration(10) . . . . 34.2% 39.7% 37.9% 36.4% 36.6% Other volume(11) . . . . . . . . . . . . . . . . . 7.1 6.0 — — — Overall generic dispensing rate . . . . . . . 67.5% 64.1% 59.7% 55.2% 51.5% Retail generic dispensing rate . . . . . . 69.2% 66.0% 61.7% 57.2% 53.3% Mail-order generic dispensing rate . . . 57.8% 55.0% 50.0% 44.8% 41.7% Notes to Selected Financial Data: (1) The consolidated statement of income data for 2008 includes the operating results of majority-owned Europa Apotheek Venlo B.V. (“Europa Apotheek”) commencing on the April 28, 2008 acquisition date, and for the sub- sequent period. (2) The consolidated statement of income data for 2007 includes the operating results of PolyMedica Corporation (“PolyMedica”) and Critical Care Systems, Inc. (“Critical Care”) commencing on the October 31, 2007 and November 14, 2007 acquisition dates, respectively, and for the subsequent periods. (3) The consolidated statement of income data for 2006 includes a pre-tax legal settlements charge of $162.6 million recorded in the first quarter of 2006, with a $99.9 million after-tax effect, or $0.17 per diluted share on a split- adjusted basis (see note (7) below). (4) Fiscal 2005 represents a 53-week fiscal year. All other fiscal years presented are comprised of 52 weeks. (5) The consolidated statement of income data for 2005 includes the operating results of Accredo Health, Incorpo- rated (“Accredo”) commencing on the August 18, 2005 acquisition date, and for the subsequent periods. (6) Includes retail co-payments of $8,661 million for 2009, $7,666 million for 2008, $7,553 million for 2007, $7,394 million for 2006, and $7,436 million for 2005. (7) Common share and per share amounts have been retrospectively adjusted for the two-for-one stock split, which became effective on January 24, 2008. See Note 1, “Background and Basis of Presentation,” to our audited con- solidated financial statements included in Part II, Item 8 of this Annual Report on Form 10-K. (8) Calculated as current assets less current liabilities. (9) EBITDA consists of earnings before interest income/expense, taxes, depreciation and amortization. We calculate and use EBITDA and EBITDA per adjusted prescription as indicators of our ability to generate cash from our reported operating results. These measurements are used in concert with net income and cash flows from opera- tions, which measure actual cash generated in the period. In addition, we believe that EBITDA and EBITDA per adjusted prescription are supplemental measurement tools used by analysts and investors to help evaluate over- all operating performance and the ability to incur and service debt and make capital expenditures. EBITDA does not represent funds available for our discretionary use and is not intended to represent or to be used as a substi- tute for net income or cash flows from operations data as measured under U.S. generally accepted accounting principles. The items excluded from EBITDA, but included in the calculation of reported net income, are signifi- cant components of the consolidated statements of income and must be considered in performing a comprehen- sive assessment of overall financial performance. EBITDA, and the associated year-to-year trends, should not be considered in isolation. Our calculation of EBITDA may not be consistent with calculations of EBITDA used by other companies. Additionally, we have calculated the 2006 EBITDA excluding the legal settlements charge recorded in the first quarter, as the charge is not considered an indicator of ongoing company performance. 37
  • 50.
    EBITDA per adjustedprescription is calculated by dividing EBITDA by the adjusted prescription volume for the period. This measure is used as an indicator of EBITDA performance on a per-unit basis, providing insight into the cash-generating potential of each prescription. EBITDA, and as a result, EBITDA per adjusted prescription, are affected by the changes in prescription volumes between retail and mail-order, the relative representation of brand-name, generic and specialty pharmacy drugs, as well as the level of efficiency in the business. Adjusted prescription volume equals substantially all mail-order prescriptions multiplied by three, plus retail prescrip- tions. These mail-order prescriptions are multiplied by three to adjust for the fact that they include approxi- mately three times the amount of product days supplied compared with retail prescriptions. The following table reconciles our reported net income to EBITDA and presents EBITDA per adjusted prescrip- tion for each of the respective periods (in millions, except for EBITDA per adjusted prescription data): December 26, December 27, December 29, December 30, December 31, For Fiscal Years Ended 2009 2008(a) 2007(b) 2006 2005(c) (d) Net income . . . . . . . . . . . . . . . . . . . . . . . . . . . $1,280.3 $1,102.9 $ 912.0 $ 630.2 $ 602.0 Add: Interest expense . . . . . . . . . . . . . . . . . . . . . . 172.5 233.7 134.2 95.8 73.9 Interest (income) and other (income) expense, (e) net . . . . . . . . . . . . . . . . . . . . . . . . . . . . . (9.9) (6.2) (34.4) (29.9) (34.0) (f) (f) (f) (f) Provision for income taxes . . . . . . . . . . . . . . . 823.0 687.9 591.3 381.6 350.9 Depreciation expense . . . . . . . . . . . . . . . . . . . 179.0 157.7 168.9 173.6 165.0 Amortization expense . . . . . . . . . . . . . . . . . . 305.6 285.1 228.1 218.5 192.5 EBITDA . . . . . . . . . . . . . . . . . . . . . . . . . . . . $2,750.5 $2,461.1 $2,000.1 $1,469.8 $1,350.3 (g) Adjustment for the 2006 legal settlements charge . . — — — 162.6 — EBITDA, excluding the 2006 legal settlements charge . . . . . . . . . . . . . . . . . . . . . . . . . . . . $2,750.5 $2,461.1 $2,000.1 $1,632.4 $1,350.3 Adjusted prescriptions(h) . . . . . . . . . . . . . . . . . . 898.8 795.9 748.3 729.9 714.1 EBITDA per adjusted prescription . . . . . . . . . . . . $ 3.06 $ 3.09 $ 2.67 $ 2.01 $ 1.89 EBITDA per adjusted prescription, excluding the 2006 legal settlements charge . . . . . . . . . . . . . $ 3.06 $ 3.09 $ 2.67 $ 2.24 $ 1.89 (a) Includes majority-owned Europa Apotheek’s operating results commencing on the April 28, 2008 acquisi- tion date, and for the subsequent period. (b) Includes PolyMedica’s and Critical Care’s operating results commencing on the October 31, 2007 and November 14, 2007 acquisition dates, respectively, and for the subsequent periods. (c) Fiscal 2005 represents a 53-week fiscal year. All other fiscal years presented are comprised of 52 weeks. (d) Includes Accredo’s operating results commencing on the August 18, 2005 acquisition date, and for the sub- sequent periods. (e) Includes a $9.8 million charge for the ineffective portion of the forward-starting interest rate swap agree- ments associated with the March 2008 issuance of senior notes. See Note 8, “Debt,” to our audited consol- idated financial statements included in Part II, Item 8 of this Annual Report on Form 10-K. (f) 2009, 2008, 2006 and 2005 include tax benefits of $22 million, $28 million, $20 million and $25.7 million, respectively. See Note 10, “Taxes on Income,” to our audited consolidated financial statements included in Part II, Item 8 of this Annual Report on Form 10-K. (g) Represents a pre-tax legal settlements charge of $162.6 million recorded in the first quarter of 2006. See note (3) to Selected Financial Data above. (h) Adjusted prescription volume equals substantially all mail-order prescriptions multiplied by three, plus retail prescriptions. These mail-order prescriptions are multiplied by three to adjust for the fact that they include approximately three times the amount of product days supplied compared with retail prescriptions. (10) The percentage of adjusted mail-order prescriptions to total adjusted prescriptions. (11) Represents over-the-counter drugs, as well as diabetes supplies primarily dispensed by PolyMedica. 38
  • 51.
    Item 7. Management’s Discussion and Analysis of Financial Condition and Results of Operations. Overview We are a leading healthcare company that is pioneering the world’s most advanced pharmacy» and our clinical research and innovations are part of Medco making medicine smarterTM for approximately 65 million members. Medco provides clinically-driven pharmacy services designed to improve the quality of care and lower total healthcare costs for private and public employers, health plans, labor unions and government agencies of all sizes, and for individuals served by Medicare Part D Prescription Drug Plans. Our unique Medco Therapeutic Resource Centers», which conduct therapy management programs using Medco specialist pharmacists who have expertise in the medications used to treat certain chronic conditions, and Accredo Health Group, Medco’s Specialty Pharmacy, represent innovative models for the care of patients with chronic and complex conditions. Our business model requires collaboration with retail pharmacies, physicians, the Centers for Medicare & Medicaid Services (“CMS”) for Medicare, pharmaceutical manufacturers and, particularly in Specialty Pharmacy, collaboration with state Medicaid agencies, and other third-party payors such as health insurers. Our programs and services help control the cost and enhance the quality of prescription drug benefits. We accomplish this by providing pharmacy benefit management (“PBM”) services through our national networks of retail pharmacies and our own mail-order pharmacies, as well as through Accredo Health Group, which we believe is the nation’s largest specialty pharmacy based on revenues. Medco’s Therapeutic Resource Center focused on diabetes was augmented with the 2007 acquisition of PolyMedica Corporation (“PolyMedica”), through which we believe we became the largest diabetes pharmacy care practice based on covered patients. In 2008, we also extended our capabilities abroad when we acquired a majority interest in Europa Apotheek Venlo B.V. (“Europa Apotheek”), a privately held company based in the Netherlands that primarily provides mail-order pharmacy services in Germany. See Note 3, “Acquisi- tions of Businesses,” to our audited consolidated financial statements included in Part II, Item 8 of this Annual Report on Form 10-K for more information. In 2009, Medco advanced its European healthcare initiatives through a joint venture with United Drug plc, a pan-European healthcare leader, to provide home-based pharmacy care services in the United Kingdom for patients covered by the country’s National Health Service. Additionally, our commitment to advancing the science of personalized medicine is further demonstrated by our January 2010 acquisition of DNA Direct, Inc., a leader in providing guidance and decision support to payors, physicians and patients, on a range of complex issues related to genomic medicine. All share and per share amounts have been retrospectively adjusted for the two-for-one common stock split, effected in the form of a 100% stock dividend, which became effective January 24, 2008. See Note 1, “Background and Basis of Presentation,” to our audited consolidated financial statements included in Part II, Item 8 of this Annual Report on Form 10-K. The complicated environment in which we operate presents us with opportunities, challenges and risks. Our clients and members are paramount to our success; the retention of existing clients and members and winning of new clients and members poses the greatest opportunity to us and the loss thereof represents an ongoing risk. The preservation of our relationships with pharmaceutical manufacturers, biopharmaceutical manufacturers and retail pharmacies is very important to the execution of our business strategies. Our future success will be largely dependent on our ability to drive mail-order volume and increase generic dispensing rates in light of the significant brand-name drug patent expirations expected to occur over the next several years, as well as our ability to continue to provide innovative and competitive clinical and other services to clients and members, including through our active participation in the Medicare Part D Prescription Drug Plan (“Medicare Part D”) benefit, the rapidly growing specialty pharmacy industry and our Therapeutic Resource Centers. Additionally, our future success will depend on our continued ability to generate positive cash flows from operations with a keen focus on asset management and maximizing return on invested capital (“ROIC”). Our financial performance benefits from the diversity of our client base and our clinically-driven business model, which we believe provides better outcomes at lower costs for our clients. We actively monitor the status of our accounts receivable and have mechanisms in place to minimize the potential for incurring material accounts receivable credit risk. To date, we have not experienced any significant deterioration in our client or manufacturer rebates accounts receivable. 39
  • 52.
    We are veryfocused on managing our ROIC to ensure we drive the highest level of returns to our shareholders. We believe there is a close correlation between strong ROIC and long-term shareholder value and as such, we commenced in 2009 including ROIC as a component in our performance grid, which is a basis for providing bonuses to our employees. When we use “Medco,” “we,” “us” and “our,” we mean Medco Health Solutions, Inc., a Delaware corporation, and its consolidated subsidiaries. When we use the term “mail order,” we mean inventory dispensed through Medco’s mail-order pharmacy operations. Key Indicators Reviewed By Management Management reviews the following indicators in analyzing our consolidated financial performance: net revenues, with a particular focus on mail-order revenue; adjusted prescription volume; generic dispensing rate; gross margin percentage; retail pharmacy reimbursement rates; cash flow from operations; return on invested capital; diluted earnings per share; Specialty Pharmacy segment revenue and operating income; Earnings Before Interest Income/Expense, Taxes, Depreciation, and Amortization (“EBITDA”); and EBITDA per adjusted prescription. See “—EBITDA” further below for a definition and calculation of EBITDA and EBITDA per adjusted prescription. We believe these measures highlight key business trends and are important in evaluating our overall performance. 2009 Financial Performance Summary Our diluted earnings per share increased 22.5% to $2.61 and net income increased 16.1% to $1,280.3 million for 2009 compared to $2.13 per share and $1,102.9 million, respectively, for 2008. These increases primarily reflect higher generic dispensing rates, favorable retail pharmacy reimbursement rates and retail volumes, growth in the Specialty Pharmacy business and service margin, as well as a decrease in the diluted weighted average shares outstanding. These are partially offset by lower mail-order brand-name volumes, steeper client price discounts associated with new clients and renewals of existing clients, and decreased manufacturer rebate retention rates. In addition, these results include the operating results of majority-owned Europa Apotheek commencing on the April 28, 2008 acquisition date. For the year ended December 26, 2009, we generated cash flow from operations of $3,501.4 million and had cash and cash equivalents of $2,528.2 million on our consolidated balance sheet at December 26, 2009. The diluted weighted average shares outstanding were 490.0 million for 2009 compared to 518.6 million for 2008, representing a decrease of 5.5% resulting primarily from our share repurchase programs. Our total net revenues increased 16.7% to $59,804.2 million in 2009. Product net revenues increased 16.6% to $58,961.4 million, which reflects product price inflation primarily on brand-name drugs, as well as higher retail volume driven by new business, partially offset by a greater representation of lower-priced generic drugs and higher client price discounts, as well as lower mail-order brand-name volumes. Additionally, our service revenues increased 23.6% to $842.8 million in 2009, which reflects higher client and other service revenues primarily from higher claims processing administrative fees and higher revenue associated with Medicare Part D-related product offerings. The total adjusted prescription volume, which adjusts mail-order prescription volume for the difference in days supply between mail order and retail, increased 12.9% to 898.8 million for 2009 and substantially reflects higher retail volumes attributed to new clients. The higher volume of retail prescriptions also resulted in a decrease in the adjusted mail-order penetration rate from 39.7% in 2008 to 34.2% in 2009. Our overall generic dispensing rate increased to 67.5% in 2009 from 64.1% in 2008, reflecting the impact of the introduction of new generic products during these periods, heightened use of previously released generics, and the effect of client plan design changes promoting the use of lower-priced and more steeply discounted generics. Higher generic volumes, which contribute to lower costs for clients and members, resulted in a reduction in net revenues of approximately $2,430 million for 2009. 40
  • 53.
    Our overall grossmargin decreased to 6.7% in 2009 from 7.3% in 2008, primarily reflecting the higher mix of retail prescriptions. The gross margin percentage was favorably impacted by increased generic dispensing rates, retail pharmacy reimbursement rates, and service margin, partially offset by higher client price discounts and lower rebate retention. Selling, general and administrative (“SG&A”) expenses of $1,455.5 million for 2009 increased by $30.5 million, or 2.1%, from 2008, reflecting enterprise-wide efficiencies, while adding significant amounts of new business and continuing to invest in our differentiating initiatives. This increase primarily reflects higher performance-related and stock-based compensation expenses, as well as higher depreciation expense. Amortization of intangible assets of $305.6 million for 2009 increased $20.5 million from 2008, reflecting additional intangible amortization from PolyMedica associated with the Liberty trade name and patient list acquisitions, as well as increased intangible amortization as a result of the April 28, 2008 acquisition of a majority interest in Europa Apotheek. Interest expense of $172.5 million for 2009 decreased $61.2 million from 2008, primarily reflecting lower interest rates on the floating rate components of outstanding debt. Additionally, total debt was reduced as there were repayments on the accounts receivable financing facility of $600 million during 2009. Interest (income) and other (income) expense, net, of ($9.9) million for 2009 increased $3.7 million from ($6.2) million in 2008, reflecting a first-quarter 2008 charge for the ineffective portion of the forward-starting interest rate swap agreements associated with our March 2008 issuance of senior notes, which is described further below under “—Liquidity and Capital Resources—Financing Facilities—Swap Agreements.” This is partially offset by decreased interest income reflecting lower interest rates on higher cash balances. Our effective tax rate (defined as the percentage relationship of provision for income taxes to income before provision for income taxes) was 39.1% for 2009 compared to 38.4% for 2008. The lower effective tax rate in 2008 reflects a third-quarter 2008 net state income tax benefit of $28 million, partially offset by a fourth-quarter 2009 income tax benefit of $22 million. Key Financial Statement Components Consolidated Statements of Income Our net revenues are comprised primarily of product net revenues and are derived principally from the sale of prescription drugs through our networks of contractually affiliated retail pharmacies and through our mail-order pharmacies, and are recorded net of certain discounts, rebates and guarantees payable to clients and members. The majority of our product net revenues are derived on a fee-for-service basis. Product net revenues also include revenues from the sale of diabetes supplies by PolyMedica. Our Specialty Pharmacy product net revenues represent revenues from the sale of primarily biopharmaceutical drugs and are reported at the net amount billed to third-party payors and patients. In addition, our product net revenues include premiums associated with our Medicare Part D Prescription Drug Program (“PDP”) risk-based product offerings. These products involve prescription dispensing for beneficiaries enrolled in the CMS-sponsored Medicare Part D prescription drug benefit. Our two insurance company subsidiaries have been operating under contracts with CMS since 2006, and currently offer several Medicare PDP options. The products involve underwriting the benefit, charging enrollees applicable premiums, providing covered prescription drugs and administering the benefit as filed with CMS. We provide three Medicare drug benefit plan options for beneficiaries, including (i) a “standard Part D” benefit plan as mandated by statute, and (ii) two benefit plans with enhanced coverage, that exceed the standard Part D benefit plan, available for an additional premium. We also offer numerous customized benefit plan designs to employer group retiree plans under the Medicare Part D prescription drug benefit. 41
  • 54.
    The PDP premiumsare determined based on our annual bid and related contractual arrangements with CMS. The PDP premiums are primarily comprised of amounts received from CMS as part of a direct subsidy and an additional subsidy from CMS for low-income member premiums, as well as premium payments received from members. These premiums are recognized ratably to product net revenues over the period in which members are entitled to receive benefits. Premiums received in advance of the applicable benefit period are deferred and recorded in accrued expenses and other current liabilities on the consolidated balance sheets. There is a possibility that the annual costs of drugs may be higher or lower than premium revenues. As a result, CMS provides a risk corridor adjustment for the standard drug benefit that compares our actual annual drug costs incurred to the targeted premiums in our CMS-approved bid. Based on specific collars in the risk corridor, we will receive from CMS additional premium amounts or be required to refund to CMS previously received premium amounts. We calculate the risk corridor adjustment on a quarterly basis based on drug cost experience to date and record an adjustment to product net revenues with a corresponding account receivable from or payable to CMS reflected on the consolidated balance sheets. In addition to premiums, there are certain co-payments and deductibles (the “cost share”) due from members based on prescription orders by those members, some of which are subsidized by CMS in cases of low-income membership. For subsidies received in advance, the amount is deferred and recorded in accrued expenses and other current liabilities on the consolidated balance sheets. If there is cost share due from members or CMS, the amount is accrued and recorded in client accounts receivable, net, on the consolidated balance sheets. After the end of the contract year and based on actual annual drug costs incurred, cost share amounts are reconciled with CMS and the corresponding receivable or payable is settled. The cost share is treated consistently as other co-payments derived from providing PBM services, as a component of product net revenues on the consolidated statements of income where the requirements of Authoritative Guidance are met. For further details, see our critical accounting policies included in “—Use of Estimates and Critical Accounting Policies and Estimates” below and Note 2, “Summary of Significant Accounting Policies,” to our audited consolidated financial statements included in Part II, Item 8 of this Annual Report on Form 10-K. Premium revenues for our PDP products, which exclude member cost share, were $543 million, or less than 1% of total net revenues, in 2009, $317 million, or less than 1% of total net revenues, in 2008, and $255 million, or less than 1% of total net revenues, in 2007. Our agreements with CMS, as well as applicable Medicare Part D regulations and federal and state laws, require us to, among other obligations: (i) comply with certain disclosure, filing, record-keeping and marketing rules; (ii) operate quality assurance, drug utilization management and medication therapy management programs; (iii) support e-prescribing initiatives; (iv) implement grievance, appeals and formulary exception processes; (v) com- ply with payment protocols, which include the return of overpayments to CMS and, in certain circumstances, coordination with state pharmacy assistance programs; (vi) use approved networks and formularies, and provide access to such networks to “any willing pharmacy;” (vii) provide emergency out-of-network coverage; and (viii) implement a comprehensive Medicare and Fraud, Waste and Abuse compliance program. We have various contractual and regulatory compliance requirements associated with participating in Medicare Part D. Similar to our requirements with other clients, our policies and practices associated with executing our PDP are subject to audit. If material contractual or regulatory non-compliance was to be identified, monetary penalties and/or applicable sanctions, including suspension of enrollment and marketing or debarment from participation in Medicare programs, may be imposed. Additionally, each calendar year, payment will vary based on the annual benchmark that applies as a result of Medicare Part D plan bids for the applicable year, as well as for changes in the CMS methodology for calculating risk adjustment factors. Service revenues consist principally of administrative fees and clinical program fees earned from clients, sales of prescription services to pharmaceutical manufacturers, performance-oriented fees paid by Specialty Pharmacy manufacturers, and other non-product-related revenues. 42
  • 55.
    Cost of revenuesis comprised primarily of cost of product net revenues and is principally attributable to the dispensing of prescription drugs. Cost of product net revenues for prescriptions dispensed through our networks of retail pharmacies are comprised of the contractual cost of drugs dispensed by, and professional fees paid to, retail pharmacies in the networks, including the associated member co-payments. Our cost of product net revenues relating to drugs dispensed by our mail-order pharmacies consists primarily of the cost of inventory dispensed and our costs incurred to process and dispense the prescriptions, including the associated fixed asset depreciation. The operating costs of our call center pharmacies are also included in cost of product net revenues. In addition, cost of product net revenues includes a credit for rebates earned from brand-name pharmaceutical manufacturers whose drugs are included in our formularies. These rebates generally take the form of formulary rebates, which are earned based on the volume of a specific drug dispensed, or market share rebates, which are earned based on the achievement of contractually specified market share levels. Our cost of product net revenues also includes the cost of drugs dispensed by our mail-order pharmacies or retail network for members covered under our Medicare PDP product offerings and are recorded at cost as incurred. We receive a catastrophic reinsurance subsidy from CMS for approximately 80% of costs incurred by individual members in excess of the individual annual out-of-pocket maximum of $4,350 for coverage year 2009, $4,050 for coverage year 2008, and $3,850 for coverage year 2007. The subsidy is reflected as an offsetting credit in cost of product net revenues to the extent that catastrophic costs are incurred. Catastrophic reinsurance subsidy amounts received in advance are deferred and recorded in accrued expenses and other current liabilities on the consolidated balance sheets. If there are catastrophic reinsurance subsidies due from CMS, the amount is accrued and recorded in client accounts receivable, net, on the consolidated balance sheets. After the end of the contract year and based on actual annual drug costs incurred, catastrophic reinsurance amounts are reconciled with CMS and the corresponding receivable or payable is settled. Cost of service revenues consist principally of labor and operating costs for delivery of services provided, as well as costs associated with member communication materials. SG&A expenses reflect the costs of operations dedicated to executive management, the generation of new sales, maintenance of existing client relationships, management of clinical programs, enhancement of technology capabil- ities, direction of pharmacy operations, and performance of reimbursement activities, in addition to finance, legal and other staff activities, and the effect of certain legal settlements. SG&A also includes direct response advertising expenses associated with PolyMedica, which are expensed as incurred. Interest expense is incurred on our senior unsecured bank credit facilities, accounts receivable financing facility and other short-term debt, and senior notes, and includes net interest on our interest rate swap agreements on $200 million of the $500 million of 7.25% senior notes due in 2013. In addition, it includes amortization of the effective portion of our settled forward-starting interest rate swap agreements and amortization of debt issuance costs. Interest (income) and other (income) expense, net, includes interest income generated by cash and cash equivalent investments, as well as short-term and long-term investments in marketable securities. In addition, it includes a loss on the ineffective portion of the settled forward-starting interest rate swap agreements recorded in the first quarter of 2008. For further details, see our critical accounting policies included in “—Use of Estimates and Critical Accounting Policies and Estimates” below and Note 2, “Summary of Significant Accounting Policies,” to our audited consolidated financial statements included in Part II, Item 8 of this Annual Report on Form 10-K. Consolidated Balance Sheets Our primary assets include cash and cash equivalents, short-term and long-term investments, manufacturer accounts receivable, client accounts receivable, inventories, fixed assets, deferred tax assets, goodwill and intangible assets. Cash and cash equivalents reflect the accumulation of net positive cash flows from our operations, investing and financing activities, and primarily include time deposits with banks or other financial institutions, and money market mutual funds. Our short-term and long-term investments include U.S. government securities that are held to satisfy statutory capital requirements for our insurance subsidiaries. 43
  • 56.
    Manufacturer accounts receivablebalances primarily include amounts due from brand-name pharmaceutical manufacturers for earned rebates and other prescription services. Client accounts receivable represent amounts due from clients, other payors and patients for prescriptions dispensed from retail pharmacies in our networks or from our mail-order pharmacies, including fees due to us, net of allowances for doubtful accounts, as well as contractual allowances and any applicable rebates and guarantees payable when these payables are settled on a net basis in the form of an invoice credit. In cases where rebates and guarantees are settled with the client on a net basis, and the rebates and guarantees payable are greater than the corresponding client accounts receivable balances, the net liability is reclassified to client rebates and guarantees payable. When these payables are settled in the form of a check or wire, they are recorded on a gross basis and the entire liability is reflected in client rebates and guarantees payable. Our client accounts receivable also includes receivables from CMS for our Medicare PDP product offerings and premiums from members. Additionally, we have receivables from Medicare and Medicaid for a portion of our Specialty Pharmacy business, and diabetes supplies dispensed by PolyMedica. Inventories reflect the cost of prescription products held for dispensing by our mail-order pharmacies and are recorded on a first-in, first-out basis, net of allowances for losses. Deferred tax assets primarily represent temporary differences between the financial statement basis and the tax basis of certain accrued expenses, stock-based compensation, and client rebate pass-back liabilities. Income taxes receivable represents amounts due from the IRS and state and local taxing authorities associated primarily with the approval of a favorable accounting method change received from the IRS in 2006 for the timing of the deductibility of certain rebates passed back to clients. Fixed assets include investments in our corporate headquarters, mail-order pharmacies, call center pharmacies, account service offices, and information technology, including capitalized software development. Goodwill and intangible assets are comprised primarily of the goodwill and intangibles that had been pushed down to our consolidated balance sheets and existed when we became an independent, publicly traded enterprise in 2003, goodwill and intangibles recorded upon our acquisition in 2007 of PolyMedica, and, for the Specialty Pharmacy segment, goodwill and intangible assets recorded primarily from our acquisition of Accredo Health, Incorporated (“Accredo”) in 2005 and Critical Care Systems, Inc. (“Critical Care”) in 2007. Our primary liabilities include claims and other accounts payable, client rebates and guarantees payable, accrued expenses and other current liabilities, debt and deferred tax liabilities. Claims and other accounts payable primarily consist of amounts payable to retail network pharmacies for prescriptions dispensed and services rendered by the retail pharmacies, as well as amounts payable for mail-order prescription inventory purchases and other purchases made in the normal course of business. Client rebates and guarantees payable include amounts due to clients that will ultimately be settled in the form of a check or wire, as well as any residual liability in cases where the payable is settled as an invoice credit and exceeds the corresponding client accounts receivable balances. Accrued expenses and other current liabilities primarily consist of employee- and facility-related cost accruals incurred in the normal course of business, as well as income taxes payable. Accrued expenses and other current liabilities are also comprised of certain premiums, and may also include cost share, and catastrophic reinsurance payments received in advance from CMS for our Medicare PDP product offerings. Our debt is primarily comprised of a senior unsecured term loan facility, a senior unsecured revolving credit facility, senior notes and an accounts receivable financing facility. In addition, we have a net deferred tax liability primarily associated with our recorded intangible assets. We do not have any material off-balance sheet arrangements, other than purchase commitments and lease obligations. See “—Commitments and Contractual Obligations” below. Our stockholders’ equity includes an offset for purchases of our common stock under our share repurchase program. The accumulated other comprehensive income component of stockholders’ equity includes: unrealized investment gains and losses, foreign currency translation adjustments resulting primarily from the translation of Europa Apotheek’s assets and liabilities and results of operations, unrealized gains and losses on effective cash flow hedges, and the net gains and losses and prior service costs and credits related to our pension and other postretirement benefit plans. Consolidated Statements of Cash Flows An important element of our operating cash flows is the timing of billing cycles, which are generally two-week periods of accumulated billings for retail and mail-order prescriptions. We bill the cycle activity to clients on this bi- weekly schedule and generally collect from our clients before we pay our obligations to the retail pharmacies for that same cycle. At the end of any given reporting period, unbilled PBM receivables can represent up to two weeks of dispensing activity and will fluctuate at the end of a fiscal month depending on the timing of these billing cycles. A portion of the Specialty Pharmacy business includes reimbursement by payors, such as insurance companies, under a medical benefit, or by Medicare or Medicaid. These transactions also involve higher patient co-payments than experienced in the PBM business. As a result, this portion of the Specialty Pharmacy business, which yields a higher margin than the PBM business, experiences slower accounts receivable turnover than in the aforementioned PBM cycle and has a different credit risk profile. Our operating cash flows are also impacted by timing associated with our Medicare PDP product offerings, including premiums, cost share, and catastrophic reinsurance received from CMS. In addition, our operating cash flows include tax benefits for employee stock plans up to the amount associated with compensation expense. 44
  • 57.
    Ongoing operating cashflows are associated with expenditures to support our mail-order, retail pharmacy network operations, call center pharmacies and other SG&A functions. The largest components of these expenditures include payments to retail pharmacies; mail-order inventory purchases, which are paid in accordance with payment terms offered by our suppliers to take advantage of appropriate discounts, rebate and guarantee payments to clients; employee payroll and benefits; facility operating expenses and income taxes. In addition, earned brand-name pharmaceutical manufacturers’ rebates are recorded monthly based upon prescription dispensing, with actual bills rendered on a quarterly basis and paid by the manufacturers within an agreed-upon term. Payments of rebates to clients are generally made after our receipt of the rebates from the brand-name pharmaceutical manufacturers, although some clients may receive more accelerated rebate payments in exchange for other elements of pricing in their contracts. Ongoing investing cash flows are primarily associated with capital expenditures including technology invest- ments, as well as purchases of securities and other assets, and proceeds from securities and other investments, which primarily relate to investment activities of our insurance companies. Acquisitions will also generally result in cash outflows from investing activities. Our financing cash flows primarily include share repurchases, proceeds from debt, interest and principal payments on our outstanding debt, proceeds from employee stock plans, and the benefits of realized tax deductions in excess of tax benefits on compensation expense. Clients We have clients in a broad range of industry categories, including various Blue Cross/Blue Shield plans; managed care organizations; insurance carriers; third-party benefit plan administrators; employers; federal, state and local government agencies; and union-sponsored benefit plans. For fiscal years 2009, 2008 and 2007, our ten largest clients based on revenue accounted for approximately 49%, 45% and 45% of our net revenues, respectively, including UnitedHealth Group Incorporated (“UnitedHealth Group”), our largest client, which represented approxi- mately $11,300 million, or 19%, $11,000 million, or 21%, and $9,900 million, or 22%, of our net revenues, respectively. The UnitedHealth Group account has a lower than average mail-order penetration and, because of its size, steeper pricing than the average client, and consequently generally yields lower profitability as a percentage of net revenues than smaller client accounts. In addition, with respect to mail-order volume, which is an important contributor to our overall profitability, the mail-order volume associated with this account represented less than 10% of our overall mail-order volume for fiscal years 2009, 2008 and 2007, respectively. Under our current agreement with UnitedHealth Group, we are providing pharmacy benefit services through December 31, 2012. None of our other clients individually represented more than 10% of our net revenues in 2009, 2008 or 2007. Segment Discussion We have two reportable segments, PBM and Specialty Pharmacy. The PBM segment involves sales of traditional prescription drugs and supplies to our clients and members, either through our network of contractually affiliated retail pharmacies or our mail-order pharmacies. The PBM segment also includes the operating results of PolyMedica, a provider of diabetes testing supplies and related products, as well as majority-owned Europa Apotheek, which primarily provides mail-order pharmacy services in Germany, commencing on their respective acquisition dates. The Specialty Pharmacy segment includes the sale of higher-margin specialty pharmacy products and services for the treatment of chronic and complex (potentially life-threatening) diseases including specialty infusion services. We define the Specialty Pharmacy segment based on a product set and associated services, broadly character- ized to include drugs that are high-cost, usually developed by biotechnology companies and often injectable or infusible, and which require elevated levels of patient support. When dispensed, these products frequently require ancillary administration equipment, special packaging, and a higher degree of patient-oriented customer service than is required in the traditional PBM business model, including in-home nursing services and administration. In addition, specialty pharmacy products and services are often covered through medical benefit programs with the primary payors being insurance companies and government programs. Additionally, payors include patients, as well as PBM clients. The PBM segment is measured and managed on an integrated basis, and there is no distinct measurement that separates the performance and profitability of mail order and retail. We offer fully integrated PBM services to virtually all of our PBM clients and their members. The PBM services we provide to our clients are generally delivered and managed under a single contract for each client. The PBM and Specialty Pharmacy segments primarily operate in the United States and have limited activity in Puerto Rico, Germany and the United Kingdom. As a result of the nature of our integrated PBM services and contracts, the chief operating decision maker views Medco’s PBM operations as a single segment for purposes of making decisions about resource allocations and in assessing performance. 45
  • 58.
    Consolidated Results ofOperations The following table presents selected consolidated comparative results of operations and volume performance ($ and volumes in millions): December 26, December 27, December 29, For Fiscal Years Ended 2009 Variance 2008(1) Variance 2007(2) Net Revenues Retail product(3) . . . . . . . . . . $36,596.4 $7,982.9 27.9% $28,613.5 $2,189.4 8.3% $26,424.1 Mail-order product . . . . . . . . 22,365.0 402.3 1.8% 21,962.7 4,424.9 25.2% 17,537.8 Total product(3) . . . . . . . . . . . $58,961.4 $8,385.2 16.6% $50,576.2 $6,614.3 15.0% $43,961.9 Client and other service . . . . . 685.0 182.8 36.4% 502.2 111.2 28.4% 391.0 Manufacturer service . . . . . . . 157.8 (21.8) (12.1)% 179.6 26.3 17.2% 153.3 Total service . . . . . . . . . . . . . $ 842.8 $ 161.0 23.6% $ 681.8 $ 137.5 25.3% $ 544.3 (3) Total net revenues ....... $59,804.2 $8,546.2 16.7% $51,258.0 $6,751.8 15.2% $44,506.2 Cost of Revenues Product(3) . . . . . . . . . . . . . . . $55,523.1 $8,214.9 17.4% $47,308.2 $5,905.6 14.3% $41,402.6 Service . . . . . . . . . . . . . . . . 254.1 32.7 14.8% 221.4 63.1 39.9% 158.3 Total cost of revenues(3) . . . . . $55,777.2 $8,247.6 17.4% $47,529.6 $5,968.7 14.4% $41,560.9 (4) Gross Margin Product . . . . . . . . . . . . .... $ 3,438.3 $ 170.3 5.2% $ 3,268.0 $ 708.7 27.7% $ 2,559.3 Product gross margin percentage . . . . . . . . .... 5.8% (0.7)% 6.5% 0.7% 5.8% Service . . . . . . . . . . . . .... $ 588.7 $ 128.3 27.9% $ 460.4 $ 74.4 19.3% $ 386.0 Service gross margin percentage . . . . . . . . .... 69.9% 2.4% 67.5% (3.4)% 70.9% Total gross margin. . . . . .... $ 4,027.0 $ 298.6 8.0% $ 3,728.4 $ 783.1 26.6% $ 2,945.3 Gross margin percentage .... 6.7% (0.6)% 7.3% 0.7% 6.6% Volume Information Retail prescriptions . . . . .... 591.4 111.2 23.2% 480.2 15.2 3.3% 465.0 Mail-order prescriptions . .... 103.1 (2.7) (2.6)% 105.8 11.0 11.6% 94.8 Total prescriptions . . . . . . . . . 694.5 108.5 18.5% 586.0 26.2 4.7% 559.8 Adjusted prescriptions(5) . . . . 898.8 102.9 12.9% 795.9 47.6 6.4% 748.3 Adjusted mail-order penetration(6) . . . . . . . . . . . 34.2% (5.5)% 39.7% 1.8% 37.9% Other volume(7) . . . . . . . . . . . 7.1 1.1 18.3% 6.0 6.0 N/M* — Generic Dispensing Rate Information Retail generic dispensing rate . . . . . . . . . . . . . . . . . 69.2% 3.2% 66.0% 4.3% 61.7% Mail-order generic dispensing rate . . . . . . . . . . . . . . . . . 57.8% 2.8% 55.0% 5.0% 50.0% Overall generic dispensing rate . . . . . . . . . . . . . . . . . 67.5% 3.4% 64.1% 4.4% 59.7% * Not meaningful. (1) Includes majority-owned Europa Apotheek’s operating results commencing on the April 28, 2008 acquisition date, and for the subsequent period. (2) Includes PolyMedica’s and Critical Care’s operating results commencing on the October 31, 2007 and Novem- ber 14, 2007 acquisition dates, respectively, and for the subsequent periods. (3) Includes retail co-payments of $8,661 million for 2009, $7,666 million for 2008, and 7,553 million for 2007. (4) Defined as net revenues minus cost of revenues. (5) Adjusted prescription volume equals substantially all mail-order prescriptions multiplied by three, plus retail prescriptions. These mail-order prescriptions are multiplied by three to adjust for the fact that they include approximately three times the amount of product days supplied compared with retail prescriptions. (6) The percentage of adjusted mail-order prescriptions to total adjusted prescriptions. (7) Represents over-the-counter drugs, as well as diabetes supplies primarily dispensed by PolyMedica. 46
  • 59.
    Net Revenues Retail. The increase in retail net revenues of $7,983 million for 2009 reflects net volume increases of $6,627 million primarily from new business, partially offset by client terminations. Also contributing to the higher retail net revenues are net price increases of $1,356 million for 2009 driven by product price inflation primarily on brand-name drugs, partially offset by higher client price discounts. The aforementioned net price variance includes the offsetting effect of approximately $1,585 million from a greater representation of lower-priced generic drugs in 2009. The increase in retail net revenues of $2,189 million for 2008 reflects net price increases of $1,330 million driven by product price inflation primarily on brand-name drugs, partially offset by higher client price discounts. Also contributing to the higher retail net revenues are net volume increases of $859 million, primarily from new business, partially offset by client terminations. The aforementioned net price variance includes the offsetting effect of approximately $1,780 million from a greater representation of lower-priced generic drugs in 2008. Mail-Order. The increase in mail-order net revenues of $402 million for 2009 reflects net price increases of $923 million driven by product price inflation primarily on brand-name drugs, partially offset by higher client price discounts. These increases are partially offset by net volume decreases of $521 million from lower brand-name volumes, and are net of new business and incremental volume from the Europa Apotheek majority-stake acquisition and higher generic volumes. The higher-priced brand-name volumes were lower; however the less expensive generic volumes were higher in part as a result of the economy and plan design changes. The aforementioned net price variance includes the offsetting effect of approximately $845 million from a greater representation of lower-priced generic drugs in 2009. The increase in mail-order net revenues of $4,425 million for 2008 reflects net volume increases of $2,817 million, primarily from new business and incremental volume from acquisitions including, most significantly, PolyMedica. Also contributing to the increased mail-order net revenues are net price increases of $1,608 million driven by product price inflation primarily on brand-name drugs, partially offset by higher client price discounts. The aforementioned net price variance includes the offsetting effect of approximately $910 million from a greater representation of lower-priced generic drugs in 2008. Our overall generic dispensing rate increased to 67.5% for 2009, compared to 64.1% for 2008 and 59.7% for 2007. Mail-order generic dispensing rates increased to 57.8% for 2009, compared to 55.0% for 2008 and 50.0% for 2007. Retail generic dispensing rates increased to 69.2% for 2009, compared to 66.0% for 2008 and 61.7% for 2007. These increases reflect the impact of the introduction of new generic products during these periods and the effect of programs and client plan design changes promoting the use of lower-priced and more steeply discounted generics. 47
  • 60.
    Service revenues increased$161.0 million in 2009 as a result of higher client and other service revenues of $182.8 million, partially offset by lower manufacturer service revenues of $21.8 million. The higher client and other service revenues primarily reflect higher claims processing administrative fees associated with the increased retail volume, and higher revenue associated with Medicare Part D-related product offerings, as well as higher revenues for formulary management fees and clinical programs. The lower manufacturer service revenues reflect reduced administrative fees from manufacturer contract revisions. Service revenues increased $137.5 million in 2008 as a result of higher client and other service revenues of $111.2 million, and higher manufacturer service revenues of $26.3 million. The higher client and other service revenues primarily reflect higher revenues for clinical programs, formulary management fees, and higher claims processing administrative fees, in addition to revenue associated with Medicare Part D-related product offerings. The higher manufacturer revenues result from increased fees reflecting higher volumes and manufacturer contract revisions. Gross Margin Our product gross margin percentage was 5.8% for 2009 compared to 6.5% for 2008, primarily reflecting higher retail volumes and overall higher retail mix in our prescription base. The product gross margin percentage was favorably impacted by increased generic dispensing rates and retail pharmacy reimbursement rates, partially offset by higher client price discounts associated with new clients and renewals of existing clients, and lower rebate retention. Costs associated with implementation efforts for new clients were consistent in 2009 and 2008. Our product gross margin percentage was 6.5% for 2008 compared to 5.8% for 2007, reflecting increased generic dispensing rates and higher mail-order volumes, as well as favorable retail pharmacy reimbursement rates and higher rebate retention. These items are partially offset by higher client price discounts associated with new clients and renewals of existing clients, as well as the benefit from the short-term availability of generic Plavix» primarily in the first quarter of 2007. Rebates from brand-name pharmaceutical manufacturers, which are reflected as a reduction in cost of product net revenues, totaled $5,372 million in 2009, $4,447 million in 2008 and $3,561 million in 2007, with formulary rebates representing 78.7%, 54.7% and 50.1% of total rebates, respectively. The overall increases in rebates reflect volume from new clients and favorable pharmaceutical manufacturer rebate contract revisions, as well as improved formulary management and patient compliance, partially offset by lower rebates as a result of brand-name drug volumes that have converted to generic drugs. The increases in formulary rebate percentages of total rebates reflect the composition of new client business. We retained approximately $734 million, or 13.7%, of total rebates in 2009, $806 million, or 18.1%, in 2008, and $547 million, or 15.4%, in 2007. The variances in the retained rebate percentages are reflective of client mix and the associated client preferences regarding the rebate sharing aspects of their overall contract pricing structure. Service gross margin of $588.7 million for 2009 increased $128.3 million compared to $460.4 million for 2008, reflecting the aforementioned increase in service revenues of $161.0 million, partially offset by an increase in cost of service revenues of $32.7 million. The cost of service revenue increase reflects higher labor and other costs associated with formulary management fees, Medicare Part D and other client programs. Service gross margin of $460.4 million for 2008 increased $74.4 million compared to $386.0 million for 2007, reflecting the aforementioned increase in service revenues of $137.5 million, partially offset by an increase in cost of service revenues of $63.1 million. The cost of service revenues increase reflects higher labor and other costs associated with Medicare Part D and other client programs, as well as higher promotional expenses for programs to encourage mail-order and generic utilization. 48
  • 61.
    The following tablepresents additional selected comparative results of operations ($ in millions): December 26, December 27, December 29, For Fiscal Years Ended 2009 Variance 2008(1) Variance 2007(2) Gross margin(3) . . . . . . . . . .... $ 4,027.0 $298.6 8.0% $3,728.4 $783.1 26.6% $2,945.3 Selling, general and administrative expenses . . .... 1,455.5 30.5 2.1% 1,425.0 310.9 27.9% 1,114.1 Amortization of intangibles . .... 305.6 20.5 7.2% 285.1 57.0 25.0% 228.1 Interest expense . . . . . . . . . .... 172.5 (61.2) (26.2)% 233.7 99.5 74.1% 134.2 Interest (income) and other (income) expense, net . . . .... (9.9) (3.7) 59.7% (6.2) 28.2 (82.0)% (34.4) Income before provision for income taxes . . . . . . . . . . . . . 2,103.3 312.5 17.5% 1,790.8 287.5 19.1% 1,503.3 Provision for income taxes . . . . . 823.0 135.1 19.6% 687.9 96.6 16.3% 591.3 Net income . . . . . . . . . . . . . . . . $ 1,280.3 $177.4 16.1% $1,102.9 $190.9 20.9% $ 912.0 (1) Includes majority-owned Europa Apotheek’s operating results commencing on the April 28, 2008 acquisition date, and for the subsequent period. (2) Includes PolyMedica’s and Critical Care’s operating results commencing on the October 31, 2007 and Novem- ber 14, 2007 acquisition dates, respectively, and for the subsequent periods. (3) Defined as net revenues minus cost of revenues. Selling, General and Administrative Expenses SG&A expenses for 2009 were $1,455.5 million and increased from 2008 by $30.5 million, or 2.1%, reflecting enterprise-wide efficiencies, while adding significant amounts of new business and continuing to invest in our differentiating initiatives. This increase primarily reflects higher performance-related and stock-based compensation expenses, as well as higher depreciation expense associated with investments across the business. Also contributing to the increase is the addition of Europa Apotheek SG&A expenses, partially offset by miscellaneous expense decreases including litigation reserves. SG&A expenses for 2008 were $1,425.0 million and increased from 2007 by $310.9 million, or 27.9%. This primarily reflects SG&A expenses associated with PolyMedica and Critical Care, which were acquired in the fourth quarter of 2007, and Europa Apotheek, a second-quarter 2008 majority interest acquisition. In addition, the increase in SG&A expenses also reflects higher employee-related costs, and other miscellaneous expenses including litigation reserves. Amortization of Intangibles Amortization of intangible assets of $305.6 million for 2009 increased $20.5 million from 2008, reflecting additional intangible amortization from PolyMedica associated with the Liberty trade name and patient list acquisitions, as well as increased intangible amortization as a result of the April 28, 2008 acquisition of a majority interest in Europa Apotheek. Amortization of intangible assets of $285.1 million for 2008 increased $57.0 million from 2007, primarily reflecting the additional intangible asset amortization associated with the PolyMedica and Critical Care acquisitions, and the acquisition of a majority interest in Europa Apotheek. Interest Expense Interest expense of $172.5 million for 2009 decreased $61.2 million from 2008, primarily reflecting lower interest rates on the floating rate components of outstanding debt. Additionally, total debt was reduced as there were repayments on the accounts receivable financing facility of $400 million on September 1, 2009 and $200 million on December 23, 2009. Interest expense of $233.7 million for 2008 increased $99.5 million from 2007, reflecting increased borrowings through the first quarter of 2008 primarily to support the PolyMedica and Critical Care acquisitions, and the acquisition of a majority interest in Europa Apotheek, partially offset by lower interest rates on the floating rate components of outstanding debt. 49
  • 62.
    The weighted averageannual interest rate on our indebtedness was approximately 3.8% for 2009, 5.1% for 2008, and 6.3% for 2007, and reflects variability in floating interest rates on the senior unsecured bank credit facilities, swap agreements and the accounts receivable financing facility. Interest (Income) and Other (Income) Expense, Net Interest (income) and other (income) expense, net, of ($9.9) million for 2009 increased $3.7 million from ($6.2) million in 2008, reflecting a first-quarter 2008 charge of $9.8 million for the ineffective portion of the forward-starting interest rate swap agreements associated with our March 2008 issuance of senior notes, which is described further below under “—Liquidity and Capital Resources—Financing Facilities—Swap Agreements.” This is partially offset by decreased interest income reflecting lower interest rates on higher cash balances. Interest (income) and other (income) expense, net, of ($6.2) million for 2008 decreased $28.2 million from ($34.4) million in 2007, primarily attributable to lower interest income reflecting lower interest rates. Additionally, 2008 reflects the aforementioned first-quarter charge of $9.8 million for the ineffective portion of the forward- starting interest rate swap agreements associated with our March 2008 issuance of senior notes. Provision for Income Taxes Our effective tax rate (defined as the percentage relationship of provision for income taxes to income before provision for income taxes) was 39.1% for 2009 compared to 38.4% for 2008. The lower effective tax rate in 2008 reflects a third-quarter 2008 net state income tax benefit of $28 million, resulting primarily from statute of limitations expirations in certain states, partially offset by state tax law changes. This was partially offset by a fourth-quarter 2009 income tax benefit of $22 million, primarily reflecting state-related tax items. Our effective tax rate was 38.4% for 2008 compared to 39.3% for 2007, reflecting the aforementioned third- quarter 2008 net state income tax benefit of $28 million. Net Income and Earnings per Share Net income as a percentage of net revenues was 2.1% in 2009, 2.2% in 2008, and 2.0% in 2007. The decrease to 2.1% in 2009 from 2.2% in 2008 reflects the combined effect of the aforementioned factors including retail volume increases. The increase in 2008 to 2.2% from 2.0% in 2007 also reflects the aforementioned factors including mail-order volume increases. Diluted earnings per share increased 22.5% to $2.61 for 2009, from $2.13 for 2008. Diluted earnings per share increased 30.7% to $2.13 for 2008, from $1.63 for 2007. The diluted weighted average shares outstanding were 490.0 million for 2009, 518.6 million for 2008, and 560.9 million for 2007. The decreases for each year result from the repurchase of approximately 186.3 million shares of stock in connection with our share repurchase programs since inception in 2005 through the end of 2009, compared to equivalent amounts of 159.0 million and 111.4 million shares repurchased inception-to-date through the ends of 2008 and 2007, respectively. There were approximately 27.3 million shares repurchased in 2009, compared to 47.6 million in 2008 and 53.3 million in 2007. 50
  • 63.
    Segment Results ofOperations PBM Segment The PBM segment involves sales of traditional prescription drugs and supplies to our clients and members, either through our networks of contractually affiliated retail pharmacies or our mail-order pharmacies. The following table presents selected PBM segment comparative results of operations ($ in millions): December 26, December 27, December 29, For Fiscal Years Ended 2009 Variance 2008(1) Variance 2007(2) Product net revenues . . . . . . . . $ 49,526.2 $ 6,847.7 16.0% $ 42,678.5 $ 4,697.1 12.4% $ 37,981.4 Service revenues . . . . . . . . . . . 750.5 145.2 24.0% 605.3 123.2 25.6% 482.1 Total net revenues . . . . . . . . . . 50,276.7 6,992.9 16.2% 43,283.8 4,820.3 12.5% 38,463.5 Total cost of revenues . . . . . . . 46,951.5 6,765.3 16.8% 40,186.2 4,188.5 11.6% 35,997.7 Total gross margin(3) . . . . . ... $ 3,325.2 $ 227.6 7.3% $ 3,097.6 $ 631.8 25.6% $ 2,465.8 Gross margin percentage . . ... 6.6% (0.6)% 7.2% 0.8% 6.4% Selling, general and administrative expenses . ... 1,158.3 38.3 3.4% 1,120.0 235.7 26.7% 884.3 Amortization of intangibles ... 258.1 17.6 7.3% 240.5 51.9 27.5% 188.6 Operating income . . . . . . . . . . $ 1,908.8 $ 171.7 9.9% $ 1,737.1 $ 344.2 24.7% $ 1,392.9 (1) Includes majority-owned Europa Apotheek’s operating results commencing on the April 28, 2008 acquisition date, and for the subsequent period. (2) Includes PolyMedica’s operating results commencing on the October 31, 2007 acquisition date, and for the sub- sequent periods. (3) Defined as net revenues minus cost of revenues. PBM total net revenues of $50,276.7 million for 2009 increased $6,992.9 million compared to the revenues of $43,283.8 million for 2008. The increases primarily reflect higher retail volume driven by new business, as well as product price inflation primarily on brand-name drugs, partially offset by a greater representation of lower-priced generic drugs and higher client price discounts, as well as lower mail-order brand-name volumes. PBM total net revenues of $43,283.8 million for 2008 increased $4,820.3 million compared to the revenues of $38,463.5 million for 2007. The increase primarily reflects higher total volume driven by new business and incremental volume from PolyMedica, as well as product price inflation primarily on brand-name drugs, partially offset by a greater representation of lower-priced generic drugs and higher client price discounts. Gross margin was 6.6% of net revenues for 2009 compared to 7.2% for 2008, primarily driven by a higher mix of retail prescriptions. In addition, the gross margin percentage was favorably impacted by increased generic dispensing rates and favorable retail pharmacy reimbursement rates, partially offset by higher client price discounts and lower rebate retention. Gross margin was 7.2% of net revenues for 2008 compared to 6.4% for 2007, primarily driven by the increased generic dispensing rates, higher mail-order penetration reflecting a large mail-order-only client commencing in 2008, favorable retail pharmacy reimbursement rates, and higher rebate retention rates. These increases are partially offset by client price discounts and the Plavix» benefit primarily in the first quarter of 2007. SG&A expenses for 2009 were $1,158.3 million, and increased from 2008 by $38.3 million. The increase primarily reflects higher performance-related and stock-based compensation expenses, as well as higher depreciation expense associated with investments across the business. Also contributing to the increase is the addition of Europa Apotheek SG&A expenses, partially offset by miscellaneous expense decreases including litigation reserves. SG&A expenses for 2008 were $1,120.0 million, and increased from 2007 by $235.7 million. The increase primarily reflects SG&A expenses associated with PolyMedica and Europa Apotheek, and higher employee-related costs, as well as litigation reserves. 51
  • 64.
    Amortization of intangibleassets was $258.1 million for 2009, compared to $240.5 million for 2008. The increase reflects additional intangible amortization from PolyMedica associated with the Liberty trade name and patient list acquisitions, as well as increased intangible amortization as a result of the April 28, 2008 acquisition of a majority interest in Europa Apotheek. Amortization of intangible assets was $240.5 million for 2008, compared to $188.6 million for 2007. The increase reflects the additional intangible asset amortization associated with the acquisitions of PolyMedica and a majority interest in Europa Apotheek. Operating income of $1,908.8 million for 2009 increased $171.7 million, or 9.9%, compared to 2008. Operating income of $1,737.1 million for 2008 increased $344.2 million, or 24.7%, compared to 2007. The increases in operating income resulted from the aforementioned factors. For additional information on the PBM segment, see Note 13, “Segment and Geographic Data,” to our audited consolidated financial statements included in Part II, Item 8 of this Annual Report on Form 10-K. Specialty Pharmacy Segment The Specialty Pharmacy segment includes the sale of higher-margin specialty pharmacy products and services for the treatment of chronic and complex (potentially life-threatening) diseases. The following table presents selected Specialty Pharmacy segment comparative results of operations ($ in millions): December 26, December 27, December 29, For Fiscal Years Ended 2009 Variance 2008 Variance 2007(1) Product net revenues . . $9,435.2 $1,537.5 19.5% $7,897.7 $1,917.2 32.1% $5,980.5 Service revenues . . . . . 92.3 15.8 20.7% 76.5 14.3 23.0% 62.2 Total net revenues . . . . 9,527.5 1,553.3 19.5% 7,974.2 1,931.5 32.0% 6,042.7 Total cost of revenues . . . . . . . . . 8,825.7 1,482.3 20.2% 7,343.4 1,780.2 32.0% 5,563.2 (2) Total gross margin . . $ 701.8 $ 71.0 11.3% $ 630.8 $ 151.3 31.6% $ 479.5 Gross margin percentage. . . . . . . . 7.4% (0.5)% 7.9% — 7.9% Selling, general and administrative expenses . . . . . . . . . 297.2 (7.8) (2.6)% 305.0 75.2 32.7% 229.8 Amortization of intangibles . . . . . . . 47.5 2.9 6.5% 44.6 5.1 12.9% 39.5 Operating income . . . . $ 357.1 $ 75.9 27.0% $ 281.2 $ 71.0 33.8% $ 210.2 (1) Includes Critical Care’s operating results commencing on the November 14, 2007 acquisition date, and for the subsequent periods. (2) Defined as net revenues minus cost of revenues. Specialty Pharmacy total net revenues of $9,527.5 million for 2009 increased $1,553.3 million compared to revenues of $7,974.2 million for 2008, primarily reflecting new clients. Specialty Pharmacy total net revenues of $7,974.2 million for 2008 increased $1,931.5 million compared to revenues of $6,042.7 million for 2007. The increase primarily results from higher mail-order revenues reflecting new clients, as well as incremental revenues resulting from the Critical Care acquisition. Gross margin was 7.4% of net revenues for 2009 compared to 7.9% of net revenues for 2008, primarily reflecting channel mix from significant new business wins. Gross margin was 7.9% of net revenues for 2008, consistent with 2007, primarily reflecting higher margins associated with the Critical Care product line, offset by lower margins associated with new client mix. SG&A expenses of $297.2 million for 2009 decreased $7.8 million compared to 2008, primarily reflecting lower technology, marketing and employee-related expenses. SG&A expenses of $305.0 million for 2008 increased $75.2 million compared to 2007. This increase primarily reflects SG&A expenses associated with Critical Care, as well as higher employee-related expenses. Amortization of intangible assets was $47.5 million for 2009, $44.6 mil- lion for 2008, and $39.5 million for 2007, and reflects the additional intangible asset amortization associated with the Critical Care acquisition. 52
  • 65.
    Operating income of$357.1 million for 2009 increased $75.9 million, or 27.0%, compared to operating income of $281.2 million for 2008. Operating income of $281.2 million for 2008 increased $71.0 million, or 33.8%, compared to operating income of $210.2 million for 2007. The increases in operating income resulted from the aforementioned factors. See Note 13, “Segment and Geographic Data,” to our audited consolidated financial statements included in Part II, Item 8 of this Annual Report on Form 10-K for additional information. Liquidity and Capital Resources Cash Flows The following table presents selected data from our consolidated statements of cash flows ($ in millions): December 26, December 27, December 29, For Fiscal Years Ended 2009 Variance 2008(1) Variance 2007(2) Net cash provided by operating activities . . . . . . $ 3,501.4 $ 1,866.3 $ 1,635.1 $ 268.1 $ 1,367.0 Net cash used by investing activities . . . . . . . . . (305.0) 111.2 (416.2) 1,297.6 (1,713.8) Net cash (used by) provided by financing activities . . . . . . . . . . . . . . . . . . . . . . . . . . . (1,606.6) (552.0) (1,054.6) (1,357.0) 302.4 Net increase (decrease) in cash and cash equivalents . . . . . . . . . . . . . . . . . . . . . . . . . 1,589.8 1,425.5 164.3 208.7 (44.4) Cash and cash equivalents at beginning of year . . 938.4 164.3 774.1 (44.4) 818.5 Cash and cash equivalents at end of year . . . . . . $ 2,528.2 $ 1,589.8 $ 938.4 $ 164.3 $ 774.1 (1) Includes majority-owned Europa Apotheek’s operating results commencing on the April 28, 2008 acquisition date, and for the subsequent period. (2) Includes PolyMedica’s and Critical Care’s operating results commencing on the October 31, 2007 and Novem- ber 14, 2007 acquisition dates, respectively, and for the subsequent period. Operating Activities. Net cash provided by operating activities of $3,501.4 million for 2009 reflects net income of $1,280.3 million, with non-cash adjustments for depreciation and amortization of $484.6 million and stock-based compensation of $146.0 million. In addition, there were net cash inflows of $571.4 million from a decrease in inventories, net, reflecting initiatives to optimize inventory levels. Net cash flows from operating activities for 2009 includes net cash inflows of $93.4 million from a decrease in manufacturer accounts receivable, net, due to initiatives to improve working capital management, partially offset by business growth of approximately $200 mil- lion. Additionally, there were net cash inflows of $627.2 million and $448.2 million from increases in claims and other accounts payable and client rebates and guarantees payable, respectively, partially offset by net cash outflows of $515.4 million from an increase in client accounts receivable, net, all of which were primarily due to increased prescription volume associated with business growth. There were also net cash inflows of $259.6 million from a decrease in prepaid expenses and other current assets primarily due to the timing of a prepaid client rebate. The $1,866.3 million increase in net cash provided by operating activities for 2009 compared to 2008 is primarily due to an increase in cash flows of $478.4 million from inventories, net, reflecting initiatives to optimize inventory levels, and an increase in cash flows of $434.6 million from manufacturer accounts receivable, net, reflecting initiatives to improve working capital management. In addition, there were increased cash flows of $572.9 million from claims and other accounts payable reflecting higher retail volumes and business growth, and increased cash flows of $299.3 million from the timing of a prepaid client rebate. Net cash provided by operating activities of $1,635.1 million for 2008 reflects net income of $1,102.9 million, with non-cash adjustments for depreciation and amortization of $442.8 million and stock-based compensation of $131.7 million. Additionally, there were net cash inflows of $566.5 million for client rebates and guarantees payable reflecting increased client rebate pass-back liabilities associated with business growth and net cash inflows of $93.0 million from a decrease in inventories, net, reflecting initiatives to optimize inventory levels. These increases were partially offset by net cash outflows of $418.5 million and $341.2 million associated with increases in client accounts receivable, net, and manufacturer accounts receivable, net, respectively, reflecting increased prescription volume associated with business growth. The $268.1 million increase in net cash provided by operating activities in 2008 compared to 2007 is primarily due to increased net income of $190.9 million. Also contributing to the increase in net cash provided by operating activities in 2008 are increases in cash inflows of $57.0 million from an increase in amortization of intangibles, and a net increase in cash inflows of $23.0 million from higher stock-based compensation on employee stock plans and related tax benefits. 53
  • 66.
    Investing Activities. Thenet cash used by investing activities of $305.0 million for 2009 is primarily attributable to capital expenditures of $238.8 million associated with capitalized software development in connection with client- related programs and our Medicare PDP product offerings, technology and pharmacy operations hardware investments, and capital expenditures associated with the construction of our third automated dispensing pharmacy in Whitestown, Indiana. In addition, we had purchases of securities and other assets of $153.4 million, $63.0 million of which represents a diabetes patient list acquired in the first quarter of 2009. These cash outflows were partially offset by proceeds from the sale of securities and other investments of $87.2 million. The $111.2 million decrease in net cash used by investing activities for 2009 compared to 2008 is primarily due to cash paid of $126.5 million, net of cash acquired, for the acquisition of a majority interest in Europa Apotheek in the second quarter of 2008, a decrease in capital expenditures of $48.1 million, partially offset by the $63.0 million diabetes patient list acquisition. The net cash used by investing activities of $416.2 million for 2008 is primarily attributable to capital expenditures of $286.9 million associated with capitalized software development in connection with client-related programs and our Medicare PDP product offerings, technology and pharmacy operations hardware investments, including those associated with the construction of our third automated dispensing pharmacy in Whitestown, Indiana. Additionally, net cash used by investing activities includes cash paid of $126.5 million, net of cash acquired, to acquire a majority interest in Europa Apotheek. The $1,297.6 million decrease in net cash used by investing activities in 2008 compared to 2007 is primarily due to our acquisitions of PolyMedica and Critical Care in 2007. Purchases of and proceeds from securities, which relate to investment activities of our insurance companies, are balanced in all years presented. Financing Activities. The net cash used by financing activities of $1,606.6 million for 2009 primarily results from $1,238.5 million in share repurchases and $600 million in repayments under our accounts receivable financing facility, partially offset by net proceeds from employee stock plans of $152.2 million and excess tax benefits from stock-based compensation arrangements of $64.3 million. The increase in net cash used by financing activities of $552.0 million for 2009 compared to 2008 primarily results from lower net proceeds from debt of $1,669.9 million, partially offset by lower share repurchases of $947.6 million, higher net proceeds from employee stock plans of $91.6 million and $45.4 million recorded in the first quarter of 2008 for the settlement of a cash flow hedge that we entered into in December 2007 described under “—Liquidity and Capital Resources—Financing Facilities—Swap Agreements” below. The net cash used by financing activities of $1,054.6 million for 2008 primarily results from $2,186.1 million in share repurchases, $2,210.0 million of repayments under our revolving credit facility, partially offset by proceeds from long-term debt of $3,295.7 million. Proceeds from long-term debt of $3,295.7 million for 2008 include proceeds of $1,485.7 million from our underwritten public offering of senior notes discussed below and proceeds from our revolving credit facility of $1,810.0 million. Net cash used by financing activities also includes the $45.4 million settlement of the cash flow hedge, as well as proceeds from employee stock plans of $60.6 million and excess tax benefits from stock-based compensation arrangements of $41.8 million. The increase in net cash used by financing activities of $1,357.0 million in 2008 compared to 2007 primarily results from higher repayments on debt of $1,521.6 million, an increase in share repurchases of $225.5 million, a decrease in proceeds from employee stock plans of $147.7 million, and the $45.4 million settlement of the cash flow hedge, partially offset by higher net proceeds from debt of $620.7 million. On March 18, 2008, we completed an underwritten public offering of $300 million aggregate principal amount of 5-year senior notes at a price to the public of 99.425 percent of par value, and $1.2 billion aggregate principal amount of 10-year senior notes at a price to the public of 98.956 percent. The 5-year senior notes bear interest at a rate of 6.125% per annum, with an effective interest rate of 6.261%, and mature on March 15, 2013. The 10-year senior notes bear interest at a rate of 7.125% per annum, with an effective interest rate of 7.274%, and mature on March 15, 2018. Medco may redeem all or part of these notes at any time or from time to time at its option at a redemption price equal to the greater of (i) 100% of the principal amount of the notes being redeemed plus accrued and unpaid interest to the redemption date or (ii) a “make-whole” amount based on the yield of a comparable U.S. Treasury security plus 50 basis points. We pay interest on both series of senior notes semi-annually on March 15 and September 15 of each year. We used the net proceeds from the sale of these senior notes to repay borrowings under our revolving credit facility used to fund the acquisitions of PolyMedica and Critical Care in 2007, which are described in Note 3, “Acquisitions of Businesses,” to our audited consolidated financial statements included in Part II, Item 8 of this Annual Report on Form 10-K. 54
  • 67.
    Total cash andshort-term investments as of December 26, 2009 were $2,548.3 million, including $2,528.2 mil- lion in cash and cash equivalents. Total cash and short-term investments as of December 27, 2008 were $1,002.4 million, including $938.4 million in cash and cash equivalents. The increase of $1,545.9 million in cash and short-term investments in 2009 primarily reflects the aforementioned components impacting increased cash flows from operations, partially offset by the use of cash associated with share repurchase activity. Looking Forward We believe that our current liquidity and prospects for strong cash flows from operations by improved working capital management assist in limiting the effects on our business from the weaker economy. At the end of fiscal year 2009, we had additional committed borrowing capacity under our revolving credit facility of approximately $1 billion and have no required long-term debt payments until 2012. Additionally, we have additional borrowing capacity of $600 million from our 364-day accounts receivable financing facility, which is renewable annually at the option of both Medco and the banks and was renewed on July 27, 2009. In fiscal year 2009, we experienced increased cash flow from operations representing our strong operating performance, as well as significant improvements in working capital. For 2010, we anticipate that our cash flow from operations will decrease from 2009 as our residual working capital opportunities are not as great. Our December 26, 2009 cash balance increased to $2,528.2 million from $938.4 million at December 27, 2008. Since 2005, we have executed share repurchases of 186.3 million shares at a cost of $6.9 billion through our share repurchase programs. We currently have a $3 billion share repurchase plan, which expires in November 2010, with $1.6 billion remaining as of December 26, 2009. From time to time, we may make additional share repurchases, which we intend to fund with our free cash flow (cash flow from operations less capital expenditures). For our cash on hand, any investments we make are within approved investing guidelines and we continue to monitor ongoing events and make investment decisions accordingly. We anticipate that our 2010 capital expenditures, for items such as capitalized software development for strategic initiatives, infrastructure enhancements, and the completion of our third automated dispensing pharmacy in Whitestown, Indiana, will be approximately $225 million. We expect that capital expenditures will be funded by our cash flows from operations. We have clients in various industries, including the automobile manufacturer industry and the financial industry, as well as governmental agencies. We actively monitor the status of our accounts receivable and have mechanisms in place to minimize the potential for incurring material accounts receivable credit risk. To date, we have not experienced any significant deterioration in our client or manufacturer rebates accounts receivables. We believe the oversight of the investments held under our pension plans is rigorous and the investment strategies are prudent. The fair value of our pension plan assets increased from $119.2 million at the end of 2008 to $147.6 million at the end of 2009 primarily resulting from investment gains. The investment gains were partially offset by increased benefit obligations related to the 2009 benefit accrual and resulted in a decrease in the pension plans’ unfunded status from $73.7 million at fiscal year-end 2008 to $66.9 million at fiscal year-end 2009 and a decrease of $28.5 million pre-tax, reflected in comprehensive income in stockholders’ equity. This decrease in unfunded status did not have an impact on the consolidated statement of income for 2009. Net actuarial gains and losses, in excess of certain thresholds, are amortized into the consolidated statement of income over the 12-year average remaining service life of participants. We estimate the 2010 net periodic benefit cost for our pension plans to be included in our consolidated statement of income will be approximately $30 million. 55
  • 68.
    We currently haveno plans to pay cash dividends in the foreseeable future. Financing Facilities Five-Year Credit Facilities We have senior unsecured bank credit facilities consisting of a $1 billion, 5-year senior unsecured term loan and a $2 billion, 5-year senior unsecured revolving credit facility. The term loan matures on April 30, 2012, at which time the entire facility is required to be repaid. If there are pre-payments on the term loan prior to the maturity date, that portion of the loan would be extinguished. At our current debt ratings, the credit facilities bear interest at London Interbank Offered Rate (“LIBOR”) plus a 0.45 percent margin, with a 10 basis point commitment fee due on the unused portion of the revolving credit facility. The outstanding balance under the revolving credit facility was $1.0 billion as of December 26, 2009 and December 27, 2008. There was no activity under the revolving credit facility during 2009. As of December 26, 2009, we had $993 million available for borrowing under our revolving credit facility, after giving effect to prior net draw-downs of $1 billion and $7 million in issued letters of credit. During 2008, our net borrowings under the revolving credit facility decreased by approximately $400 million, consisting of repayments of $2.2 billion and draw-downs of $1.8 billion. As a result of this activity, the revolving credit facility’s outstanding balance decreased from $1.4 billion at fiscal year-end 2007 to $1.0 billion as of December 27, 2008. As of December 27, 2008, we had $987 million available for borrowing under our revolving credit facility, after giving effect to prior net draw-downs of $1 billion and $13 million in issued letters of credit. The revolving credit facility is available through April 30, 2012. Accounts Receivable Financing Facility and Other Short-Term Debt Through a wholly-owned subsidiary, we have a $600 million, 364-day renewable accounts receivable financing facility that is collateralized by our pharmaceutical manufacturer rebates accounts receivable. During 2009, we repaid the entire $600 million outstanding balance, which resulted in no amounts outstanding and $600 million available for borrowing under the facility at December 26, 2009. At December 27, 2008, there was $600 million outstanding with no additional amounts available for borrowing under the facility. We pay interest on amounts borrowed under the agreement based on the funding rates of the bank-related commercial paper programs that provide the financing, plus an applicable margin and liquidity fee determined by our credit rating. The weighted average annual interest rate on amounts outstanding under the facility at December 27, 2008 was 3.10%. This facility is renewable annually at the option of both Medco and the banks and was renewed on July 27, 2009. Amounts outstanding under the accounts receivable financing facility are classified as short-term debt on our consolidated balance sheets. Additionally, we have short-term debt of $15.8 million outstanding as of December 26, 2009 under an $18.7 million short-term revolving credit facility. The weighted average annual interest rate on amounts outstanding under the short-term revolving credit facility at December 26, 2009 was 1.58%. Interest Rates The weighted average annual interest rate on our indebtedness was approximately 3.8% for 2009, 5.1% for 2008 and 6.3% for 2007 and reflects variability in floating interest rates on the senior unsecured bank credit facilities, swap agreements and the accounts receivable financing facility. Several factors could change the weighted average annual interest rate, including but not limited to a change in our debt ratings, reference rates used under our bank credit facility and accounts receivable financing facility, swap agreements and the mix of our debt. 56
  • 69.
    Swap Agreements On December 12, 2007, we entered into forward-starting interest rate swap agreements in contemplation of the issuance of long-term fixed-rate financing. We entered into these cash flow hedges to manage our exposure to changes in benchmark interest rates and to mitigate the impact of fluctuations in the interest rates prior to the issuance of the long-term financing. The cash flow hedges entered into were for a notional amount of $500 million on the then-current 10-year treasury interest rate, and for a notional amount of $250 million on the then-current 30-year treasury interest rate, both with a settlement date of March 31, 2008. At the time of purchase, the cash flow hedges were anticipated to be effective in offsetting the changes in the expected future interest rate payments on the proposed debt offering attributable to fluctuations in the treasury benchmark interest rate. In connection with the issuance of the 5-year senior notes and 10-year senior notes described above, a portion of the $250 million notional amount 30-year treasury interest rate cash flow hedge was deemed an ineffective hedge. The cash flow hedges were settled on March 17, 2008 for $45.4 million and included the ineffective portion that was recorded as an increase of $9.8 million to interest (income) and other (income) expense, net, for the year ended December 27, 2008. The effective portion was recorded in accumulated other comprehensive income and is reclassified to interest expense over the ten-year period in which we hedged our exposure to variability in future cash flows. The unamortized effective portion reflected in accumulated other comprehensive loss as of December 26, 2009 and December 27, 2008 was $18.1 million and $20.0 million, net of tax, respectively. In 2004, we entered into five interest rate swap agreements on $200 million of the $500 million in 7.25% senior notes due in 2013. These swap agreements were entered into as an effective hedge to (i) convert a portion of the senior note fixed rate debt into floating rate debt; (ii) maintain a capital structure containing appropriate amounts of fixed and floating rate debt; and (iii) lower the interest expense on these notes in the near term. The fair value of our obligation under our interest rate swap agreements, represented net receivables of $14.0 million and $18.4 million as of December 26, 2009 and December 27, 2008, respectively, which are reported in other noncurrent assets, with offsetting amounts recorded in long-term debt, net, on our consolidated balance sheets. We do not expect our future cash flows to be affected to any significant degree by a sudden change in market interest rates. Covenants All of the senior notes discussed above are subject to customary affirmative and negative covenants, including limitations on sale/leaseback transactions; limitations on liens; limitations on mergers and similar transactions; and a covenant with respect to certain change of control triggering events. The 6.125% senior notes and the 7.125% senior notes are also subject to an interest rate adjustment in the event of a downgrade in the ratings to below investment grade. In addition, the senior unsecured bank credit facilities and the accounts receivable financing facility are subject to covenants, including, among other items, maximum leverage ratios. We were in compliance with all covenants at December 26, 2009 and December 27, 2008. Debt Ratings Medco’s debt ratings, all of which represent investment grade, reflect the following as of the filing date of this Annual Report on Form 10-K: Moody’s Investors Service, Baa3; Standard & Poor’s, BBB; Fitch Ratings, BBB. EBITDA We calculate and use EBITDA and EBITDA per adjusted prescription as indicators of our ability to generate cash from our reported operating results. These measurements are used in concert with net income and cash flows from operations, which measure actual cash generated in the period. In addition, we believe that EBITDA and EBITDA per adjusted prescription are supplemental measurement tools used by analysts and investors to help evaluate overall operating performance and the ability to incur and service debt and make capital expenditures. EBITDA does not represent funds available for our discretionary use and is not intended to represent or to be used as a substitute for net income or cash flows from operations data as measured under U.S. generally accepted accounting principles. The items excluded from EBITDA, but included in the calculation of reported net income, are significant components of the consolidated statements of income and must be considered in performing a comprehensive assessment of overall financial performance. EBITDA, and the associated year-to-year trends, should not be considered in isolation. Our calculation of EBITDA may not be consistent with calculations of EBITDA used by other companies. 57
  • 70.
    EBITDA per adjustedprescription is calculated by dividing EBITDA by the adjusted prescription volume for the period. This measure is used as an indicator of EBITDA performance on a per-unit basis, providing insight into the cash-generating potential of each prescription. EBITDA, and as a result, EBITDA per adjusted prescription, are affected by the changes in prescription volumes between retail and mail order, the relative representation of brand- name, generic and specialty pharmacy drugs, as well as the level of efficiency in the business. Adjusted prescription volume equals substantially all mail-order prescriptions multiplied by three, plus retail prescriptions. These mail- order prescriptions are multiplied by three to adjust for the fact that they include approximately three times the amount of product days supplied compared with retail prescriptions. The following table reconciles our reported net income to EBITDA and presents EBITDA per adjusted prescription for each of the respective periods (in millions, except for EBITDA per adjusted prescription data): December 26, December 27, December 29, For Fiscal Years Ended 2009 2008(1) 2007(2) Net income . . . . . . . . . . . . . . . . . . . . . . . . . . . . . . . $1,280.3 $1,102.9 $ 912.0 Add: Interest expense . . . . . . . . . . . . . . . . . . . . . . . . . . 172.5 233.7 134.2 Interest (income) and other (income) expense, net . . . . . . . . . . . . . . . . . . . . . . . . . . . . . . . . . . (9.9) (6.2)(3) (34.4) Provision for income taxes . . . . . . . . . . . . . . . . . . 823.0(4) 687.9 (4) 591.3 Depreciation expense . . . . . . . . . . . . . . . . . . . . . . 179.0 157.7 168.9 Amortization expense . . . . . . . . . . . . . . . . . . . . . . 305.6 285.1 228.1 EBITDA . . . . . . . . . . . . . . . . . . . . . . . . . . . . . . . . . $2,750.5 $2,461.1 $2,000.1 Adjusted prescriptions(5) . . . . . . . . . . . . . . . . . . . . . 898.8 795.9 748.3 EBITDA per adjusted prescription . . . . . . . . . . . . . . $ 3.06 $ 3.09 $ 2.67 (1) Includes majority-owned Europa Apotheek’s operating results commencing on the April 28, 2008 acquisition date, and for the subsequent period. (2) Includes PolyMedica’s and Critical Care’s operating results commencing on the October 31, 2007 and November 14, 2007 acquisition dates, respectively, and for the subsequent periods. (3) Includes a $9.8 million charge for the ineffective portion of the forward-starting interest rate swap agreements associated with the March 2008 issuance of senior notes. See Note 8,“Debt,” to our audited consolidated financial statements included in Part II, Item 8 of this Annual Report on Form 10-K. (4) 2009 and 2008 include tax benefits of $22 million and $28 million, respectively. See Note 10, “Taxes on Income,” to our audited consolidated financial statements included in Part II, Item 8 of this Annual Report on Form 10-K. (5) Adjusted prescription volume equals substantially all mail-order prescriptions multiplied by three, plus retail prescriptions. These mail-order prescriptions are multiplied by three to adjust for the fact that they include approximately three times the amount of product days supplied compared with retail prescriptions. For 2009 compared to 2008, EBITDA increased by 11.8%, compared to an increase in net income of 16.1%, and a decrease in EBITDA per adjusted prescription of 1.0%. The lower rate of increase for EBITDA compared with net income primarily reflects the aforementioned lower interest expense, as well as the higher interest and other income. The lower rate of increase for EBITDA per adjusted prescription compared to EBITDA reflects the higher retail volumes, which are generally less profitable than mail order, and are driven by new business and results in an overall higher retail mix in our prescription base. For 2008 compared to 2007, EBITDA increased by 23.0%, compared to increases in EBITDA per adjusted prescription of 15.7% and net income of 20.9%. The higher rate of increase for EBITDA compared with net income primarily reflects the aforementioned higher levels of interest expense and intangible asset amortization expense. The lower rate of increase for EBITDA per adjusted prescription compared to EBITDA reflects the new client volumes and the aforementioned Plavix» benefit primarily in the first quarter of 2007. 58
  • 71.
    Commitments and ContractualObligations The following table presents our commitments and contractual obligations as of December 26, 2009, as well as our long-term debt obligations ($ in millions): Payments Due By Period Total 2010 2011-2012 2013-2014 Thereafter (1) Long-term debt obligations . . . . . . . . . . . . . . . . . . . $4,000.0 $ — $2,000.0 $ 800.0 $1,200.0 Interest payments on long-term debt obligations(2) . . . . 926.5 154.9 299.8 197.5 274.3 Operating lease obligations(3) . . . . . . . . . . . . . . . . . . . 159.3 50.9 73.5 20.2 14.7 (4) Prescription drug purchase commitments . . . . . . . . . 448.1 448.1 — — — Other(5) . . . . . . . . . . . . . . . . . . . . . . . . . . . . . . . . . . . 151.8 66.6 59.1 26.1 — Total . . . . . . . . . . . . . . . . . . . . . . . . . . . . . . . . . . . . . $5,685.7 $720.5 $2,432.4 $1,043.8 $1,489.0 (1) Long-term debt obligations exclude $13.9 million in total unamortized discounts on our 7.25%, 6.125% and 7.125% senior notes and the fair value of interest rate swap agreements of $14.0 million on $200 million of the $500 million in 7.25% senior notes. (2) The variable component of interest expense for the senior unsecured credit facility is based on the December 2009 LIBOR. The LIBOR fluctuates and may result in differences in the presented interest expense on long-term debt obligations. (3) Primarily reflects contractual operating lease commitments to lease pharmacy and call center pharmacy facilities, offices and warehouse space, as well as pill dispensing and counting devices and other operating equipment for use in our mail-order pharmacies and computer equipment for use in our data centers and corporate headquarters. (4) Represents contractual commitments to purchase inventory from certain biopharmaceutical manufacturers associated with Accredo’s Specialty Pharmacy business consisting of a firm commitment of $324.6 million, and firm commitments for 2010 of $123.5 million with additional commitments through 2012 subject to price increases or variable quantities based on patient usage or days on hand. (5) Consists of purchase commitments for diabetes supplies of $69.9 million, technology-related agreements of $44.0 million and advertising commitments of $11.8 million. Additionally, as part of the acquisition of a majority interest in Europa Apotheek, we have a purchase obligation of $26.1 million anticipated to be settled by 2014, which is included in other noncurrent lia- bilities on the audited consolidated balance sheet as of December 26, 2009. We have a remaining minimum pension funding requirement of $16.3 million under the Internal Revenue Code (“IRC”) during 2010 for the 2009 plan year. From time to time, we make additional voluntary contributions within the maximum deductible limits set by the IRS. As of December 26, 2009, we had letters of credit outstanding of approximately $7.0 million, which were issued under our senior unsecured revolving credit facility as collateral for the deductible portion of our general liability and workers’ compensation coverage. As of December 26, 2009, we have total gross liabilities for income tax contingencies of $99.9 million on our consolidated balance sheet. The majority of the income tax contingencies are subject to statutes of limitations that are scheduled to expire by the end of 2014. In addition, approximately 30% of the income tax contingencies are anticipated to settle over the next twelve months. For additional information regarding operating lease obligations, long-term debt, pension and other postretire- ment obligations, and information on deferred income taxes, see Notes 6, 8, 9 and 10, respectively, to our audited consolidated financial statements included in Part II, Item 8 of this Annual Report on Form 10-K. Off-Balance Sheet Arrangements We have no material off-balance sheet arrangements, other than purchase commitments and lease obligations. See “—Commitments and Contractual Obligations” above. 59
  • 72.
    Interest Rate andForeign Exchange Risk We have floating rate debt with our bank credit facility and accounts receivable financing facility, and investments in marketable securities that are subject to interest rate volatility, which is our principal market risk. In addition, we have interest rate swap agreements on $200 million of the $500 million in 7.25% senior notes. As a result of these interest rate swap agreements, the $200 million of senior notes is subject to interest rate volatility. A 25 basis point change in the weighted average annual interest rate relating to the credit facilities’ balances outstanding and interest rate swap agreements as of December 26, 2009, which are subject to variable interest rates based on LIBOR, and the accounts receivable financing facility, which is subject to the commercial paper rate, would yield a change of approximately $5.5 million in annual interest expense. We do not expect our future cash flows to be affected to any significant degree by a sudden change in market interest rates. We operate our business primarily within the United States and execute the vast majority of our transactions in U.S. dollars. However, as a result of our acquisition of a majority interest in Europa Apotheek, which is based in the Netherlands, and our joint venture with United Drug plc, we are subject to foreign currency translation risk. This foreign currency translation risk is not expected to have a material impact on our consolidated financial statements. Share Repurchase Programs Since 2005, we have executed share repurchases of 186.3 million shares at a cost of $6.9 billion through our share repurchase programs. We are authorized to repurchase our shares under a $3 billion share repurchase program (the “2008 Program”), which was announced in November 2008 and expires in November 2010, with $1.6 billion remaining under its current authorization as of December 26, 2009. During fiscal year 2009 under the 2008 Program, we repurchased 27.3 million shares at a total cost of $1.24 billion with an average per-share cost of $45.38. In the fourth quarter 2008, we repurchased 5.2 million shares at a cost of $200 million under the 2008 Program. Since the inception of the 2008 Program, we have repurchased 32.4 million shares for a total cost of $1.44 billion with an average per-share cost of $44.34. Our $5.5 billion share repurchase program which was approved in August 2005 (the “2005 Program”), originally authorized share repurchases of $500 million and was increased at various times. We completed the 2005 Program in October 2008. During fiscal year 2008, we repurchased 42.4 million shares at a cost of $1.98 billion under the 2005 Program. From time to time, we may make additional share repurchases, which we intend to fund with our free cash flow (cash flow from operations less capital expenditures). Our Board of Directors periodically reviews our share repurchase programs and approves the associated trading parameters. Also see Part II, Item 5, “Market for Registrant’s Common Equity, Related Shareholder Matters and Issuer Purchases of Equity Securities,” for more information. Use of Estimates and Critical Accounting Policies and Estimates Use of Estimates The preparation of consolidated financial statements requires companies to include certain amounts that are based on management’s best estimates and judgments. In preparing the consolidated financial statements, manage- ment reviewed its accounting policies and believes that these accounting policies are appropriate for a fair presentation of our financial position, results of operations and of cash flows. Several of these accounting policies contain estimates, the most significant of which are discussed below. Actual results may differ from those estimates, and it is possible that future results of operations for any particular period could be materially affected by the ultimate actual results. We discuss the impact and any associated risks related to these policies on our business operations throughout this “Management’s Discussion and Analysis of Financial Condition and Results of Operations” section. 60
  • 73.
    Critical Accounting Policiesand Estimates We describe below what we believe to be our critical accounting policies and estimates. (See also Note 2, “Summary of Significant Accounting Policies,” to our audited consolidated financial statements included in Part II, Item 8 of this Annual Report on Form 10-K.) Revenue Recognition. Our product net revenues are derived principally from sales of prescription drugs to our clients and members, either through our networks of contractually affiliated retail pharmacies or through our mail- order pharmacies. Product net revenues also include revenues from the sale of diabetes supplies by PolyMedica. Our Specialty Pharmacy product net revenues represent revenues from the sale of primarily biopharmaceutical drugs and are reported at the net amount billed to third-party payors and patients. We recognize product revenues when the prescriptions are dispensed through our networks of contractually affiliated retail pharmacies or through our mail-order pharmacies and received by members and patients. We have determined that our responsibilities under our client contracts to adjudicate member claims properly and control clients’ drug spend, our separate contractual pricing relationships and responsibilities to the retail pharmacies in our networks, and our interaction with clients’ members, among other indicators, qualify us as the principal under the indicators set forth in Authoritative Guidance in most of our transactions with clients. Our responsibilities under our client contracts include validating that the patient is a member of the client’s plan and that the prescription drug is in the applicable formulary, instructing the pharmacist as to the prescription price and the co-payment due from the patient who is a member of a client’s plan, identifying possible adverse drug interactions for the pharmacist to address with the physician prior to dispensing, suggesting medically appropriate generic alternatives to control drug cost to our clients and their members, and approving the prescription for dispensing. We recognize revenues from our retail network contracts where we are the principal, and our mail-order pharmacies, on a gross reporting basis, in accordance with Authoritative Guidance at the prescription price (ingredient cost plus dispensing fee) negotiated with our clients, including the portion of the price to be settled directly by the member (co-payment) plus our administrative fees. Although we generally do not have credit risk with respect to retail co-payments, all of the above indicators of gross treatment are present. In addition, we view these co-payments as a plan design mechanism that we evaluate in concert with our clients to help them manage their retained prescription drug spending costs, and the level of co-payments does not affect our rebates or margin on the transaction. In the limited instances where the terms of our contracts and nature of our involvement in the prescription fulfillment process do not qualify us as a principal under Authoritative Guidance, our revenues on those transactions consist of the administrative fee paid to us by our clients. We deduct from our revenues the manufacturers’ rebates that are earned by our clients based on their members’ utilization of brand-name formulary drugs. We estimate these rebates at period-end based on actual and estimated claims data and our estimates of the manufacturers’ rebates earned by our clients. We base our estimates on the best available data at period-end and recent history for the various factors that can affect the amount of rebates due to the client. We adjust our rebates payable to clients to the actual amounts paid when these rebates are paid, generally on a quarterly basis, or as significant events occur. We record any cumulative effect of these adjustments against revenues as identified, and adjust our estimates prospectively to consider recurring matters. Adjustments generally result from contract changes with our clients, differences between the estimated and actual product mix subject to rebates or whether the product was included in the applicable formulary. Historically, the effect of these adjustments has not been material to our results of operations. We also deduct from our revenues discounts offered and guarantees regarding the level of service we will provide to the client or member or the minimum level of rebates or discounts the client will receive, as well as other payments made to our clients. Other payments include, for example, implementation allowances and payments related to performance guarantees. Where we provide implemen- tation or other allowances to clients upon contract initiation, we capitalize these payments and amortize them, generally on a straight-line basis, over the life of the contract as a reduction of revenue. These payments are capitalized only in cases where they are refundable upon cancellation or relate to noncancelable contracts. 61
  • 74.
    Our product netrevenues also include premiums associated with our Medicare PDP risk-based product offerings. These products involve prescription dispensing for beneficiaries enrolled in the CMS-sponsored Medicare Part D prescription drug benefit. Our two insurance company subsidiaries have been operating under contracts with CMS since 2006, and currently offer several Medicare PDP options. The products involve underwriting the benefit, charging enrollees applicable premiums, providing covered prescription drugs and administering the benefit as filed with CMS. We provide three Medicare drug benefit plan options for beneficiaries, including (i) a “standard Part D” benefit plan as mandated by statute, and (ii) two benefit plans with enhanced coverage, that exceed the standard Part D benefit plan, available for an additional premium. We also offer numerous customized benefit plan designs to employer group retiree plans under the Medicare Part D prescription drug benefit. The PDP premiums are determined based on our annual bid and related contractual arrangements with CMS. The PDP premiums are primarily comprised of amounts received from CMS as part of a direct subsidy and an additional subsidy from CMS for low-income member premiums, as well as premium payments received from members. These premiums are recognized ratably to product net revenues over the period in which members are entitled to receive benefits. Premiums received in advance of the applicable benefit period are deferred and recorded in accrued expenses and other current liabilities on the consolidated balance sheets. There is a possibility that the annual costs of drugs may be higher or lower than premium revenues. As a result, CMS provides a risk corridor adjustment for the standard drug benefit that compares our actual annual drug costs incurred to the targeted premiums in our CMS-approved bid. Based on specific collars in the risk corridor, we will receive from CMS additional premium amounts or be required to refund to CMS previously received premium amounts. We calculate the risk corridor adjustment on a quarterly basis based on drug cost experience to date and record an adjustment to product net revenues with a corresponding account receivable from or payable to CMS reflected on the consolidated balance sheets. In addition to premiums, there are certain co-payments and deductibles (the “cost share”) due by members based on prescription orders by those members, some of which are subsidized by CMS in cases of low-income membership. For subsidies received in advance, the amount is deferred and recorded in accrued expenses and other current liabilities on the consolidated balance sheets. If there is cost share due from members or CMS, the amount is accrued and recorded in client accounts receivable, net, on the consolidated balance sheets. After the end of the contract year and based on actual annual drug costs incurred, cost share amounts are reconciled with CMS and the corresponding receivable or payable is settled. The cost share is treated consistently as other co-payments derived from providing PBM services, as a component of product net revenues on the consolidated statements of income where the requirements of Authoritative Guidance are met. For further details, see Note 2, “Summary of Significant Accounting Policies,” to our audited consolidated financial statements included in Part II, Item 8 of this Annual Report on Form 10-K. Premium revenues for our PDP products, which exclude member cost share, were $543 million, or less than 1% of total net revenues, in 2009, $317 million, or less than 1% of total net revenues, in 2008, and $255 million, or less than 1% of total net revenues, in 2007. Our agreements with CMS, as well as applicable Medicare Part D regulations and federal and state laws, require us to, among other obligations: (i) comply with certain disclosure, filing, record-keeping and marketing rules; (ii) operate quality assurance, drug utilization management and medication therapy management programs; (iii) support e-prescribing initiatives; (iv) implement grievance, appeals and formulary exception processes; (v) com- ply with payment protocols, which include the return of overpayments to CMS and, in certain circumstances, coordination with state pharmacy assistance programs; (vi) use approved networks and formularies, and provide access to such networks to “any willing pharmacy;” (vii) provide emergency out-of-network coverage; and (viii) adopt a comprehensive Medicare and Fraud, Waste and Abuse compliance program. We have various contractual and regulatory compliance requirements associated with participating in Medicare Part D. Similar to our requirements with other clients, our policies and practices associated with executing our PDP are subject to audit. If material contractual or regulatory non-compliance was to be identified, monetary penalties and/or applicable sanctions, including suspension of enrollment and marketing or debarment from participation in Medicare programs, may be imposed. Additionally, each calendar year, payment will vary based on the annual benchmark that applies as a result of Medicare Part D plan bids for the applicable year, as well as for changes in the CMS methodology for calculating risk adjustment factors. Service revenues consist principally of administrative fees and clinical program fees earned from clients, sales of prescription services to pharmaceutical manufacturers, performance-oriented fees paid by Specialty Pharmacy manufacturers, and other non-product-related revenues. Service revenues are recorded when performance occurs and collectibility is assured. 62
  • 75.
    Rebates Receivable andPayable. Rebates receivable from pharmaceutical manufacturers are earned based upon the dispensing of prescriptions at either pharmacies in our retail networks or our mail-order pharmacies, are recorded as a reduction of cost of revenues and are included in manufacturer accounts receivable, net. We accrue rebates receivable by multiplying estimated rebatable prescription drugs dispensed by the pharmacies in our retail networks, or dispensed by our mail-order pharmacies, by the contractually agreed manufacturer rebate amount, which in certain cases may be based on estimated market share data. We revise rebates receivable estimates to actual, with the difference recorded to cost of revenues, when third-party market share data is available and final rebatable prescriptions are calculated, and rebates are billed to the manufacturer, generally 20 to 90 days subsequent to the end of the applicable quarter. Historically, the effect of adjustments resulting from the reconciliation of our estimated rebates recognized and recorded to actual amounts billed has not been material to our results of operations. Rebates payable to clients are estimated and accrued based upon the prescription drugs dispensed by the pharmacies in our retail networks or by our mail-order pharmacies. Rebates are generally settled on a quarterly basis with clients in the form of an invoice credit, check or wire after collection of rebates receivable from manufacturers, at which time rebates payable are revised to reflect amounts due. Client Accounts Receivable, Net. Client accounts receivable, net, includes billed and estimated unbilled receivables from clients for the PBM and Specialty Pharmacy segments. Unbilled PBM receivables are primarily from clients and are typically billed within 14 days based on the contractual billing schedule agreed upon with each client. At the end of any given reporting period, unbilled PBM receivables from clients may represent up to two weeks of dispensing activity and will fluctuate at the end of a fiscal month depending on the timing of these billing cycles. Client accounts receivable, net, also includes a reduction for rebates and guarantees payable to clients when such are settled on a net basis in the form of an invoice credit. In cases where rebates and guarantees are settled with the client on a net basis, and the rebates and guarantees payable are greater than the corresponding client accounts receivable balances, the net liability is reclassified to client rebates and guarantees payable on the consolidated balance sheets. When these payables are settled in the form of a check or wire, they are recorded on a gross basis and the entire liability is reflected in client rebates and guarantees payable on the consolidated balance sheets. Our client accounts receivable also includes receivables from CMS for our Medicare Part D product offerings and premiums from members. A component of the PBM business includes diabetes supplies dispensed by PolyMedica with the associated receivables primarily reimbursed from insurance companies and government agencies. As a result, this component of the PBM business experiences slower accounts receivable turnover. Allowance for Doubtful Accounts. We estimate the allowance for doubtful accounts for our PBM and Specialty Pharmacy segments based upon a variety of factors, including the age of the outstanding receivables, trends of cash collections and bad debt write-offs, recent economic factors, and our historical experience of collecting the patient co-payments and deductibles. When circumstances related to specific collection patterns change, estimates of the recoverability of receivables are adjusted. The allowance associated with the majority of our PBM segment has historically been negligible because of the contractual obligation for clients to pay outstanding accounts receivable in short duration. The allowance for our PBM segment also reflects amounts associated with member premiums for our Medicare Part D product offerings and amounts related to PolyMedica for diabetes supplies, which are primarily reimbursed by insurance companies and government agencies. The relatively higher allowance for the Specialty Pharmacy segment reflects a different credit risk profile than the PBM business, and is characterized by reimbursement through medical coverage, including government agencies, and higher patient co-payments. The products and services are often covered through medical benefit programs with the primary payors being insurance companies and government programs. These payors typically have a longer claims processing cycle and the ultimate payor may not be initially identified until after several reviews by government and private payors. Additionally, patient co-payments and deductibles are typically higher reflecting the higher product costs. 63
  • 76.
    Income Taxes. Deferredtax assets and liabilities are recorded based on temporary differences between the financial statement basis and the tax basis of assets and liabilities using presently enacted tax rates. On December 31, 2006, the first day of our 2007 fiscal year, we adopted the provisions of a new Financial Accounting Standards Board (“FASB”) standard, which clarifies the accounting for uncertainty in income taxes recognized in companies’ financial statements. The standard prescribes a recognition threshold and measurement attribute for the financial statement recognition and measurement of a tax position taken or expected to be taken in a tax return. Goodwill and Intangible Assets. Goodwill primarily represents, for our PBM segment, the excess of acquisition costs over the fair value of our net assets that had been pushed down to our consolidated balance sheets and existed when we became an independent, publicly traded enterprise in 2003, and, to a significantly lesser extent, our acquisition of a majority interest in Europa Apotheek in 2008, and our acquisitions of PolyMedica in 2007 and ProVantage Health Services, Inc. in 2000. Goodwill also includes, for our Specialty Pharmacy segment, a portion of the excess of the purchase price we paid to acquire Accredo over the fair value of tangible net assets acquired, as well as, to a significantly lesser extent, our acquisition of Critical Care in 2007, and the acquisition of the selected assets of Pediatric Services of America, Inc. in 2005. Goodwill is assessed for impairment annually for each of our segment’s reporting units. This assessment includes comparing the fair value of each reporting unit to the carrying value of the assets assigned to the reporting unit. If the carrying value of the reporting unit were to exceed our estimate of fair value of the reporting unit, we would then be required to estimate the fair value of the individual assets and liabilities within the reporting unit to ascertain the fair value of goodwill. We would be required to record an impairment charge to the extent recorded goodwill exceeds the fair value amount of goodwill resulting from this allocation. The most recent assessment for impairment of goodwill for each of the designated reporting units was performed as of September 26, 2009, and the goodwill was determined not to be impaired, and there have been no significant subsequent changes in events or circumstances. Our intangible assets for our PBM segment primarily represent the value of Medco’s client relationships that had been pushed down to our consolidated balance sheets and existed when we became an independent, publicly traded enterprise in 2003 and to a lesser extent, intangible assets recorded upon our acquisitions of PolyMedica in 2007 and a majority stake in Europa Apotheek in 2008. For our Specialty Pharmacy segment, we have intangible assets recorded primarily from our acquisition of Accredo in 2005. Our intangible assets are reviewed for impairment whenever events, such as losses of significant clients or specialty product manufacturer contracts, or when other changes in circumstances indicate the carrying amount may not be recoverable. When these events occur, we compare the carrying amount of the assets to the undiscounted pre-tax expected future cash flows derived from the lowest appropriate asset grouping. If this comparison indicates that impairment exists, the amount of the impairment would be calculated using discounted expected future cash flows. The Liberty trade name intangible asset was assigned an indefinite life at the time of our acquisition of PolyMedica in 2007. Subsequently in 2008, management determined that the Liberty trade name intangible asset was no longer indefinite-lived and assigned a 35-year useful life. As of December 26, 2009, the weighted average useful life of intangible assets subject to amortization is 23 years in total. The weighted average useful life is approximately 23 years for the PBM client relationships and approximately 21 years for the Specialty Pharmacy segment-acquired intangible assets. We expense the costs to renew or extend contracts associated with intangible assets in the period the costs are incurred. For PBM client relationships, the weighted average contract period prior to the next renewal date as of December 26, 2009 is approximately 2.1 years. We have experienced client retention rates of over 98% for the past two years. Pension and Other Postretirement Benefit Plans. The determination of our obligation and expense for pension and other postretirement benefits is based on management’s assumptions, which are developed with the assistance of actuaries, including an appropriate discount rate, expected long-term rate of return on plan assets, and rates of increase in compensation and healthcare costs. We reassess our benefit plan assumptions on a regular basis. For both the pension and other postretirement benefit plans, the discount rate is determined annually and is evaluated and modified to reflect at the end of our fiscal year the prevailing market rate of a portfolio of high-quality corporate bond investments that would provide the future cash flows needed to settle benefit obligations as they come due. At December 26, 2009, the discount rate utilized was 5.70% for our pension plans, and 5.85% for our other postretirement benefit plans. 64
  • 77.
    The expected rateof return for the pension plan represents the average rate of return to be earned on the plan assets over the period the benefits included in the benefit obligation are to be paid. The expected return on plan assets is determined by multiplying the expected long-term rate of return by the fair value of the plan assets and contributions, offset by expected return on expected benefit payments. In developing the expected rate of return, we consider long-term compounded annualized returns of historical market data, as well as historical actual returns on our plan assets. Using this reference information, we develop forward-looking return expectations for each asset category and a weighted average expected long-term rate of return for a targeted portfolio allocated across these investment categories. As a result of this analysis, for 2010, the expected rate of return assumption will be 8.0% for our pension plan. Actuarial assumptions are based on management’s best estimates and judgment. The following analysis indicates the sensitivity of pension and postretirement benefit costs for the year ending December 26, 2009 and associated obligation balances as of fiscal year-end 2009, to changes in rate assumptions. A reasonably possible increase of 50 basis points in the assumed discount rate, with other assumptions held constant, would have decreased net pension and postretirement benefit cost by an estimated $1.7 million, and would have decreased the year-end benefit obligations by approximately $11.8 million. A reasonably possible decrease of 50 basis points in the assumed discount rate, with other assumptions held constant, would have increased net pension and postretirement benefit cost by an estimated $1.7 million, and would have increased the year-end benefit obligations by approximately $12.3 million. A reasonably possible increase of 50 basis points in the expected rate of return assumption, with other assumptions held constant, would have decreased net pension cost by an estimated $0.7 million. A reasonably possible decrease of 50 basis points in the expected rate of return assumption, with other assumptions held constant, would have increased net pension cost by an estimated $0.7 million. See Note 9, “Pension and Other Postretirement Benefits,” to our audited consolidated financial statements included in Part II, Item 8 of this Annual Report on Form 10-K for additional information. Contingencies. In the ordinary course of business, we are involved in litigation, claims, government inquiries, investigations, charges and proceedings, including, but not limited to, those relating to regulatory, commercial, employment, employee benefits and securities matters. In accordance with the FASB’s standard on accounting for contingencies, we record accruals for contingencies when it is probable that a liability will be incurred and the amount of loss can be reasonably estimated. Our recorded reserves are based on estimates developed with consideration given to the potential merits of claims, the range of possible settlements, advice from outside counsel, and management’s strategy with regard to the settlement of or defense against such claims. See Note 14, “Commitments and Contingencies,” to our audited consolidated financial statements included in Part II, Item 8 of this Annual Report on Form 10-K for additional information. Stock-Based Compensation. We account for stock-based compensation in accordance with a standard issued by the FASB and guidance issued by the Securities and Exchange Commission (“SEC”), which require the measurement and recognition of compensation expense for all stock-based compensation awards made to employees and directors, including employee stock options and employee stock purchase plans. The standard requires companies to estimate the fair value of stock-based awards on the date of grant using an option-pricing model. The portion of the value that is ultimately expected to vest is recognized as expense over the requisite service period. As stock-based compensation expense recognized in our audited consolidated statements of income for fiscal years 2009, 2008 and 2007 is based on awards ultimately expected to vest, it has been reduced for estimated forfeitures. The standard requires forfeitures to be estimated at the time of grant and revised, if necessary, in subsequent periods if actual forfeitures differ from those estimates. In addition, the standard requires that the benefits of realized tax deductions in excess of tax benefits on compensation expense, which amounted to $64.3 million, $41.8 million and $69.9 million for fiscal years 2009, 2008 and 2007, respectively, be reported as a component of cash flows from financing activities rather than as an operating cash flow, as previously required. In accordance with Authoritative Guidance issued by the SEC, we classify stock-based compensation within cost of product net revenues and SG&A expenses to correspond with the financial statement components in which cash compensation paid to employees and directors is recorded. 65
  • 78.
    Recently Adopted FinancialAccounting Standards. Subsequent Events. In May 2009, the FASB issued a standard, which establishes general standards of accounting for and disclosure of events that occur after the balance sheet date but before financial statements are issued or are available to be issued. It requires the disclosure of the date through which an entity has evaluated subsequent events and the basis for that date; that is, whether that date represents the date the financial statements were issued or were available to be issued. The standard was effective for interim or annual financial periods ending after June 15, 2009. We adopted the standard in the second quarter of 2009. We have evaluated subsequent events through February 23, 2010, the filing date of this Annual Report on Form 10-K. Our adoption of the standard did not have a material impact on our audited consolidated financial statements included in Part II, Item 8 of this Annual Report on Form 10-K. Accounting for Defensive Intangible Assets. In November 2008, Authoritative Guidance was issued, which applies to all acquired intangible assets in situations in which the acquirer does not intend to actively use the asset but intends to hold the asset to prevent its competitors from obtaining access to the asset (a defensive intangible asset). The standard is effective prospectively for intangible assets acquired on or after the beginning of the first annual reporting period beginning on or after December 15, 2008. Earlier application is not permitted. Our adoption of the standard in 2009 did not have an impact on our audited consolidated financial statements included in Part II, Item 8 of this Annual Report on Form 10-K. Determination of the Useful Life of Intangible Assets. In April 2008, the FASB issued a standard, which amends the factors that should be considered in developing renewal or extension assumptions used to determine the useful life of a recognized intangible asset and requires additional disclosure. The standard applies to all intangible assets, whether acquired in a business combination or otherwise, and is effective for financial statements issued for fiscal years beginning after December 15, 2008, and interim periods within those fiscal years. The guidance for determining the useful life of intangible assets is applied prospectively to intangible assets acquired after the effective date. The disclosure requirements apply prospectively to all intangible assets recognized as of, and subsequent to, the effective date. Our adoption of this standard in 2009 did not have a material impact on our audited consolidated financial statements included in Part II, Item 8 of this Annual Report on Form 10-K. For additional disclosures required under this standard, see Note 7, “Goodwill and Intangible Assets,” to the audited consolidated financial statements included in Part II, Item 8 of this Annual Report on Form 10-K. Disclosures about Derivative Instruments and Hedging Activities. In March 2008, the FASB issued a standard, which requires qualitative disclosures about objectives and strategies for using derivatives, quantitative disclosures about fair value amounts of gains and losses on derivative instruments and disclosures about credit-risk-related contingent features in derivative instruments. The standard is intended to improve financial reporting relating to derivative instruments and hedging activities by requiring enhanced disclosures to enable investors to better understand their effects on an entity’s financial position, financial performance, and cash flows. The standard is effective for financial statements issued for fiscal years and interim periods beginning after November 15, 2008. Our derivatives consist of interest rate swap agreements on $200 million of the $500 million in 7.25% senior notes due in 2013. These swap agreements were entered into as an effective hedge to (i) convert a portion of the senior note fixed rate debt into floating rate debt; (ii) maintain a capital structure containing appropriate amounts of fixed and floating rate debt; and (iii) lower the interest expense on these notes in the near term. We do not expect our future cash flows to be affected to any significant degree by a sudden change in market interest rates. For more information, see Note 4, “Fair Value Disclosures,” and Note 8, “Debt,” to our audited consolidated financial statements included in Part II, Item 8 of this Annual Report on Form 10-K. Our adoption of the standard in 2009 did not have a material impact on our audited consolidated financial statements included in Part II, Item 8 of this Annual Report on Form 10-K. Additional disclosures required under the standard are included above. 66
  • 79.
    Business Combinations. InDecember 2007, the FASB issued a standard, which is intended to improve, simplify, and converge internationally the accounting for business combinations and the reporting of noncontrolling interests in consolidated financial statements. The standard requires the acquiring entity in a business combination to measure and recognize all the assets acquired and liabilities assumed in the transaction; establishes the acquisition- date fair value as the measurement objective for all assets acquired and liabilities assumed; and requires the acquirer to disclose to investors and other users the information they need to evaluate and understand the nature and financial effect of the business combination. The standard is effective for fiscal years, and interim periods within those fiscal years, beginning on or after December 15, 2008. The standard applies prospectively to business combinations for which the acquisition date is on or after the beginning of the first annual reporting period beginning on or after December 15, 2008. In April 2009, the FASB issued additional guidance, which amends and clarifies the standard to address application issues, subsequent measurement and accounting, and disclosure of assets and liabilities arising from contingencies in a business combination. The guidance is effective for acquisition dates on or after the beginning of the first annual reporting period beginning on or after December 15, 2008. Our adoption of the standard did not have an impact on our audited consolidated financial statements included in Part II, Item 8 of this Annual Report on Form 10-K. Noncontrolling Interests in Consolidated Financial Statements. In December 2007, the FASB issued a standard, which is designed to improve the relevance, comparability, and transparency of financial information provided to investors by requiring all entities to report noncontrolling (minority) interests in subsidiaries in the same way—as equity in the consolidated financial statements. Moreover, the standard eliminates the diversity that existed in accounting for transactions between an entity and noncontrolling interests by requiring that they be treated as equity transactions. The standard is effective for fiscal years, and interim periods within those fiscal years, beginning on or after December 15, 2008. In addition, the standard must be applied prospectively as of the beginning of the fiscal year in which it is initially applied, except for the presentation and disclosure requirements. Our adoption of the standard did not have an impact on our audited consolidated financial statements included in Part II, Item 8 of this Annual Report on Form 10-K. Interim Disclosures about Fair Value of Financial Instruments. In April 2009, the FASB issued a standard, which enhances consistency in financial reporting by increasing the frequency of fair value disclosures. This standard is effective for interim and annual periods ending after June 15, 2009. Our adoption of this standard in the second quarter of 2009 did not have a material impact on our audited consolidated financial statements included in Part II, Item 8 of this Annual Report on Form 10-K. For additional disclosures required under this standard, see Note 4, “Fair Value Disclosures,” to the audited consolidated financial statements included in Part II, Item 8 of this Annual Report on Form 10-K. Employers’ Disclosures about Postretirement Benefit Plan Assets. In December 2008, the FASB issued a standard, which provides guidance on an employer’s disclosures about plan assets of a defined benefit pension or other postretirement plan. We adopted the disclosures about plan assets required by the standard prospectively for the fiscal year ended December 26, 2009. See Note 9, “Pension and Other Postretirement Benefits,” to our audited consolidated financial statements included in Part II, Item 8 of this Annual Report on Form 10-K for more information. The adoption of the standard did not have a material impact on our audited consolidated financial statements. Recently Issued Accounting Pronouncement. Fair Value Measurements and Disclosures. In January 2010, the FASB issued a standard, which amends the existing fair value measurements and disclosure standard and provides guidance on increased disclosures on transfers in and out of Levels 1 and 2 and activity in Level 3 fair value measurements. The standard also clarifies existing fair value measurement disclosure guidance about the level of disaggregation, inputs, and valuation techniques. The new disclosures and clarifications of existing disclosures are effective for interim and annual reporting periods beginning after December 15, 2009, except for the disclosures about purchases, sales, issuances, and settlements in the roll forward of activity in Level 3 fair value measurements, which are effective for fiscal years beginning after December 15, 2010, and for interim periods within those fiscal years. We do not expect the adoption of the standard to have a material impact on our consolidated financial statements. 67
  • 80.
    CONDENSED INTERIM FINANCIALDATA (UNAUDITED) (In millions, except for per share amounts) 2009 4th Quarter 3rd Quarter 2nd Quarter 1st Quarter Product net revenues(1) . . . . . . . . . . . . . . . . . . . . .... $15,024.9 $14,590.8 $14,729.6 $14,616.3 Service revenues . . . . . . . . . . . . . . . . . . . . . . . . .... 220.3 204.0 200.8 217.6 Total net revenues(1) . . . . . . . . . . . . . . . . . . .... 15,245.2 14,794.8 14,930.4 14,833.9 Cost of operations: Cost of product net revenues(1) . . . . . . . . . . . . . . . . . 14,138.6 13,696.5 13,856.1 13,832.0 Cost of service revenues . . . . . . . . . . . . . . . . . . . . . 79.5 58.3 58.5 57.8 Total cost of revenues(1) . . . . . . . . . . . . . . . . . . . . 14,218.1 13,754.8 13,914.6 13,889.8 Selling, general and administrative expenses . . . . . . . . 375.5 369.0 370.7 340.3 Amortization of intangibles . . . . . . . . . . . . . . . . . . . 75.5 78.4 75.9 75.9 Interest expense. . . . . . . . . . . . . . . . . . . . . . . . . . . 40.7 43.3 43.4 45.1 Interest (income) and other (income) expense, net . . . . (0.8) (3.4) (2.2) (3.5) Total costs and expenses . . . . . . . . . . . . . . . . . . . 14,709.0 14,242.1 14,402.4 14,347.6 Income before provision for income taxes . . . . . . . . . . . 536.2 552.7 528.0 486.3 Provision for income taxes . . . . . . . . . . . . . . . . . . . . . 194.7 217.1 215.9 195.3 Net income . . . . . . . . . . . . . . . . . . . . . . . . . . . . . . . $ 341.5 $ 335.6 $ 312.1 $ 291.0 Basic earnings per share: Weighted average shares outstanding . . . . . . . . . . . . . 477.0 475.4 479.6 492.2 Earnings per share . . . . ..................... $ 0.72 $ 0.71 $ 0.65 $ 0.59 Diluted earnings per share: Weighted average shares outstanding . . . . . . . . . . . . . 487.2 484.7 488.0 501.2 Earnings per share . . . . ..................... $ 0.70 $ 0.69 $ 0.64 $ 0.58 2008 4th Quarter 3rd Quarter 2nd Quarter(2) 1st Quarter Product net revenues(3) . . . . . . . . . . . . . . . . . . . . ... . $12,771.9 $12,390.3 $12,607.1 $12,806.9 Service revenues . . . . . . . . . . . . . . . . . . . . . . . . ... . 189.4 168.8 167.5 156.0 Total net revenues(3) . . . . . . . . . . . . . . . . . . ... . 12,961.3 12,559.1 12,774.6 12,962.9 Cost of operations: Cost of product net revenues(3) . . . . . . . . . . . . . . . . . 11,916.5 11,580.7 11,794.0 12,016.8 Cost of service revenues . . . . . . . . . . . . . . . . . . . . . 74.7 53.6 47.1 45.9 Total cost of revenues(3) . . . . . . . . . . . . . . . . . . . . 11,991.2 11,634.3 11,841.1 12,062.7 Selling, general and administrative expenses . . . . . . . . 381.0 347.2 368.4 328.4 Amortization of intangibles . . . . . . . . . . . . . . . . . . . 73.9 71.1 70.6 69.5 Interest expense. . . . . . . . . . . . . . . . . . . . . . . . . . . 60.0 61.5 61.6 50.6 Interest (income) and other (income) expense, net . . . . (2.4) (3.3) (4.1) 3.7 Total costs and expenses . . . . . . . . . . . . . . . . . . . 12,503.7 12,110.8 12,337.6 12,514.9 Income before provision for income taxes . . . . . . . . . . . 457.6 448.3 437.0 448.0 Provision for income taxes . . . . . . . . . . . . . . . . . . . . . 183.2 152.6 174.3 177.8 Net income . . . . . . . . . . . . . . . . . . . . . . . . . . . . . . . $ 274.4 $ 295.7 $ 262.7 $ 270.2 Basic earnings per share: Weighted average shares outstanding . . . . . . . . . . . . . 496.3 503.3 507.7 526.9 Earnings per share . . . . .................... . $ 0.55 $ 0.59 $ 0.52 $ 0.51 Diluted earnings per share: Weighted average shares outstanding . . . . . . . . . . . . . 505.3 513.4 517.6 537.8 Earnings per share . . . . .................... . $ 0.54 $ 0.58 $ 0.51 $ 0.50 (1) Includes retail co-payments of $2,173 million for the fourth quarter, $2,115 million for the third quarter, $2,114 million for the second quarter and $2,259 million for the first quarter of 2009. (2) The second quarter of 2008, and all subsequent periods, includes the operating results of majority-owned Europa Apotheek commencing on the April 28, 2008 acquisition date. (3) Includes retail co-payments of $1,836 million for the fourth quarter, $1,828 million for the third quarter, $1,900 million for the second quarter and $2,102 million for the first quarter of 2008. The fourth quarter of 2009 and the third quarter of 2008 include income tax benefits of $22 million and $28 million, respectively. The fourth quarters of 2009 and 2008 reflect costs of $18 million and $22 million, respectively, associated with implementation efforts for new clients commencing in 2010 and 2009. Additionally, 2008 reflects a first-quarter charge of $9.8 million for the ineffective portion of the forward-starting interest rate swap agreements associated with our March 2008 issuance of senior notes. 68
  • 81.
    Item 7A. Quantitative and Qualitative Disclosures about Market Risk. A description of quantitative and qualitative disclosures about market risk is contained in Part II, Item 7, “Management’s Discussion and Analysis of Financial Condition and Results of Operations—Liquidity and Capital Resources—Interest Rate and Foreign Exchange Risk.” Item 8. Financial Statements and Supplementary Data. INDEX TO CONSOLIDATED FINANCIAL STATEMENTS* Report of Independent Registered Public Accounting Firm . . . . . . . . . . . . . . . . . . . . . . . . . . . . . . . . . 70 Consolidated Balance Sheets as of December 26, 2009 and December 27, 2008 . . . . . . . . . . . . . . . . . 71 Consolidated Statements of Income for the Years Ended December 26, 2009, December 27, 2008 and December 29, 2007 . . . . . . . . . . . . . . . . . . . . . . . . . . . . . . . . . . . . . . . . . . . . . . . . . . . . . . . . . . . . 72 Consolidated Statements of Stockholders’ Equity for the Years Ended December 29, 2007, December 27, 2008 and December 26, 2009. . . . . . . . . . . . . . . . . . . . . . . . . . . . . . . . . . . . . . . . . . 73 Consolidated Statements of Cash Flows for the Years Ended December 26, 2009, December 27, 2008 and December 29, 2007 . . . . . . . . . . . . . . . . . . . . . . . . . . . . . . . . . . . . . . . . . . . . . . . . . . . . . . . . . 74 Notes to Consolidated Financial Statements . . . . . . . . . . . . . . . . . . . . . . . . . . . . . . . . . . . . . . . . . . . . 75 * Selected quarterly financial data for the fiscal years ended December 26, 2009 and December 27, 2008 is included herein under Part II, Item 7, “Management’s Discussion and Analysis of Financial Condition and Results of Operations—Condensed Interim Financial Data (Unaudited).” See Item 9A, “Controls and Procedures,” for Management’s Report on Internal Control over Financial Reporting. See Item 15, “Exhibits, Financial Statement Schedules,” for financial statement Schedule II, Valuation and Qualifying Accounts. 69
  • 82.
    Report of IndependentRegistered Public Accounting Firm To the Shareholders and Board of Directors of Medco Health Solutions, Inc.: In our opinion, the consolidated financial statements listed in the accompanying index present fairly, in all material respects, the financial position of Medco Health Solutions, Inc. and its subsidiaries (the “Company”) at December 26, 2009 and December 27, 2008, and the results of their operations and their cash flows for each of the three years in the period ended December 26, 2009 in conformity with accounting principles generally accepted in the United States of America. In addition, in our opinion, the financial statement schedule listed in the index appearing under Item 15(a)(2) presents fairly, in all material respects, the information set forth therein when read in conjunction with the related consolidated financial statements. Also in our opinion, the Company maintained, in all material respects, effective internal control over financial reporting as of December 26, 2009, based on criteria established in Internal Control – Integrated Framework issued by the Committee of Sponsoring Organizations of the Treadway Commission (COSO). The Company’s management is responsible for these financial statements and financial statement schedule, for maintaining effective internal control over financial reporting and for its assessment of the effectiveness of internal control over financial reporting, included in Management’s Report on Internal Control over Financial Reporting appearing under Item 9A. Our responsibility is to express opinions on these financial statements, on the financial statement schedule, and on the Company’s internal control over financial reporting based on our integrated audits. We conducted our audits in accordance with the standards of the Public Company Accounting Oversight Board (United States). Those standards require that we plan and perform the audits to obtain reasonable assurance about whether the financial statements are free of material misstatement and whether effective internal control over financial reporting was maintained in all material respects. Our audits of the financial statements included examining, on a test basis, evidence supporting the amounts and disclosures in the financial statements, assessing the accounting principles used and significant estimates made by management, and evaluating the overall financial statement presentation. Our audit of internal control over financial reporting included obtaining an understanding of internal control over financial reporting, assessing the risk that a material weakness exists, and testing and evaluating the design and operating effectiveness of internal control based on the assessed risk. Our audits also included performing such other procedures as we considered necessary in the circumstances. We believe that our audits provide a reasonable basis for our opinions. A company’s internal control over financial reporting is a process designed to provide reasonable assurance regarding the reliability of financial reporting and the preparation of financial statements for external purposes in accordance with generally accepted accounting principles. A company’s internal control over financial reporting includes those policies and procedures that (i) pertain to the maintenance of records that, in reasonable detail, accurately and fairly reflect the transactions and dispositions of the assets of the company; (ii) provide reasonable assurance that transactions are recorded as necessary to permit preparation of financial statements in accordance with generally accepted accounting principles, and that receipts and expenditures of the company are being made only in accordance with authorizations of management and directors of the company; and (iii) provide reasonable assurance regarding prevention or timely detection of unauthorized acquisition, use, or disposition of the company’s assets that could have a material effect on the financial statements. Because of its inherent limitations, internal control over financial reporting may not prevent or detect misstatements. Also, projections of any evaluation of effectiveness to future periods are subject to the risk that controls may become inadequate because of changes in conditions, or that the degree of compliance with the policies or procedures may deteriorate. /s/ PricewaterhouseCoopers LLP Florham Park, NJ February 23, 2010 70
  • 83.
    MEDCO HEALTH SOLUTIONS,INC. CONSOLIDATED BALANCE SHEETS (In millions, except for share data) December 26, December 27, 2009 2008 ASSETS Current assets: Cash and cash equivalents . . . . . . . . . . . . . . . . . . . . . . . . . . . . . . . . . . . . . . . . . $ 2,528.2 $ 938.4 Short-term investments . . . . . . . . . . . . . . . . . . . . . . . . . . . . . . . . . . . . . . . . . . . . 20.1 64.0 Manufacturer accounts receivable, net . . . . . . . . . . . . . . . . . . . . . . . . . . . . . . . . . 1,765.5 1,858.9 Client accounts receivable, net . . . . . . . . . . . . . . . . . . . . . . . . . . . . . . . . . . . . . . 2,063.3 1,680.5 Income taxes receivable . . . . . . . . . . . . . . . . . . . . . . . . . . . . . . . . . . . . . . . . . . . 198.3 213.4 Inventories, net . . . . . . . . . . . . . . . . . . . . . . . . . . . . . . . . . . . . . . . . . . . . . . . . . 1,285.3 1,856.5 Prepaid expenses and other current assets . . . . . . . . . . . . . . . . . . . . . . . . . . . . . . 67.1 326.6 Deferred tax assets . . . . . . . . . . . . . . . . . . . . . . . . . . . . . . . . . . . . . . . . . . . . . . . 230.8 159.2 Total current assets . . . . . ...................................... 8,158.6 7,097.5 Property and equipment, net . . . . . ...................................... 912.5 854.1 Goodwill . . . . . . . . . . . . . . . . . . . . ...................................... 6,333.0 6,331.4 Intangible assets, net . . . . . . . . . . . ...................................... 2,428.8 2,666.4 Other noncurrent assets . . . . . . . . . ...................................... 82.6 61.5 Total assets . . . . . . . . . . . . . . . . . . . . . . . . . . . . . . . . . . . . . . . . . . . . . . . . . $ 17,915.5 $ 17,010.9 LIABILITIES AND STOCKHOLDERS’ EQUITY Current liabilities: Claims and other accounts payable . . . . . . . . . . . . . . . . . . . . . . . . . . . . . . . . . . . $ 3,506.4 $ 2,878.9 Client rebates and guarantees payable . . . . . . . . . . . . . . . . . . . . . . . . . . . . . . . . . 2,106.9 1,658.7 Accrued expenses and other current liabilities . . . . . . . . . . . . . . . . . . . . . . . . . . . 718.6 660.4 Short-term debt . . . . . . . . . . . . . . . . . . . . . . . . . . . . . . . . . . . . . . . . . . . . . . . . . 15.8 600.0 Total current liabilities . . ...................................... 6,347.7 5,798.0 Long-term debt, net . . . . . . . . . . . . ...................................... 4,000.1 4,002.9 Deferred tax liabilities . . . . . . . . . . ...................................... 958.8 1,065.3 Other noncurrent liabilities . . . . . . ...................................... 221.7 186.8 Total liabilities . . . . . . . . . . . . . . . . . . . . . . . . . . . . . . . . . . . . . . . . . . . . . . 11,528.3 11,053.0 Commitments and contingencies (See Note 14) Stockholders’ equity: Preferred stock, par value $0.01—authorized: 10,000,000 shares; issued and outstanding: 0. . . . . . . . . . . . . . . . . . . . . . . . . . . . . . . . . . . . . . . . . . . . . . . . . — — Common stock, par value $0.01—authorized: 2,000,000,000 shares; issued: 660,846,867 shares at December 26, 2009 and 652,386,763 shares at December 27, 2008 . . . . . . . . . . . . . . . . . . . . . . . . . . . . . . . . . . . . . . . . . . . . 6.6 6.5 Accumulated other comprehensive loss . . . . . . . . . . . . . . . . . . . . . . . . . . . . . . . . (44.2) (63.8) Additional paid-in capital . . . . . . . . . . . . . . . . . . . . . . . . . . . . . . . . . . . . . . . . . . 8,156.7 7,788.9 Retained earnings . . . . . . . . . . . . . . . . . . . . . . . . . . . . . . . . . . . . . . . . . . . . . . . . 5,209.6 3,929.3 13,328.7 11,660.9 Treasury stock, at cost: 186,353,868 shares at December 26, 2009 and 159,061,394 shares at December 27, 2008 . . . . . . . . . . . . . . . . . . . . . . . . . . . . (6,941.5) (5,703.0) Total stockholders’ equity . . . . . . . . . . . . . . . . . . . . . . . . . . . . . . . . . . . . . . 6,387.2 5,957.9 Total liabilities and stockholders’ equity . . . . . . . . . . . . . . . . . . . . . . . . . . . $ 17,915.5 $ 17,010.9 The accompanying notes are an integral part of these consolidated financial statements. 71
  • 84.
    MEDCO HEALTH SOLUTIONS,INC. CONSOLIDATED STATEMENTS OF INCOME (In millions, except for per share data) December 26, December 27, December 29, For Fiscal Years Ended 2009 2008 2007 Product net revenues (Includes retail co-payments of $8,661 for 2009, $7,666 for 2008, and $7,553 for 2007) . . . . . . . . . . . . . . . . $ 58,961.4 $ 50,576.2 $ 43,961.9 Service revenues . . . . . . . . . . . . . . . . . . . . . . . . . . . . . . . . . . . . . . 842.8 681.8 544.3 Total net revenues . . . . . . . . . . . . . . . . . . . . . . . . . . . . . . . . . . 59,804.2 51,258.0 44,506.2 Cost of operations: Cost of product net revenues (Includes retail co-payments of $8,661 for 2009, $7,666 for 2008, and $7,553 for 2007) . . . . . . 55,523.1 47,308.2 41,402.6 Cost of service revenues . . . . . . . . . . . . . . . . . . . . . . . . . . . . . . . 254.1 221.4 158.3 Total cost of revenues . . . . . . . . . . . . . . . . . . . . . . . . . . . . . . . . . 55,777.2 47,529.6 41,560.9 Selling, general and administrative expenses . . . . . . . . . . . . . . . . 1,455.5 1,425.0 1,114.1 Amortization of intangibles . . . . . . . . . . . . . . . . . . . . . . . . . . . . . 305.6 285.1 228.1 Interest expense . . . . . . . . . . . . . . . . . . . . . . . . . . . . . . . . . . . . . 172.5 233.7 134.2 Interest (income) and other (income) expense, net . . . . . . . . . . . . (9.9) (6.2) (34.4) Total costs and expenses . . . . . . . . . . . . . . . . . . . . . . . . . . . . . 57,700.9 49,467.2 43,002.9 Income before provision for income taxes . . . . . . . . . . . . . . . . . . . . 2,103.3 1,790.8 1,503.3 Provision for income taxes . . . . . . . . . . . . . . . . . . . . . . . . . . . . . . . 823.0 687.9 591.3 Net income . . . . . . . . . . . . . . . . . . . . . . . . . . . . . . . . . . . . . . . . . . $ 1,280.3 $ 1,102.9 $ 912.0 Basic weighted average shares outstanding(1) . . . . . . . . . . . . . . . . . . 481.1 508.6 550.2 Basic earnings per share(1) . . . . . . . . . . . . . . . . . . . . . . . . . . . . . . . $ 2.66 $ 2.17 $ 1.66 Diluted weighted average shares outstanding(1) . . . . . . . . . . . . . . . . 490.0 518.6 560.9 Diluted earnings per share(1) . . . . . . . . . . . . . . . . . . . . . . . . . . . . . . $ 2.61 $ 2.13 $ 1.63 (1) Common share and per share amounts have been retrospectively adjusted to reflect the January 24, 2008 two-for-one stock split. See Note 1, “Background and Basis of Presentation” for additional information. The accompanying notes are an integral part of these consolidated financial statements. 72
  • 85.
    MEDCO HEALTH SOLUTIONS,INC. CONSOLIDATED STATEMENTS OF STOCKHOLDERS’ EQUITY (Shares in thousands; $ in millions, except for per share data) Shares of Shares Accumulated Common of $0.01 Par Value Other Stock Treasury Common Comprehensive Additional Retained Treasury Issued(1) Stock(1) Stock(1) Income (Loss) Paid-in Capital(1) Earnings Stock Total Balances at December 30, 2006. . . . . . . . . . 635,019 58,122 $6.3 $ 15.3 $7,153.1 $1,885.1 $(1,556.3) $ 7,503.5 Comprehensive income: Net income . . . . . . . . . . . . . . . . . . . . . — — — — — 912.0 — 912.0 Other comprehensive income (loss)(2): Unrealized loss on cash flow hedge, net of tax . . . . . . . . . . . . . . . . . . . . . . — — — (4.8) — — — (4.8) Defined benefit plans, net of tax: Net prior service cost . . . . . . . . . . . — — — (4.5) — — — (4.5) Net gain (loss) . . . . . . . . . . . . . . . . — — — 0.4 — — — 0.4 Other comprehensive income (loss) . . . . . . — — — (8.9) — — — (8.9) Total comprehensive income . . . . . . . . . . . . — — — (8.9) — 912.0 — 903.1 Adoption of FASB standard on accounting for uncertainty in income taxes(3) . . . . . . . . . — — — — — 29.3 — 29.3 Stock option activity, including tax benefit . . 11,876 — 0.1 — 334.7 — — 334.8 Issuance of common stock under employee stock purchase plans . . . . . . . . . . . . . . . 365 — — — 13.0 — — 13.0 Restricted stock and restricted stock unit activity, including tax benefit . . . . . . . . . . 125 — — — 52.2 — — 52.2 Treasury stock acquired . . . . . . . . . . . . . . . — 53,323 — — — — (1,960.6) (1,960.6) Balances at December 29, 2007. . . . . . . . . . 647,385 111,445 6.4 6.4 7,553.0 2,826.4 (3,516.9) 6,875.3 Comprehensive income: Net income . . . . . . . . . . . . . . . . . . . . . — — — — — 1,102.9 — 1,102.9 Other comprehensive income (loss)(2): Unrealized loss on investments, net of tax . . . . . . . . . . . . . . . . . . . . . . . . — — — (0.2) — — — (0.2) Foreign currency translation gain (loss) . . . . . . . . . . . . . . . . . . . . . . — — — (15.5) — — — (15.5) Unrealized loss on cash flow hedge, net of amortization, net of tax . . . . . . . . — — — (15.2) — — — (15.2) Defined benefit plans, net of tax: Net prior service cost . . . . . . . . . . . — — — (3.0) — — — (3.0) Net gain (loss) . . . . . . . . . . . . . . . . — — — (36.3) — — — (36.3) Other comprehensive income (loss) . . . . . . — — — (70.2) — — — (70.2) Total comprehensive income . . . . . . . . . . . . — — — (70.2) — 1,102.9 — 1,032.7 Stock option activity, including tax benefit . . 3,444 — 0.1 — 167.6 — — 167.7 Issuance of common stock under employee stock purchase plan . . . . . . . . . . . . . . . . 400 — — — 18.7 — — 18.7 Restricted stock and restricted stock unit activity, including tax benefit . . . . . . . . . . 1,158 — — — 49.6 — — 49.6 Treasury stock acquired . . . . . . . . . . . . . . . — 47,616 — — — — (2,186.1) (2,186.1) Balances at December 27, 2008. . . . . . . . . . 652,387 159,061 6.5 (63.8) 7,788.9 3,929.3 (5,703.0) 5,957.9 Comprehensive income: Net income . . . . . . . . . . . . . . . . . . . . . — — — — — 1,280.3 — 1,280.3 Other comprehensive income (loss)(2): Unrealized loss on investments, net of tax . . . . . . . . . . . . . . . . . . . . . . . . — — — (0.1) — — — (0.1) Foreign currency translation gain (loss) . . . . . . . . . . . . . . . . . . . . . . — — — 2.9 — — — 2.9 Amortization of unrealized loss on cash flow hedge, net of tax . . . . . . . . . . . — — — 1.9 — — — 1.9 Defined benefit plans, net of tax: Net prior service cost . . . . . . . . . . . — — — (2.4) — — — (2.4) Net gain (loss) . . . . . . . . . . . . . . . . — — — 17.3 — — — 17.3 Other comprehensive income (loss) . . . . . . — — — 19.6 — — — 19.6 Total comprehensive income . . . . . . . . . . . . — — — 19.6 — 1,280.3 — 1,299.9 Stock option activity, including tax benefit . . 6,997 — 0.1 — 298.4 — — 298.5 Issuance of common stock under employee stock purchase plan . . . . . . . . . . . . . . . . 461 — — — 20.8 — — 20.8 Restricted stock unit activity, including tax benefit . . . . . . . . . . . . . . . . . . . . . . . . 1,002 — — — 48.6 — — 48.6 Treasury stock acquired . . . . . . . . . . . . . . . — 27,293 — — — — (1,238.5) (1,238.5) Balances at December 26, 2009. . . . . . . . . . 660,847 186,354 $6.6 $(44.2) $8,156.7 $5,209.6 $(6,941.5) $ 6,387.2 (1) Share data, common stock and additional paid-in-capital have been retrospectively adjusted to reflect the January 24, 2008 two-for-one stock split. See Note 1, “Background and Basis of Presentation,” for more information. (2) See Note 2, “Summary of Significant Accounting Policies—Other Comprehensive Income and Accumulated Other Comprehensive Income,” for more information. (3) See Note 2, “Summary of Significant Accounting Policies—Income Taxes,” for more information. The accompanying notes are an integral part of these consolidated financial statements. 73
  • 86.
    MEDCO HEALTH SOLUTIONS,INC. CONSOLIDATED STATEMENTS OF CASH FLOWS (In millions) December 26, December 27, December 29, For Fiscal Years Ended 2009 2008 2007 Cash flows from operating activities: Net income. . . . . . . . . . . . . . . . . . . . . . . . . . . . . . . . . . . . . . . . . $ 1,280.3 $ 1,102.9 $ 912.0 Adjustments to reconcile net income to net cash provided by operating activities: Depreciation . . . . . . . . . . . . . . . . . . . . . . . . . . . . . . . . . . . . . . 179.0 157.7 168.9 Amortization of intangibles . . . . . . . . . . . . . . . . . . . . . . . . . . . 305.6 285.1 228.1 Deferred income taxes. . . . . . . . . . . . . . . . . . . . . . . . . . . . . . . (222.1) (99.6) (134.1) Stock-based compensation on employee stock plans . . . . . . . . . 146.0 131.7 102.5 Tax benefit on employee stock plans . . . . . . . . . . . . . . . . . . . . 106.2 67.9 102.2 Excess tax benefits from stock-based compensation arrangements . . . . . . . . . . . . . . . . . . . . . . . . . . . . . . . . . . . . (64.3) (41.8) (69.9) Other . . . . . . . . . . . . . . . . . . . . . . . . . . . . . . . . . . . . . . . . . . . 138.3 110.7 65.0 Net changes in assets and liabilities (net of acquisition effects, 2008 and 2007 only): Manufacturer accounts receivable, net . . . . . . . . . . . . . . . . . . . 93.4 (341.2) 25.9 Client accounts receivable, net. . . . . . . . . . . . . . . . . . . . . . . . . (515.4) (418.5) 65.0 Inventories, net . . . . . . . . . . . . . . . . . . . . . . . . . . . . . . . . . . . . 571.4 93.0 (218.1) Prepaid expenses and other current assets . . . . . . . . . . . . . . . . 259.6 (39.7) (4.9) Income taxes receivable . . . . . . . . . . . . . . . . . . . . . . . . . . . . . 15.1 2.6 (3.1) Other noncurrent assets . . . . . . . . . . . . . . . . . . . . . . . . . . . . . . 12.8 17.2 2.1 Claims and other accounts payable . . . . . . . . . . . . . . . . . . . . . 627.2 54.3 (119.2) Client rebates and guarantees payable . . . . . . . . . . . . . . . . . . . 448.2 566.5 206.1 Accrued expenses and other current and noncurrent liabilities . . 120.1 (13.7) 38.5 Net cash provided by operating activities . . . . . . . . . . . . . . . . . . . . 3,501.4 1,635.1 1,367.0 Cash flows from investing activities: Capital expenditures . . . . . . . . . . . . . . . . . . . . . . . . . . . . . . . . . . (238.8) (286.9) (177.7) Purchases of securities and other assets . . . . . . . . . . . . . . . . . . . . (153.4) (124.8) (181.7) Acquisitions of businesses, net of cash acquired. . . . . . . . . . . . . . — (126.5) (1,530.6) Proceeds from sale of securities and other investments . . . . . . . . . 87.2 122.0 176.2 Net cash used by investing activities . . . . . . . . . . . . . . . . . . . . . . . . (305.0) (416.2) (1,713.8) Cash flows from financing activities: Proceeds from long-term debt . . . . . . . . . . . . . . . . . . . . . . . . . . . — 3,295.7 2,400.0 Repayments on long-term debt . . . . . . . . . . . . . . . . . . . . . . . . . . — (2,210.0) (688.4) Proceeds from short-term debt. . . . . . . . . . . . . . . . . . . . . . . . . . . 15.8 — 275.0 Repayments under accounts receivable financing facility . . . . . . . (600.0) — — Debt issuance costs. . . . . . . . . . . . . . . . . . . . . . . . . . . . . . . . . . . (0.4) (11.2) (1.8) Settlement of cash flow hedge. . . . . . . . . . . . . . . . . . . . . . . . . . . — (45.4) — Purchases of treasury stock . . . . . . . . . . . . . . . . . . . . . . . . . . . . . (1,238.5) (2,186.1) (1,960.6) Excess tax benefits from stock-based compensation arrangements . . . . . . . . . . . . . . . . . . . . . . . . . . . . . . . . . . . . . 64.3 41.8 69.9 Net proceeds from employee stock plans . . . . . . . . . . . . . . . . . . . 152.2 60.6 208.3 Net cash (used by) provided by financing activities . . . . . . . . . . . . . (1,606.6) (1,054.6) 302.4 Net increase (decrease) in cash and cash equivalents . . . . . . . . . . . . 1,589.8 164.3 (44.4) Cash and cash equivalents at beginning of year . . . . . . . . . . . . . . . . 938.4 774.1 818.5 Cash and cash equivalents at end of year . . . . . . . . . . . . . . . . . . . . $ 2,528.2 $ 938.4 $ 774.1 Supplemental disclosures of cash flow information: Cash paid during the year for interest . . . . . . . . . . . . . . . . . . . . . $ 168.2 $ 207.1 $ 123.4 Cash paid during the year for income taxes . . . . . . . . . . . . . . . . . $ 913.9 $ 748.9 $ 668.5 The accompanying notes are an integral part of these consolidated financial statements. 74
  • 87.
    MEDCO HEALTH SOLUTIONS,INC. NOTES TO CONSOLIDATED FINANCIAL STATEMENTS 1. BACKGROUND AND BASIS OF PRESENTATION Medco Health Solutions, Inc., (“Medco” or the “Company”) is a leading healthcare company that is pioneering the world’s most advanced pharmacy» and its clinical research and innovations are part of Medco making medicine smarterTM for approximately 65 million members. Medco provides clinically-driven pharmacy services designed to improve the quality of care and lower total healthcare costs for private and public employers, health plans, labor unions and government agencies of all sizes, and for individuals served by Medicare Part D Prescription Drug Plans. The Company’s unique Medco Therapeutic Resource Centers», which conduct therapy management programs using Medco specialist pharmacists who have expertise in the medications used to treat certain chronic conditions, and Accredo Health Group, Medco’s Specialty Pharmacy, represent innovative models for the care of patients with chronic and complex conditions. The Company’s business model requires collaboration with retail pharmacies, physicians, the Centers for Medicare & Medicaid Services (“CMS”) for Medicare, pharmaceutical manufacturers, and particularly in Specialty Pharmacy, collaboration with state Medicaid agencies, and other third-party payors such as health insurers. The Company’s programs and services help control the cost and enhance the quality of prescription drug benefits. The Company accomplishes this by providing pharmacy benefit management (“PBM”) services through its national networks of retail pharmacies and its own mail-order pharmacies, as well as through Accredo Health Group, which the Company believes is the nation’s largest specialty pharmacy based on revenues. Medco’s Therapeutic Resource Center focused on diabetes was augmented with the 2007 acquisition of PolyMedica Corporation (“PolyMedica”), through which the Company believes it became the largest diabetes pharmacy care practice based on covered patients. In 2008, the Company also extended its capabilities abroad when it acquired a majority interest in Europa Apotheek Venlo B.V. (“Europa Apotheek”), a privately held company based in the Netherlands that primarily provides mail-order pharmacy services in Germany. See Note 3, “Acquisitions of Businesses,” for more information. In 2009, Medco advanced its European healthcare initiatives through a joint venture with United Drug plc, a pan- European healthcare leader, to provide home-based pharmacy care services in the United Kingdom for patients covered by the country’s National Health Service. Additionally, the Company’s commitment to advancing the science of personalized medicine is further demonstrated by its January 2010 acquisition of DNA Direct, Inc., a leader in providing guidance and decision support to payors, physicians and patients, on a range of complex issues related to genomic medicine. When the term “mail order” is used, Medco means inventory dispensed through Medco’s mail-order pharmacy operations. On November 29, 2007, the Company announced that its Board of Directors approved a two-for-one stock split, which was effected in the form of a 100% stock dividend and distributed on January 24, 2008, to shareholders of record at the close of business on January 10, 2008. The Company’s total authorized common stock increased from 1,000,000,000 shares to 2,000,000,000 shares. The par value of the common stock was unchanged by this action. All share and per share amounts have been retrospectively adjusted for the increase in issued and outstanding shares after giving effect to the stock split. Stockholders’ equity has also been restated to retroactively apply the effects of the stock split. For all periods presented, the par value of the additional shares resulting from the stock split has been reclassified from additional paid-in capital to common stock. 2. SUMMARY OF SIGNIFICANT ACCOUNTING POLICIES Recently Adopted Financial Accounting Standards. Subsequent Events. In May 2009, the Financial Accounting Standards Board (“FASB”) issued a standard, which establishes general standards of accounting for and disclosure of events that occur after the balance sheet date but before financial statements are issued or are available to be issued. It requires the disclosure of the date through which an entity has evaluated subsequent events and the basis for that date; that is, whether that date represents the date the financial statements were issued or were available to be issued. The standard was effective for interim or annual financial periods ending after June 15, 2009. The Company adopted the standard in the second quarter of 2009. The Company has evaluated subsequent events through February 23, 2010, the filing date of this Annual Report on Form 10-K. The Company’s adoption of the standard did not have a material impact on its audited consolidated financial statements included in this Annual Report on Form 10-K. 75
  • 88.
    Accounting for DefensiveIntangible Assets. In November 2008, Authoritative Guidance was issued, which applies to all acquired intangible assets in situations in which the acquirer does not intend to actively use the asset but intends to hold the asset to prevent its competitors from obtaining access to the asset (a defensive intangible asset). The standard is effective prospectively for intangible assets acquired on or after the beginning of the first annual reporting period beginning on or after December 15, 2008. Earlier application is not permitted. The Company’s adoption of the standard in 2009 did not have an impact on its audited consolidated financial statements included in this Annual Report on Form 10-K. Determination of the Useful Life of Intangible Assets. In April 2008, the FASB issued a standard, which amends the factors that should be considered in developing renewal or extension assumptions used to determine the useful life of a recognized intangible asset and requires additional disclosure. The standard applies to all intangible assets, whether acquired in a business combination or otherwise, and is effective for financial statements issued for fiscal years beginning after December 15, 2008, and interim periods within those fiscal years. The guidance for determining the useful life of intangible assets is applied prospectively to intangible assets acquired after the effective date. The disclosure requirements apply prospectively to all intangible assets recognized as of, and subsequent to, the effective date. The Company’s adoption of this standard in 2009 did not have a material impact on its audited consolidated financial statements included in this Annual Report on Form 10-K. For additional disclosures required under this standard, see Note 7, “Goodwill and Intangible Assets.” Disclosures about Derivative Instruments and Hedging Activities. In March 2008, the FASB issued a standard, which requires qualitative disclosures about objectives and strategies for using derivatives, quantitative disclosures about fair value amounts of gains and losses on derivative instruments and disclosures about credit-risk-related contingent features in derivative instruments. The standard is intended to improve financial reporting relating to derivative instruments and hedging activities by requiring enhanced disclosures to enable investors to better understand their effects on an entity’s financial position, financial performance, and cash flows. The standard is effective for financial statements issued for fiscal years and interim periods beginning after November 15, 2008. Our derivatives consist of interest rate swap agreements on $200 million of the $500 million in 7.25% senior notes due in 2013. These swap agreements were entered into as an effective hedge to (i) convert a portion of the senior note fixed rate debt into floating rate debt; (ii) maintain a capital structure containing appropriate amounts of fixed and floating rate debt; and (iii) lower the interest expense on these notes in the near term. The Company does not expect its future cash flows to be affected to any significant degree by a sudden change in market interest rates. For more information, see Note 4, “Fair Value Disclosures,” and Note 8, “Debt.” The Company’s adoption of the standard in 2009 did not have a material impact on its audited consolidated financial statements included in this Annual Report on Form 10-K. Additional disclosures required under the standard are included above. Business Combinations. In December 2007, the FASB issued a standard, which is intended to improve, simplify, and converge internationally the accounting for business combinations and the reporting of noncontrolling interests in consolidated financial statements. The standard requires the acquiring entity in a business combination to measure and recognize all the assets acquired and liabilities assumed in the transaction; establishes the acquisition- date fair value as the measurement objective for all assets acquired and liabilities assumed; and requires the acquirer to disclose to investors and other users the information they need to evaluate and understand the nature and financial effect of the business combination. The standard is effective for fiscal years, and interim periods within those fiscal years, beginning on or after December 15, 2008. The standard applies prospectively to business combinations for which the acquisition date is on or after the beginning of the first annual reporting period beginning on or after December 15, 2008. In April 2009, the FASB issued additional guidance, which amends and clarifies the standard to address application issues, subsequent measurement and accounting, and disclosure of assets and liabilities arising from contingencies in a business combination. The guidance is effective for acquisition dates on or after the beginning of the first annual reporting period beginning on or after December 15, 2008. The Company’s adoption of the standard did not have an impact on its audited consolidated financial statements included in this Annual Report on Form 10-K. 76
  • 89.
    Noncontrolling Interests inConsolidated Financial Statements. In December 2007, the FASB issued a standard, which is designed to improve the relevance, comparability, and transparency of financial information provided to investors by requiring all entities to report noncontrolling (minority) interests in subsidiaries in the same way—as equity in the consolidated financial statements. Moreover, the standard eliminates the diversity that existed in accounting for transactions between an entity and noncontrolling interests by requiring that they be treated as equity transactions. The standard is effective for fiscal years, and interim periods within those fiscal years, beginning on or after December 15, 2008. In addition, the standard must be applied prospectively as of the beginning of the fiscal year in which it is initially applied, except for the presentation and disclosure requirements. The Company’s adoption of the standard did not have an impact on its audited consolidated financial statements included in this Annual Report on Form 10-K. Interim Disclosures about Fair Value of Financial Instruments. In April 2009, the FASB issued a standard, which enhances consistency in financial reporting by increasing the frequency of fair value disclosures. This standard is effective for interim and annual periods ending after June 15, 2009. The Company’s adoption of this standard in the second quarter of 2009 did not have a material impact on its audited consolidated financial statements included in this Annual Report on Form 10-K. For additional disclosures required under this standard, see Note 4, “Fair Value Disclosures.” Employers’ Disclosures about Postretirement Benefit Plan Assets. In December 2008, the FASB issued a standard, which provides guidance on an employer’s disclosures about plan assets of a defined benefit pension or other postretirement plan. The Company adopted the disclosures about plan assets required by the standard prospectively for the fiscal year ended December 26, 2009. See Note 9, “Pension and Other Postretirement Benefits,” for more information. The adoption of the standard did not have a material impact on the Company’s audited consolidated financial statements. Fiscal Years. The Company’s fiscal years ended on the last Saturday in December. Fiscal years 2009, 2008 and 2007 each are comprised of 52 weeks. Unless otherwise stated, references to years in the consolidated financial statements relate to fiscal years. Principles of Consolidation. The consolidated financial statements include the accounts of the Company and all of its subsidiaries. Investments in affiliates over which the Company has significant influence, but neither a controlling interest nor a majority interest in the risks or rewards of the investee, are accounted for using the equity method. The Company’s equity investments are not significant. Intercompany accounts have been eliminated in consolidation. Cash and Cash Equivalents. Cash includes currency on hand and time deposits with banks or other financial institutions. Cash equivalents represent money market mutual funds, a form of highly liquid investments with original maturities of less than three months. As a result of the Company’s normal payment cycle, cash disbursement accounts representing outstanding checks not yet presented for payment of $1,594.2 million and $1,411.1 million are included in claims and other accounts payable, and client rebates and guarantees payable at December 26, 2009 and December 27, 2008, respectively, including certain amounts reclassified from cash. No overdraft or unsecured short- term loan exists in relation to these negative balances. Long-Term and Short-Term Investments. The Company holds long-term and short-term investments in U.S. government securities to satisfy the statutory capital requirements for the Company’s insurance subsidiaries. The majority of these long-term and short-term investments are classified as held-to-maturity securities and reported at amortized cost. The Company has no exposure to or investments in any instruments associated with the sub-prime loan market. Fair Value Measurements and Fair Value of Financial Instruments. The Company accounts for and reports the fair value of certain assets and liabilities in accordance with FASB standards. See Note 4, “Fair Value Disclosures,” for more information. 77
  • 90.
    Accounts Receivable. TheCompany separately reports accounts receivable due from manufacturers and accounts receivable due from clients. Manufacturer accounts receivable, net, includes billed and estimated unbilled receivables from manufacturers for earned rebates and other prescription services. Unbilled rebates receivable from manufacturers are generally billed beginning 20 days from the end of each quarter. Client accounts receivable, net, includes billed and estimated unbilled receivables from clients for the PBM and Specialty Pharmacy segments. Unbilled PBM receivables are primarily from clients and are typically billed within 14 days based on the contractual billing schedule agreed upon with each client. At the end of any given reporting period, unbilled PBM receivables from clients may represent up to two weeks of dispensing activity and will fluctuate at the end of a fiscal month depending on the timing of these billing cycles. Client accounts receivable, net, also includes a reduction for rebates and guarantees payable to clients when such are settled on a net basis in the form of an invoice credit. In cases where rebates and guarantees are settled with the client on a net basis, and the rebates and guarantees payable are greater than the corresponding client accounts receivable balances, the net liability is reclassified to client rebates and guarantees payable on the consolidated balance sheets. When these payables are settled in the form of a check or wire, they are recorded on a gross basis and the entire liability is reflected in client rebates and guarantees payable on the consolidated balance sheets. The Company’s client accounts receivable also includes receivables from CMS for the Company’s Medicare Part D Prescription Drug Program (“Medicare Part D”) product offerings and premiums from members. A component of the PBM business includes diabetes supplies dispensed by PolyMedica with the associated receivables primarily reimbursed from insurance companies and government agencies. As a result, this component of the PBM business experiences slower accounts receivable turnover. As of December 26, 2009 and December 27, 2008, identified net Specialty Pharmacy accounts receivable, primarily due from payors and patients, amounted to $483.1 million and $476.4 million, respectively. A portion of the Specialty Pharmacy business includes reimbursement by payors, such as insurance companies, under a medical benefit, or by Medicare or Medicaid. These transactions also involve higher patient co-payments than experienced in the PBM business. As a result, this portion of the Specialty Pharmacy business, which yields a higher margin than the PBM business, experiences slower accounts receivable turnover than in the aforementioned PBM cycle and has a different credit risk profile. See Note 13, “Segment and Geographic Data,” for more information on the Specialty Pharmacy segment. The Company’s allowance for doubtful accounts as of December 26, 2009 and December 27, 2008 of $133.3 million and $120.0 million, respectively, includes $86.1 million and $71.9 million, respectively, related to the Specialty Pharmacy segment. The relatively higher allowance for the Specialty Pharmacy segment reflects a different credit risk profile than the PBM business, and is characterized by reimbursement through medical coverage, including government agencies, and higher patient co-payments. The Company’s allowance for doubtful accounts as of December 26, 2009 and December 27, 2008 also includes $37.4 million and $34.6 million, respectively, related to PolyMedica for diabetes supplies, which are primarily reimbursed by insurance companies and government agencies. In addition, the Company’s allowance for doubtful accounts also reflects amounts associated with member premiums for the Company’s Medicare Part D product offerings. The Company regularly reviews and analyzes the adequacy of the allowances based on a variety of factors, including the age of the outstanding receivable and the collection history. When circumstances related to specific collection patterns change, estimates of the recoverability of receivables are adjusted. The increase in the reserve balance reflects increased coverage of aged balances. Concentrations of Risks. In 2009, 2008 and 2007, the Company had one client that represented 19%, 21% and 22% of net revenues, respectively. The client has a strong investment grade rating and has consistently paid their receivable balance within the contracted payment terms. None of the Company’s other clients individually represented more than 10% of net revenues or net client accounts receivable in 2009, 2008 or 2007. The Company has credit risk associated with certain accounts receivable, which consists of amounts owed by various governmental agencies, insurance companies and private patients. The Company has clients in various industries, including the automobile manufacturer industry and the financial industry, as well as governmental agencies. The Company actively monitors the status of its accounts receivable and has mechanisms in place to minimize the potential for incurring material accounts receivable credit risk. Concentration of credit risk relating to these accounts receivable, excluding the largest client noted above, is limited by the diversity and number of patients and payors. 78
  • 91.
    As of December26, 2009 and December 27, 2008, two brand-name pharmaceutical manufacturers represented approximately 41% and 30% of manufacturer accounts receivable, net, respectively. Both manufacturers have strong investment grade ratings and have consistently paid their receivable balance within the contracted payment terms. To date, the Company has not experienced any significant deterioration in its client or manufacturer accounts receivables. The Company purchases its pharmaceuticals either from its primary wholesaler, AmerisourceBergen Corp., which accounted for approximately 62% of both the Company’s overall 2009 and 2008 drug purchases, respectively, or directly from pharmaceutical manufacturers. Most of the purchases from the Company’s primary wholesaler were for brand-name medicines. The Company believes that alternative sources of supply for most generic and brand- name pharmaceuticals are readily available, except to the extent that brand-name drugs are available to the market exclusively through the manufacturer. The Company derives a substantial percentage of its Specialty Pharmacy segment revenue and profitability from its relationships with a limited number of suppliers. Specialty and generic pharmaceuticals are generally purchased directly from manufacturers. Inventories, Net. Inventories, net, are located in the Company’s mail-order pharmacies and in warehouses, consist solely of finished product (primarily prescription drugs), and are valued at the lower of first-in, first-out (FIFO) cost or market. Property and Equipment, Net. Property and equipment, net, is stated at cost, less accumulated depreciation and amortization. Depreciation is calculated using the straight-line method for assets with useful lives as follows: buildings, 45 years; machinery, equipment and office furnishings, three to 15 years; and computer software, three to five years. Leasehold improvements are amortized over the shorter of the remaining life of the lease or the useful lives of the assets. In accordance with Authoritative Guidance on accounting for the costs of computer software developed or obtained for internal use, certain costs of computer software developed or obtained for internal use are capitalized and amortized on a straight-line basis over three to five years. Costs for general and administrative expenses, overhead, maintenance and training, as well as the cost of software coding that does not add functionality to existing systems, are expensed as incurred. Net Revenues. Product net revenues consist principally of sales of prescription drugs to clients and members, either through the Company’s networks of contractually affiliated retail pharmacies or through the Company’s mail- order pharmacies. The majority of the Company’s product net revenues are derived on a fee-for-service basis. The Company’s product net revenues also include revenues from the sale of diabetes supplies by PolyMedica. Specialty pharmacy product net revenues represent revenues from the sale of primarily biopharmaceutical drugs and are reported at the net amount billed to third-party payors and patients. The Company recognizes product revenues when the prescriptions are dispensed through retail pharmacies in the Company’s networks of contractually affiliated retail pharmacies or the Company’s mail-order pharmacies and received by members and patients. The Company evaluates client contracts using the indicators of Authoritative Guidance to determine whether the Company acts as a principal or as an agent in the fulfillment of prescriptions through the retail pharmacy network. The Company acts as a principal in most of its transactions with clients and revenues are recognized at the prescription price (ingredient cost plus dispensing fee) negotiated with clients, including the portion of the price allocated by the client to be settled directly by the member (co-payment), as well as the Company’s administrative fees (“Gross Reporting”). Gross reporting is appropriate because the Company (a) has separate contractual relationships with clients and with pharmacies, (b) is responsible to validate and economically manage a claim through its claims adjudication process, (c) commits to set prescription prices for the pharmacy, including instructing the pharmacy as to how that price is to be settled (co-payment requirements), (d) manages the overall prescription drug relationship with the patients, who are members of clients’ plans, and (e) has credit risk for the price due from the client. In limited instances where the Company adjudicates prescriptions at pharmacies that are under contract directly with the client and there are no financial risks to the Company, such revenue is recorded at the amount of the administrative fee earned by the Company for processing the claim (“Net Reporting”). 79
  • 92.
    The Company’s productnet revenues also include premiums associated with the Company’s Medicare PDP risk-based product offerings. These products involve prescription dispensing for beneficiaries enrolled in the CMS- sponsored Medicare Part D prescription drug benefit. The Company’s two insurance company subsidiaries have been operating under contracts with CMS since 2006, and currently offer several Medicare PDP options. The products involve underwriting the benefit, charging enrollees applicable premiums, providing covered prescription drugs and administering the benefit as filed with CMS. The Company provides three Medicare drug benefit plan options for beneficiaries, including (i) a “standard Part D” benefit plan as mandated by statute, and (ii) two benefit plans with enhanced coverage, that exceed the standard Part D benefit plan, available for an additional premium. The Company also offers numerous customized benefit plan designs to employer group retiree plans under the Medicare Part D prescription drug benefit. The PDP premiums are determined based on the Company’s annual bid and related contractual arrangements with CMS. The PDP premiums are primarily comprised of amounts received from CMS as part of a direct subsidy and an additional subsidy from CMS for low-income member premiums, as well as premium payments received from members. These premiums are recognized ratably to product net revenues over the period in which members are entitled to receive benefits. Premiums received in advance of the applicable benefit period are deferred and recorded in accrued expenses and other current liabilities on the consolidated balance sheets. There is a possibility that the annual costs of drugs may be higher or lower than premium revenues. As a result, CMS provides a risk corridor adjustment for the standard drug benefit that compares the Company’s actual annual drug costs incurred to the targeted premiums in the Company’s CMS-approved bid. Based on specific collars in the risk corridor, the Company will receive from CMS additional premium amounts or be required to refund to CMS previously received premium amounts. The Company calculates the risk corridor adjustment on a quarterly basis based on drug cost experience to date and records an adjustment to product net revenues with a corresponding account receivable from or payable to CMS reflected on the consolidated balance sheets. In addition to premiums, there are certain co-payments and deductibles (the “cost share”) due by members based on prescription orders by those members, some of which are subsidized by CMS in cases of low-income membership. For subsidies received in advance, the amount is deferred and recorded in accrued expenses and other current liabilities on the consolidated balance sheets. If there is cost share due from members or CMS, the amount is accrued and recorded in client accounts receivable, net, on the consolidated balance sheets. After the end of the contract year and based on actual annual drug costs incurred, cost share amounts are reconciled with CMS and the corresponding receivable or payable is settled. The cost share is treated consistently as other co-payments derived from providing PBM services, as a component of product net revenues on the consolidated statements of income where the requirements of Authoritative Guidance are met. Premium revenues for our PDP products, which exclude member cost share, were $543 million, or less than 1% of total net revenues, in 2009, $317 million, or less than 1% of total net revenues, in 2008, and $255 million, or less than 1% of total net revenues, in 2007. The Company’s agreements with CMS, as well as applicable Medicare Part D regulations and federal and state laws, require the Company to, among other obligations: (i) comply with certain disclosure, filing, record-keeping and marketing rules; (ii) operate quality assurance, drug utilization management and medication therapy manage- ment programs; (iii) support e-prescribing initiatives; (iv) implement grievance, appeals and formulary exception processes; (v) comply with payment protocols, which include the return of overpayments to CMS and, in certain circumstances, coordination with state pharmacy assistance programs; (vi) use approved networks and formularies, and provide access to such networks to any willing pharmacy; (vii) provide emergency out-of-network coverage; and (viii) adopt a comprehensive Medicare and Fraud, Waste and Abuse compliance program. The Company has various contractual and regulatory compliance requirements associated with participating in Medicare Part D. Similar to the Company’s requirements with other clients, the Company’s policies and practices associated with executing its PDP are subject to audit. If material contractual or regulatory non-compliance was to be identified, monetary penalties and/or applicable sanctions, including suspension of enrollment and marketing or debarment from participation in Medicare programs, may be imposed. Additionally, each calendar year, payment will vary based on the annual benchmark that applies as a result of Medicare Part D plan bids for the applicable year, as well as for changes in the CMS methodology for calculating risk adjustment factors. 80
  • 93.
    Rebates and guaranteesregarding the level of service the Company will provide to the client or member or the minimum level of rebates or discounts the client will receive are deducted from product net revenues as they are earned by the client. Rebates are generally credited or paid to clients subsequent to collections from pharmaceutical manufacturers, although there are certain instances where rebates are paid to clients on a more accelerated basis. Other contractual payments made to clients are generally made upon initiation of contracts as implementation allowances, which may, for example, be designated by clients as funding for their costs to transition their plans to the Company. The Company considers these payments to be an integral part of the Company’s pricing of a contract and believes that they represent variability in the timing of cash flows that does not change the underlying economics of the contract. Accordingly, these payments are capitalized and amortized as a reduction of product net revenues, generally on a straight-line basis, over the life of the contract where the payments are refundable upon cancellation of the contract or relate to noncancelable contracts. Amounts capitalized are assessed periodically for recoverability based on the profitability of the contract. Service revenues consist principally of administrative fees and clinical program fees earned from clients, sales of prescription services to pharmaceutical manufacturers, performance-oriented fees paid by Specialty Pharmacy manufacturers, and other non-product-related revenues. Service revenues are recorded by the Company when performance occurs and collectibility is assured. Cost of Revenues. Cost of product net revenues includes the cost of inventory dispensed from the mail-order pharmacies, along with direct dispensing costs and associated depreciation. Cost of product net revenues also includes ingredient costs of drugs dispensed by and professional fees paid to retail network pharmacies. In addition, cost of product net revenues includes the operating costs of the Company’s call center pharmacies, which primarily respond to member and retail pharmacist inquiries regarding member prescriptions, as well as physician calls. Cost of product net revenues also includes an offsetting credit for rebates earned from pharmaceutical manufacturers whose drugs are included on the Company’s preferred drug lists, which are also known as formularies. Rebates receivable from pharmaceutical manufacturers are accrued in the period earned by multiplying estimated rebatable prescription drugs dispensed through the Company’s retail networks and through the Company’s mail-order pharmacies by the contractually agreed manufacturer rebate amount. Rebates receivable estimates are revised to actual, with the difference recorded to cost of revenues, upon billing to the manufacturer, generally 20 to 90 days subsequent to the end of the applicable quarter. These bills are not issued until the necessary specific eligible claims and third-party market share data are received and thoroughly analyzed. Historically, the effect of adjustments resulting from the reconciliation of rebates recognized and recorded to actual amounts billed has not been material to the Company’s results of operations. The Company’s cost of product net revenues also includes the cost of drugs dispensed by the Company’s mail- order pharmacies or retail networks for members covered under the Company’s Medicare PDP product offerings and are recorded at cost as incurred. The Company receives a catastrophic reinsurance subsidy from CMS for approximately 80% of costs incurred by individual members in excess of the individual annual out-of-pocket maximum of $4,350 for coverage year 2009, $4,050 for coverage year 2008 and $3,850 for coverage year 2007. The subsidy is reflected as an offsetting credit in cost of product net revenues to the extent that catastrophic costs are incurred. Catastrophic reinsurance subsidy amounts received in advance are deferred and recorded in accrued expenses and other current liabilities on the consolidated balance sheets. If there are catastrophic reinsurance subsidies due from CMS, the amount is recorded in client accounts receivable, net, on the consolidated balance sheets. After the end of the contract year and based on actual annual drug costs incurred, catastrophic reinsurance amounts are reconciled with CMS and the corresponding receivable or payable is settled. Cost of service revenues consist principally of labor and operating costs for delivery of services provided, as well as costs associated with member communication materials. 81
  • 94.
    Goodwill. Goodwill of$6,333.0 million at December 26, 2009 and $6,331.4 million at December 27, 2008 represents, for the PBM segment, the excess of acquisition costs over the fair value of the Company’s net assets that had been pushed down to the consolidated balance sheets of the Company and existed when the Company became an independent, publicly traded enterprise in 2003, and, to a significantly lesser extent, the Company’s acquisition of a majority interest in Europa Apotheek in 2008, and the acquisitions of PolyMedica in 2007 and ProVantage Health Services, Inc. in 2000. Goodwill also includes, for the Specialty Pharmacy segment, a portion of the excess of the purchase price the Company paid to acquire Accredo Health, Incorporated (“Accredo”) over the fair value of tangible net assets acquired, as well as, to a significantly lesser extent, the Company’s acquisition of Critical Care Systems, Inc. (“Critical Care”) in 2007, and the acquisition of selected assets of Pediatric Services of America, Inc. in 2005. See Note 3, “Acquisitions of Businesses,” for more information on the acquisition of a majority interest in Europa Apotheek, and the PolyMedica and Critical Care acquisitions. The Company’s goodwill balance is assessed for impairment annually using a two-step fair-value based test or whenever events or other changes in circumstances indicate the carrying amount may not be recoverable, by comparing the fair value of each segment’s reporting units to the carrying value of the assets and liabilities assigned to each reporting unit. If the carrying value of the reporting unit were to exceed the Company’s estimate of the fair value of the reporting unit, the Company would then be required to estimate the fair value of the individual assets and liabilities within the reporting unit for purposes of calculating the fair value of goodwill. The Company would be required to record an impairment charge to the extent recorded goodwill exceeds the fair value amount of goodwill resulting from this allocation. The most recent assessment for impairment of goodwill for each of the designated reporting units was performed as of September 26, 2009, and the goodwill was determined not to be impaired, and there have been no significant subsequent changes in events or circumstances. The Company utilized the income approach methodology, which projects future cash flows discounted to present value. Discount rates were based on the estimated weighted average cost of capital at the reporting unit level and ranged from 9% to 13%. In order to validate the reasonableness of the estimated fair values, the Company performed a reconciliation of the aggregate fair values of all reporting units to market capitalization as of the valuation date using a reasonable control premium. Intangible Assets, Net. Intangible assets, net, of $2,428.8 million at December 26, 2009 and $2,666.4 million at December 27, 2008 for the PBM segment primarily represent the value of Medco’s client relationships that had been pushed down to the consolidated balance sheets of the Company and existed when the Company became an independent, publicly traded enterprise in 2003, and to a lesser extent, intangible assets recorded upon the Company’s acquisition of PolyMedica in 2007 and a majority stake in Europa Apotheek in 2008. Additionally, for the Specialty Pharmacy segment, intangible assets primarily include the portion of the excess of the purchase price paid by the Company to acquire Accredo in 2005 over tangible net assets acquired. The Company’s intangible assets are initially recorded at fair value at the acquisition date and subsequently carried at amortized cost. The Company reviews intangible assets for impairment whenever events, such as losses of significant clients or specialty product manufacturer contracts, or when other changes in circumstances indicate the carrying amount may not be recoverable. When these events occur, the carrying amount of the assets is compared to the pre-tax undiscounted expected future cash flows derived from the lowest appropriate asset grouping. If this comparison indicates impairment exists, the amount of the impairment would be calculated using discounted expected future cash flows. The Liberty trade name intangible asset was assigned an indefinite life at the time of our acquisition of PolyMedica in 2007. Subsequently in 2008, management determined that the Liberty trade name intangible asset was no longer indefinite-lived and assigned a 35-year useful life. Income Taxes. Deferred tax assets and liabilities are recorded based on temporary differences between the financial statement basis and the tax basis of assets and liabilities using presently enacted tax rates. On December 31, 2006, the first day of the Company’s 2007 fiscal year, the Company adopted the provisions of a new FASB standard, which clarifies the accounting for uncertainty in income taxes recognized in companies’ financial statements. The standard prescribes a recognition threshold and measurement attribute for the financial statement recognition and measurement of a tax position taken or expected to be taken in a tax return. The evaluation of a tax position in accordance with the standard is a two-step process. The first step is recognition to determine whether it is more likely than not that a tax position will be sustained upon examination. The second step is measurement whereby a tax position that meets the more-likely-than-not recognition threshold is measured to determine the amount of benefit to recognize in the financial statements. The standard also provides guidance on derecognition of recognized tax benefits, classification, interest and penalties, accounting in interim periods, disclosure and transition. As a result of the implementation of the FASB’s uncertainty in income taxes standard, the Company recognized a decrease of $43.4 million in the liability for income tax contingencies, including interest, no longer required under the more-likely- than-not accounting model, and a $29.3 million corresponding increase, net of federal income tax benefit, to the December 31, 2006 (the first day of fiscal year 2007) balance of retained earnings. In May 2007, the FASB issued additional guidance on how a company should determine whether a tax position is effectively settled for the purpose of recognizing previously unrecognized tax benefits. See Note 10, “Taxes on Income,” for more information. 82
  • 95.
    Use of Estimates.The consolidated financial statements include certain amounts that are based on management’s best estimates and judgments. Estimates are used in determining such items as accruals for rebates receivable and payable, client guarantees, depreciable/useful lives, allowance for doubtful accounts, testing for impairment of goodwill and intangible assets, stock-based compensation, income taxes, pension and other postretire- ment benefit plan assumptions, amounts recorded for contingencies, and other reserves, as well as CMS-related activity, including the risk corridor adjustment and cost share and catastrophic reinsurance subsidies. Because of the uncertainty inherent in such estimates, actual results may differ from these estimates. Operating Segments. The Company has two reportable segments, PBM and Specialty Pharmacy. See Note 13, “Segment and Geographic Data,” for more information. The PBM and Specialty Pharmacy segments primarily operate in the United States and have limited activity in Puerto Rico, Germany and the United Kingdom. Earnings per Share (“EPS”). Basic EPS is computed by dividing net income by the weighted average number of shares of common stock issued and outstanding during the reporting period. The Company treats stock options and restricted stock units granted by the Company as potential common shares outstanding in computing diluted earnings per share. Under the treasury stock method on a grant by grant basis, the amount the employee or director must pay for exercising the award, the amount of compensation cost for future service that the Company has not yet recognized, and the amount of tax benefit that would be recorded in additional paid-in capital when the award becomes deductible, are assumed to be used to repurchase shares at the average market price during the period. The Company granted options of 6.6 million shares in fiscal 2009, 5.1 million shares in fiscal 2008, and 7.1 million shares in fiscal 2007. For the years ended December 26, 2009, December 27, 2008 and December 29, 2007, there were outstanding options to purchase 5.1 million, 5.6 million and 6.7 million shares of Medco stock, respectively, which were not dilutive to the EPS calculations when applying the treasury stock method. These outstanding options may be dilutive to future EPS calculations. The following is a reconciliation of the number of weighted average shares used in the basic and diluted EPS calculations (amounts in millions): Fiscal Years 2009 2008 2007 Basic weighted average shares outstanding . . . . . . . . . . . . . . . . . . . . . . . . . . . . . 481.1 508.6 550.2 Dilutive common stock equivalents: Outstanding stock options, restricted stock units and restricted stock . . . . . . . . 8.9 10.0 10.7 Diluted weighted average shares outstanding . . . . . . . . . . . . . . . . . . . . . . . . . . . 490.0 518.6 560.9 The decreases in the weighted average share outstanding and diluted weighted average shares outstanding for each year result from the repurchase of approximately 186.3 million shares of stock in connection with the Company’s share repurchase programs since inception in 2005 through the end of 2009, compared to equivalent amounts of 159.0 million and 111.4 million shares repurchased inception-to-date through the ends of 2008 and 2007, respectively. The Company repurchased approximately 27.3 million, 47.6 million shares and 53.3 million shares in fiscal years 2009, 2008 and 2007, respectively. The above share data has been retrospectively adjusted to reflect the January 24, 2008 two-for-one stock split. See Note 1, “Background and Basis of Presentation,” for more information. 83
  • 96.
    Other Comprehensive Incomeand Accumulated Other Comprehensive Income. Other comprehensive income includes unrealized investment gains and losses, foreign currency translation adjustments resulting primarily from the translation of Europa Apotheek’s assets and liabilities and results of operations, unrealized gains and losses on effective cash flow hedges, prior service costs or credits and actuarial gains or losses associated with pension or other postretirement benefits that arise during the period, as well as the amortization of prior service costs or credits and actuarial gains or losses, which are reclassified as a component of net benefit expense, and the tax effect allocated to each component of other comprehensive income. The accumulated other comprehensive income (“AOCI”) component of stockholders’ equity includes: unreal- ized investment gains and losses, net of tax; foreign currency translation adjustments resulting primarily from the translation of Europa Apotheek’s assets and liabilities and results of operations; unrealized gains and losses on effective cash flow hedges, net of tax; and the net gains and losses and prior service costs and credits related to the Company’s pension and other postretirement benefit plans, net of tax. The year-end balances in AOCI related to the Company’s pension and other postretirement benefit plans consist of amounts that have not yet been recognized as components of net periodic benefit cost in the consolidated statement of income. The amounts recognized in AOCI at December 29, 2007, December 27, 2008 and December 26, 2009 and the components and allocated tax effects included in other comprehensive income in fiscal 2008 and 2009 are as follows ($ in millions): Net Unrealized Foreign Gains (Losses) Net Prior Unrealized Currency on Effective Service Net Actuarial Gains (Losses) Translation Cash Flow Benefit Gains Total on Investments Gains (Losses) Hedges (Cost) (Losses) AOCI Balances at December 29, 2007, net of tax . . . . . . . . . . $ — $ — $ (4.8) $25.5 $(14.3) $ 6.4 Fiscal 2008 activity: Before tax amount . . . . . . . . (0.3) (15.5) (25.0) (5.0) (59.8) (105.6) Tax benefit . . . . . . . . . . . . . 0.1 — 9.8 2.0 23.5 35.4 Net-of-tax change . . . . . . . . . . (0.2) (15.5)(1) (15.2)(2) (3.0) (36.3)(3) (70.2) Balances at December 27, 2008, net of tax . . . . . . . . . . $(0.2) $(15.5) $(20.0) $22.5 $(50.6) $ (63.8) Fiscal 2009 activity: Before tax amount . . . . . . . . (0.2) 2.9 3.6 (4.0) 28.6 30.9 Tax benefit . . . . . . . . . . . . . 0.1 — (1.7) 1.6 (11.3) (11.3) Net-of-tax change . . . . . . . . . . (0.1) 2.9 (1) 1.9 (4) (2.4) 17.3 (5) 19.6 Balances at December 26, 2009, net of tax . . . . . . . . . . $(0.3) $(12.6) $(18.1) $20.1 $(33.3) $ (44.2) (1) This primarily represents the unrealized net foreign currency translation gains (losses) resulting from the trans- lation of majority-owned Europa Apotheek’s net assets acquired from the April 28, 2008 acquisition date. (2) The net unrealized losses on cash flow hedges consist of the unrealized loss on effective cash flow hedges of $(16.9) million, net of taxes, which settled in 2008, offset by the associated amortization of $1.7 million, net of taxes. (3) Net actuarial losses reflect an increase in the unfunded status of the Company’s pension plans due to reductions in pension plan assets from investment losses in 2008, and increased benefit obligations related to increased plan participants. (4) Consists of the amortization of the unrealized loss on the effective portion of the cash flow hedges. (5) Net actuarial gains primarily reflect increases in pension plan assets from investing gains in 2009. See Note 9, “Pension and Other Postretirement Benefits,” for additional information on the reclassification adjustments included within the components of other comprehensive income related to the Company’s defined benefit plans. Contingencies. In the ordinary course of business, the Company is involved in litigation, claims, government inquiries, investigations, charges and proceedings, including, but not limited to, those relating to regulatory, commercial, employment, employee benefits and securities matters. In accordance with the FASB’s standard on accounting for contingencies, the Company records accruals for contingencies when it is probable that a liability will be incurred and the amount of loss can be reasonably estimated. The Company’s recorded reserves are based on estimates developed with consideration given to the potential merits of claims, the range of possible settlements, advice from outside counsel, and management’s strategy with regard to the settlement of or defense against such claims. See Note 14, “Commitments and Contingencies,” for additional information. 84
  • 97.
    Stock-Based Compensation. TheCompany accounts for stock-based compensation in accordance with a standard issued by the FASB and guidance issued by the Securities and Exchange Commission (“SEC”), which require the measurement and recognition of compensation expense for all stock-based compensation awards made to employees and directors, including employee stock options and employee stock purchase plans. The standard requires companies to estimate the fair value of stock-based awards on the date of grant using an option-pricing model. The portion of the value that is ultimately expected to vest is recognized as expense over the requisite service period. As stock-based compensation expense recognized in our audited consolidated statements of income for fiscal years 2009, 2008 and 2007 is based on awards ultimately expected to vest, it has been reduced for estimated forfeitures. The standard requires forfeitures to be estimated at the time of grant and revised, if necessary, in subsequent periods if actual forfeitures differ from those estimates. In addition, the standard requires that the benefits of realized tax deductions in excess of tax benefits on compensation expense, which amounted to $64.3 million, $41.8 million and $69.9 million for fiscal years 2009, 2008 and 2007, respectively, be reported as a component of cash flows from financing activities rather than as an operating cash flow, as previously required. In accordance with Authoritative Guidance issued by the SEC, the Company classifies stock-based compensation within cost of product net revenues and SG&A expenses to correspond with the financial statement components in which cash compensation paid to employees and directors is recorded. Foreign Currency Translation. The Company’s consolidated financial statements are presented in U.S. dollars. In 2008, the Company acquired a majority interest in Europa Apotheek, a company based in the Netherlands, with the Euro as its local currency, and in 2009, the Company entered into a joint venture with United Drug plc, a company based in the United Kingdom, with the British pound as its local currency. Europa Apotheek’s assets and liabilities, and the Company’s investment in the United Drug plc joint venture are translated into U.S. dollars at the exchange rates in effect at balance sheet dates, and revenues and expenses are translated at the weighted average exchange rates prevailing during the month of the transaction. Adjustments resulting from translating net assets are reported as a separate component of AOCI within stockholders’ equity. Recently Issued Accounting Pronouncement. Fair Value Measurements and Disclosures. In January 2010, the FASB issued a standard, which amends the existing fair value measurements and disclosure standard and provides guidance on increased disclosures on transfers in and out of Levels 1 and 2 and activity in Level 3 fair value measurements. The standard also clarifies existing fair value measurement disclosure guidance about the level of disaggregation, inputs, and valuation techniques. The new disclosures and clarifications of existing disclosures are effective for interim and annual reporting periods beginning after December 15, 2009, except for the disclosures about purchases, sales, issuances, and settlements in the roll forward of activity in Level 3 fair value measurements, which are effective for fiscal years beginning after December 15, 2010, and for interim periods within those fiscal years. The Company does not expect the adoption of the standard to have a material impact on its consolidated financial statements. 3. ACQUISITIONS OF BUSINESSES Europa Apotheek Venlo B.V. On April 28, 2008, the Company acquired a majority interest in Europa Apotheek, a privately held company based in the Netherlands that primarily provides mail-order pharmacy services in Germany. The cost of the acquisition was approximately $126.8 million in cash and a $24.1 million purchase obligation, with additional potential future consideration for achieving performance targets. The Company believes this acquisition leverages its proven proprietary technologies and ability to deliver customized solutions to meet the challenges of managing healthcare costs and improving clinical care abroad. The transaction was accounted for under the provisions of FASB’s business combinations standard. The purchase price was allocated based upon the fair value of net assets acquired at the date of the acquisition. A portion of the excess of the purchase price over tangible net assets acquired, amounting to $112.8 million, has been allocated to goodwill, and $43.9 million has been allocated to intangible assets, which are being amortized using the straight-line method over an estimated weighted average useful life of 9.1 years. Additionally, there is a deferred tax liability of $11.1 million associated with the fair value amounts allocated to intangible assets. Europa Apotheek’s operating results from the date of acquisition of April 28, 2008 through December 26, 2009 are included in the accompanying audited consolidated financial statements. Pro forma financial statement results including the results of Europa Apotheek would not differ materially from the Company’s historically reported financial statement results. 85
  • 98.
    PolyMedica Corporation. OnOctober 31, 2007, the Company acquired all of the outstanding common stock of PolyMedica for $1.3 billion in cash. PolyMedica is a leading provider of diabetes care through its Liberty brand, including blood glucose testing supplies, prescriptions and related services. Previously in 2006, Medco formed a multi-pronged alliance with PolyMedica, enabling Medco to become the direct mail dispensing pharmacy for their members, and provide PolyMedica’s Medicare Part B solution to Medco clients. This acquisition supports the Company’s ability to deliver advanced, specialized pharmacy services by treating patients at the disease level. Under the terms of the Agreement and Plan of Merger dated August 27, 2007, PolyMedica shareholders received $53 in cash for each outstanding share of PolyMedica common stock. The Company funded the transaction on October 31, 2007 through a combination of bank borrowings from its existing $2 billion revolving credit facility and cash on hand. The transaction was accounted for under the provisions of FASB’s business combinations standard. The purchase price was allocated based upon the fair value of net assets acquired at the date of the acquisition. A portion of the excess of the purchase price over tangible net assets acquired was allocated to intangible assets, consisting of the Liberty trade name of $392.0 million with an estimated 35-year life, customer relationships of $119.9 million with an estimated 8-year life, non-compete agreements of $26.8 million with an estimated 3-year life, and customer lists of $2.8 million with an estimated 4-year life. These assets are included in intangible assets, net, in the consolidated balance sheets. The purchase price for PolyMedica was primarily determined on the basis of management’s expectations of future earnings and cash flows, and resulted in the recording of goodwill of $1.0 billion, which is not tax deductible. In accordance with the FASB standard, the goodwill is not being amortized. PolyMedica’s operating results from the date of acquisition of October 31, 2007 through December 26, 2009, are included in the accompanying consolidated financial statements. The unaudited pro forma results of operations of the Company and PolyMedica, prepared based on the purchase price allocation for PolyMedica described above and as if the PolyMedica acquisition had occurred at the beginning of fiscal year 2007, would have been as follows ($ in millions, except for per share amounts): 2007 Fiscal Year (Unaudited) Pro forma total net revenues . . . . . . . . . . . . . . . . . . . . . . . . . . $ 44,982.5 Pro forma net income . . . . . . . . . . . . . . . . . . . . . . . . . . . . . . . $ 887.4 Pro forma basic earnings per common share . . . . . . . . . . . . . . $ 1.61 Pro forma diluted earnings per common share . . . . . . . . . . . . . $ 1.58 The above per share data has been retrospectively adjusted to reflect the January 24, 2008 two-for-one stock split. See Note 1, “Background and Basis of Presentation,” for more information. The pro forma financial information above is not necessarily indicative of what the Company’s consolidated results of operations actually would have been if the PolyMedica acquisition had been completed at the beginning of fiscal year 2007. In addition, the pro forma information above does not attempt to project the Company’s future results of operations. Critical Care. On November 14, 2007, Accredo acquired Critical Care, one of the nation’s largest providers of home-based and ambulatory specialty infusion services, for approximately $220 million in cash. This acquisition expands Accredo’s capabilities and market presence related to infused agents. The transaction was accounted for under the provisions of FASB’s business combinations standard. The purchase price has been allocated based upon the fair value of net assets acquired at the date of the acquisition. A portion of the excess of the purchase price over tangible net assets acquired, amounting to $121.4 million, was allocated to goodwill, and $68.0 million was allocated to intangible assets, which are being amortized using the straight-line method over an estimated weighted average useful life of approximately 13.8 years. These assets are included in intangible assets, net, and goodwill, respectively, in the consolidated balance sheets. The Company retained third-party valuation advisors to conduct analyses of the assets acquired and liabilities assumed in order to assist the Company with the purchase price allocation. These analyses were used by management in the determination of the final allocation. Pro forma financial statement results including the results of Critical Care would not differ materially from our historically reported financial statement results. 86
  • 99.
    4. FAIR VALUEDISCLOSURES Fair Value Measurements On December 30, 2007, the Company adopted a FASB fair value measurements accounting standard except with respect to those nonrecurring measurements for nonfinancial assets and nonfinancial liabilities subject to the partial deferral in related guidance issued by the FASB. Additionally in fiscal 2009, there are disclosure requirements associated with nonfinancial assets and liabilities that did not have an impact on the Company’s financial position or results of operations. Fair Value Hierarchy. The standard defines the inputs used to measure fair value into the following hierarchy: Level 1: Quoted market prices in active markets for identical assets or liabilities. Level 2: Observable market-based inputs or unobservable inputs that are corroborated by market data. Level 3: Unobservable inputs reflecting the reporting entity’s own assumptions. The Company utilizes the best available information in measuring fair value. The following tables set forth, by level within the fair value hierarchy, the financial assets recorded at fair value on a recurring basis ($ in millions): Medco Fair Value Measurements at Reporting Date December 26, Description 2009 Level 1 Level 2 Level 3 (1) Money market mutual funds . . . . . . . . . . . . . . . . . . . . . . . . . . $ 1,959.0 $ 1,959.0 $ — $ — Fair value of interest rate swap agreements . . . . . . . . . . . . . . . 14.0(2) — 14.0 — (1) Reported in cash and cash equivalents on the consolidated balance sheet. (2) Reported in other noncurrent assets on the consolidated balance sheet. Medco Fair Value Measurements at Reporting Date December 27, Description 2008 Level 1 Level 2 Level 3 (1) Money market mutual funds . . . . . . . . . . . . . . . . . . . . . . . . . . $ 906.0 $ 906.0 $ — $ — Fair value of interest rate swap agreements . . . . . . . . . . . . . . . 18.4(2) — 18.4 — (1) Reported in cash and cash equivalents on the consolidated balance sheet. (2) Reported in other noncurrent assets on the consolidated balance sheet. The Company’s money market mutual funds are invested in funds that seek to preserve principal, are highly liquid, and therefore are recorded on the consolidated balance sheets at the principal amounts deposited, which equals the asset values quoted by the money market fund custodians. The fair value of the Company’s obligation under its interest rate swap agreements, which hedge interest costs on the senior notes, is based upon observable market-based inputs that reflect the present values of the difference between estimated future fixed rate payments and future variable rate receipts, and therefore are classified within Level 2. Historically, there have not been significant fluctuations in the fair value of the Company’s financial assets. 87
  • 100.
    Fair Value ofFinancial Instruments The carrying amount of the accounts receivable financing facility, the term loan and revolving credit obligations under the Company’s senior unsecured bank credit facilities, short-term and long-term investments approximated fair values as of December 26, 2009 and December 27, 2008. The Company estimates fair market value for these assets and liabilities based on their market values or estimates of the present value of their cash flows. The carrying values and the fair values of the Company’s senior notes are shown in the following table ($ in millions): December 26, 2009 December 27, 2008 Carrying Fair Carrying Fair Amount Value Amount Value 7.25% senior notes due 2013 . . . . . . . . . . . . . . . . . . . . . $ 498.2(1) $ 560.8 $ 497.8(1) $ 487.3 6.125% senior notes due 2013 . . . . . . . . . . . . . . . . . . . . 298.8(1) 322.4 298.5(1) 284.1 7.125% senior notes due 2018 . . . . . . . . . . . . . . . . . . . . 1,189.1(1) 1,341.2 1,188.2(1) 1,107.9 (1) Reported in long-term debt, net, on the consolidated balance sheets, net of unamortized discount. The fair values of the senior notes are based on observable relevant market information. Fluctuations between the carrying values and the fair values of the senior notes for the periods presented are associated with changes in market interest rates. 5. PROPERTY AND EQUIPMENT Property and equipment, at cost, consist of the following ($ in millions): December 26, December 27, 2009 2008 Land and buildings . . . . . . . . . . . . . . . . . . . . . . . . . . . . . . . . . . $ 242.8 $ 240.8 Machinery, equipment and office furnishings . . . . . . . . . . . . . . . 704.7 686.8 Computer software . . . . . . . . . . . . . . . . . . . . . . . . . . . . . . . . . . . 1,116.9 1,042.5 Leasehold improvements . . . . . . . . . . . . . . . . . . . . . . . . . . . . . . 137.4 126.4 Construction in progress . . . . . . . . . . . . . . . . . . . . . . . . . . . . . . . 200.5(1) 120.6(1) 2,402.3 2,217.1 Less accumulated depreciation . . . . . . . . . . . . . . . . . . . . . . . . . . (1,489.8) (1,363.0) Property and equipment, net . . . . . . . . . . . . . . . . . . . . . . . . . . . . $ 912.5 $ 854.1 (1) Primarily represents construction in progress on the Company’s third automated dispensing pharmacy, which is located in Whitestown, Indiana. Depreciation expense for property and equipment totaled $179.0 million, $157.7 million and $168.9 million in fiscal years 2009, 2008 and 2007, respectively. 88
  • 101.
    6. LEASES The Company leases mail-order pharmacy and call center pharmacy facilities, offices and warehouse space under various operating leases. In addition, the Company leases pill dispensing and counting devices and other operating equipment for use in its mail-order pharmacies, as well as computer equipment for use in its data centers and corporate headquarters. Rental expense was $75.3 million, $74.3 million and $61.8 million for fiscal years 2009, 2008 and 2007, respectively. The minimum aggregate rental commitments under noncancelable leases, excluding renewal options, are as follows ($ in millions): Fiscal Years Ending December 2010 . . . . . . . . . . . . . . . . . . . . . . . . . . . . . . . . . . . . . . . . . . . . . . .............. $ 50.9 2011 . . . . . . . . . . . . . . . . . . . . . . . . . . . . . . . . . . . . . . . . . . . . . . .............. 49.9 2012 . . . . . . . . . . . . . . . . . . . . . . . . . . . . . . . . . . . . . . . . . . . . . . .............. 23.6 2013 . . . . . . . . . . . . . . . . . . . . . . . . . . . . . . . . . . . . . . . . . . . . . . .............. 12.8 2014 . . . . . . . . . . . . . . . . . . . . . . . . . . . . . . . . . . . . . . . . . . . . . . .............. 7.4 Thereafter . . . . . . . . . . . . . . . . . . . . . . . . . . . . . . . . . . . . . . . . . . .............. 14.7 Total . . . . . . . . . . . . . . . . . . . . . . . . . . . . . . . . . . . . . . . . . . . . . . .............. $ 159.3 In the normal course of business, operating leases are generally renewed or replaced by new leases. 7. GOODWILL AND INTANGIBLE ASSETS The changes in the Company’s carrying amount of goodwill for the years ended December 27, 2008 and December 26, 2009 are as follows ($ in millions): Specialty PBM Pharmacy Total Balances as of December 29, 2007 . . . . . . . . . . . . . . . . . . . . . . $ 4,318.2 $ 1,912.0 $ 6,230.2 Goodwill acquired . . . . . . . . . . . . . . . . . . . . . . . . . . . . . . . . . . 108.0(1) 5.2(2) 113.2 Translation adjustment and other . . . . . . . . . . . . . . . . . . . . . . . . (11.5) (0.5) (12.0) Balances as of December 27, 2008 . . . . . . . . . . . . . . . . . . . . . . $ 4,414.7 $ 1,916.7 $ 6,331.4 Translation adjustment and other . . . . . . . . . . . . . . . . . . . . . . . . 2.4 (0.8) 1.6 Balances as of December 26, 2009 . . . . . . . . . . . . . . . . . . . . . . $ 4,417.1 $ 1,915.9 $ 6,333.0 (1) Primarily represents the portion of the excess of the purchase price paid by the Company to acquire a majority interest in Europa Apotheek. See Note 3, “Acquisitions of Businesses.” (2) Represents $5.2 million of the $121.4 million allocated to Goodwill in November 2007, which is a portion of the excess of the purchase price paid by the Company to acquire Critical Care. See Note 3, “Acquisitions of Businesses.” The following is a summary of the Company’s intangible assets ($ in millions): December 26, 2009 December 27, 2008 Gross Gross Carrying Accumulated Carrying Accumulated Value Amortization Net Value Amortization Net Client relationships . . . . . . . . . . . . . . . . . $ 3,446.1 $ 1,977.2 $ 1,468.9 $ 3,446.1 $ 1,784.9 $ 1,661.2 Trade name . . . . . . . . . . . . . . . . . . . . . . 569.3 47.6 521.7 568.8 27.5 541.3 Manufacturer relationships . . . . . . . . . . . . 357.5 77.5 280.0 357.5 59.6 297.9 Patient relationships . . . . . . . . . . . . . . . . 280.1 127.8 152.3 212.5 67.0 145.5 Other intangible assets . . . . . . . . . . . . . . . 33.7 27.8 5.9 37.3 16.8 20.5 Total . . . . . . . . . . . . . . . . . . . . . . . . . $ 4,686.7 $ 2,257.9 $ 2,428.8 $ 4,622.2 $ 1,955.8 $ 2,666.4 For intangible assets existing as of December 26, 2009, aggregate intangible asset amortization expense in each of the five succeeding fiscal years is estimated as follows ($ in millions): Fiscal Years Ending December 2010 .......... ................................................. $ 278.5 2011 .......... ................................................. 259.8 2012 .......... ................................................. 251.2 2013 .......... ................................................. 246.7 2014 .......... ................................................. 244.1 Total . . . . . . . . . . . . . . . . . . . . . . . . . . . . . . . . . . . . . . . . . . . . . . . . . . . . . . . . . . . $ 1,280.3 89
  • 102.
    The annual intangibleasset amortization expense for intangible assets existing as of December 26, 2009 is estimated to be $278.5 million in 2010, a $27.1 million decrease from $305.6 million in 2009. The decrease is primarily due to the application of accelerated amortization to PolyMedica customer relationships. The weighted average useful life of intangible assets subject to amortization is 23 years in total. The weighted average useful life is approximately 23 years for the PBM client relationships and approximately 21 years for the Specialty Pharmacy segment-acquired intangible assets. The Company expenses the costs to renew or extend contracts associated with intangible assets in the period the costs are incurred. For PBM client relationships, the weighted average contract period prior to the next renewal date as of December 26, 2009 is approximately 2.1 years. The Company has experienced client retention rates of over 98% for the past two years. 8. DEBT The Company’s debt consists of the following ($ in millions): December 26, December 27, 2009 2008 Short-term debt: Accounts receivable financing facility . . . . . . . . . . . . . . . . . . . $ — $ 600.0 Other . . . . . . . . . . . . . . . . . . . . . . . . . . . . . . . . . . . . . . . . . . . 15.8 — Total short-term debt. . . . . . . . . . . . . . . . . . . . . . . . . . . . . . 15.8 600.0 Long-term debt: Senior unsecured revolving credit facility . . . . . . . . . . . . . . . . 1,000.0 1,000.0 Senior unsecured term loan. . . . . . . . . . . . . . . . . . . . . . . . . . . 1,000.0 1,000.0 7.25% senior notes due 2013, net of unamortized discount. . . . 498.2 497.8 6.125% senior notes due 2013, net of unamortized discount . . . 298.8 298.5 7.125% senior notes due 2018, net of unamortized discount . . . 1,189.1 1,188.2 Fair value of interest rate swap agreements . . . . . . . . . . . . . . . 14.0 18.4 Total long-term debt . . . . . . . . . . . . . . . . . . . . . . . . . . . . . . 4,000.1 4,002.9 Total debt . . . . . . . . . . . . . . . . . . . . . . . . . . . . . . . . . . . . . . . . . $ 4,015.9 $ 4,602.9 6.125% and 7.125% Senior Notes. On March 18, 2008, the Company completed an underwritten public offering of $300 million aggregate principal amount of 5-year senior notes at a price to the public of 99.425 percent of par value, and $1.2 billion aggregate principal amount of 10-year senior notes at a price to the public of 98.956 percent. The 5-year senior notes bear interest at a rate of 6.125% per annum, with an effective interest rate of 6.261%, and mature on March 15, 2013. The 10-year senior notes bear interest at a rate of 7.125% per annum, with an effective interest rate of 7.274%, and mature on March 15, 2018. Medco may redeem all or part of these notes at any time or from time to time at its option at a redemption price equal to the greater of (i) 100% of the principal amount of the notes being redeemed plus accrued and unpaid interest to the redemption date or (ii) a “make-whole” amount based on the yield of a comparable U.S. Treasury security plus 50 basis points. The Company pays interest on both series of senior notes semi-annually on March 15 and September 15 of each year. The Company used the net proceeds from the sale of these senior notes to repay borrowings under its revolving credit facility used to fund the acquisitions in 2007, which are described in Note 3, “Acquisitions of Businesses.” On December 12, 2007, the Company entered into forward-starting interest rate swap agreements in contempla- tion of the issuance of long-term fixed-rate financing described above. The Company entered into these cash flow hedges to manage the Company’s exposure to changes in benchmark interest rates and to mitigate the impact of fluctuations in the interest rates prior to the issuance of the long-term financing. The cash flow hedges entered into were for a notional amount of $500 million on the then-current 10-year treasury interest rate, and for a notional amount of $250 million on the then-current 30-year treasury interest rate, both with a settlement date of March 31, 2008. At the time of purchase, the cash flow hedges were anticipated to be effective in offsetting the changes in the expected future interest rate payments on the proposed debt offering attributable to fluctuations in the treasury benchmark interest rate. 90
  • 103.
    In connection withthe issuance of the 5-year and 10-year senior notes described above, a portion of the $250 million notional amount 30-year treasury interest rate cash flow hedge was deemed an ineffective hedge. The cash flow hedges were settled on March 17, 2008 for approximately $45.4 million and included the ineffective portion that was recorded as an increase of $9.8 million to interest (income) and other (income) expense, net, for the year ended December 27, 2008. The effective portion was recorded in accumulated other comprehensive income and is reclassified to interest expense over the ten-year period in which the Company hedged its exposure to variability in future cash flows. The effective portion reclassified to interest expense in 2009 and 2008 amounted to $3.6 million and $2.8 million, respectively. The effective portion expected to be reclassified to interest expense in 2010 amounts to $3.6 million. The unamortized effective portion reflected in accumulated other comprehensive loss as of December 26, 2009 and December 27, 2008 was $18.1 million and $20.0 million, net of tax, respectively. 7.25% Senior Notes. In August 2003, in connection with Medco’s spin-off, the Company completed an underwritten public offering of $500 million aggregate principal amount of 10-year senior notes at a price to the public of 99.195 percent of par value. The senior notes bear interest at a rate of 7.25% per annum, with an effective interest rate of 7.365%, and mature on August 15, 2013. Medco may redeem all or part of these notes at any time or from time to time at its option at a redemption price equal to the greater of (i) 100% of the principal amount of the notes being redeemed, or (ii) the sum of the present values of 107.25% of the principal amount of the notes being redeemed, plus all scheduled payments of interest on the notes discounted to the redemption date at a semi-annual equivalent yield to a comparable treasury issue for such redemption date plus 50 basis points. The Company entered into five interest rate swap agreements in 2004. These swap agreements, in effect, converted $200 million of the $500 million of 7.25% senior notes to variable interest rates. The swaps have been designated as fair value hedges and have an expiration date of August 15, 2013, consistent with the maturity date of the senior notes. The fair value of the derivatives outstanding, which is based upon observable market-based inputs that reflect the present values of the difference between estimated future fixed rate payments and future variable rate receipts, represented net receivables of $14.0 million and $18.4 million as of December 26, 2009 and December 27, 2008, respectively, which are reported in other noncurrent assets, with offsetting amounts recorded in long-term debt, net, on the Company’s consolidated balance sheets. These are the amounts that the Company would have received from third parties if the derivative contracts had been settled. Under the terms of these swap agreements, the Company receives a fixed rate of interest of 7.25% on $200 million and pays variable interest rates based on the six-month London Interbank Offered Rate (“LIBOR”) plus a weighted average spread of 3.05%. The payment dates under the agreements coincide with the interest payment dates on the hedged debt instruments and the difference between the amounts paid and received is included in interest expense. Interest expense was reduced by $5.1 million and $1.5 million in fiscal years 2009 and 2008, respectively, and was increased by $2.6 million for fiscal year 2007 as a result of the swap agreements. The weighted average LIBOR associated with the swap agreements was 1.6%, 3.3% and 5.4% for fiscal years 2009, 2008, and 2007, respectively. Five-Year Credit Facilities. On April 30, 2007, the Company entered into a senior unsecured credit agreement, which is available for general working capital requirements. The facility consists of a $1 billion, 5-year senior unsecured term loan and a $2 billion, 5-year senior unsecured revolving credit facility. The term loan matures on April 30, 2012, at which time the entire facility is required to be repaid. If there are pre-payments on the term loan prior to the maturity date, that portion of the loan would be extinguished. At the Company’s current debt ratings, the credit facilities bear interest at LIBOR plus a 0.45 percent margin, with a 10 basis point commitment fee due on the unused portion of the revolving credit facility. The outstanding balance under the revolving credit facility was $1.0 billion as of December 26, 2009 and December 27, 2008. There was no activity under the revolving credit facility during 2009. As of December 26, 2009, the Company had $993 million available for borrowing under its revolving credit facility, after giving effect to prior net draw-downs of $1 billion and $7 million in issued letters of credit. During 2008, the Company’s net borrowings under the revolving credit facility decreased by approximately $400 million, consisting of repayments of $2.2 billion and draw-downs of $1.8 billion. As a result of this activity, the revolving credit facility’s outstanding balance decreased from $1.4 billion at fiscal year-end 2007 to $1.0 billion as of December 27, 2008. As of December 27, 2008, the Company had $987 million available for borrowing under its revolving credit facility, after giving effect to prior net draw-downs of $1 billion and $13 million in issued letters of credit. The revolving credit facility is available through April 30, 2012. 91
  • 104.
    Accounts Receivable FinancingFacility and Other Short-Term Debt. Through a wholly-owned subsidiary, the Company has a $600 million, 364-day renewable accounts receivable financing facility that is collateralized by the Company’s pharmaceutical manufacturer rebates accounts receivable. During 2009, the Company repaid the entire $600 million outstanding balance, which resulted in no amounts outstanding and $600 million available for borrowing under the facility at December 26, 2009. At December 27, 2008, there was $600 million outstanding with no additional amounts available for borrowing under the facility. The Company pays interest on amounts borrowed under the agreement based on the funding rates of the bank-related commercial paper programs that provide the financing, plus an applicable margin and liquidity fee determined by the Company’s credit rating. The weighted average annual interest rate on amounts outstanding under the facility at December 27, 2008 was 3.10%. This facility is renewable annually at the option of both Medco and the banks and was renewed on July 27, 2009. Amounts outstanding under the accounts receivable financing facility are classified as short-term debt on the Company’s consolidated balance sheet. Additionally, the Company has short-term debt of $15.8 million outstanding as of December 26, 2009 under an $18.7 million short-term revolving credit facility. The weighted average annual interest rate on amounts outstanding under the short-term revolving credit facility at December 26, 2009 was 1.58%. Covenants. All of the senior notes discussed above are subject to customary affirmative and negative covenants, including limitations on sale/leaseback transactions; limitations on liens; limitations on mergers and similar transactions; and a covenant with respect to certain change of control triggering events. The 6.125% senior notes and the 7.125% senior notes are also subject to an interest rate adjustment in the event of a downgrade in the ratings to below investment grade. In addition, the senior unsecured credit facilities and the accounts receivable financing facility are subject to covenants, including, among other items, maximum leverage ratios. The Company was in compliance with all covenants at December 26, 2009 and December 27, 2008. Aggregate Maturities and Interest Expense. The aggregate maturities of long-term debt are as follows ($ in millions): Fiscal Years Ending December 2010 to 2011 . . . . ................................................. $ — 2012 .......... ................................................. 2,000.0 2013 .......... ................................................. 800.0 2014 to 2017 . . . . ................................................. — 2018 .......... ................................................. 1,200.0 Total . . . . . . . . . . . . . . . . . . . . . . . . . . . . . . . . . . . . . . . . . . . . . . . . . . . . . . . . . . . $ 4,000.0 Interest expense on total debt was $172.5 million in 2009, $233.7 million in 2008 and $134.2 million in 2007. 9. PENSION AND OTHER POSTRETIREMENT BENEFITS Net Pension and Postretirement Benefit Cost. The Company has various plans covering the majority of its employees. The net cost for the Company’s pension plans consisted of the following components ($ in millions): Fiscal Years 2009 2008 2007 Service cost . . . . . . . . . . . . . . . . . . . . . . . . ...................... $ 24.3 $ 24.6 $ 18.0 Interest cost . . . . . . . . . . . . . . . . . . . . . . . . ...................... 13.2 9.6 7.9 Expected return on plan assets . . . . . . . . . . ...................... (9.9) (13.0) (11.0) Amortization of prior service cost . . . . . . . . ...................... 0.2 0.3 — Net amortization of actuarial losses. . . . . . . ...................... 5.4 — — Net pension cost. . . . . . . . . . . . . . . . . . . . . . . . . . . . . . . . . . . . . . . . . . . $ 33.2 $ 21.5 $ 14.9 The increase in the net pension cost for fiscal year 2009 compared to fiscal year 2008 primarily resulted from lower than expected return on plan assets during 2008. The increase in the net pension cost for fiscal year 2008 compared to fiscal year 2007 is primarily due to additional employees participating in the cash balance retirement plan, as well as a plan amendment from graduated seven-year vesting to three-year cliff vesting, which became effective January 1, 2008. 92
  • 105.
    The Company maintainsan unfunded postretirement healthcare benefit plan covering the majority of its employees. The net credit for these postretirement benefits consisted of the following components ($ in millions): Fiscal Years 2009 2008 2007 Service cost . . . . . . . . . . . . . . . . . . . . . . . . . . . . . . . . . . . . . . . . . . . . . . . $ 1.2 $ 1.0 $ 0.9 Interest cost . . . . . . . . . . . . . . . . . . . . . . . . . . . . . . . . . . . . . . . . . . . . . . . 0.8 0.8 0.7 Amortization of prior service credit . . . . . . . . . . . . . . . . . . . . . . . . . . . . . (4.2) (4.2) (4.3) Net amortization of actuarial losses . . . . . . . . . . . . . . . . . . . . . . . . . . . . . 0.5 0.5 0.6 Net postretirement benefit credit . . . . . . . . . . . . . . . . . . . . . . . . . . . . . . . . $ (1.7) $ (1.9) $ (2.1) The Company amended the postretirement healthcare benefit plan in 2003, which reduced and capped benefit obligations, the effect of which is reflected in the amortization of the prior service credit component of the net postretirement benefit credit. Changes in Plan Assets, Benefit Obligation and Funded Status. Summarized information about the funded status and the changes in plan assets and benefit obligation is as follows ($ in millions): Other Postretirement Pension Benefits Benefits Fiscal Years 2009 2008 2009 2008 Fair value of plan assets at beginning of year . . . . . . . . . . . . . . . . . $ 119.2 $ 152.0 $ — $ — Actual return on plan assets . . . . . . . . . . . . . . . . . . . . . . . . . . . . . . 23.2 (44.9) — — Company contributions . . . . . . . . . . . . . . . . . . . . . . . . . . . . . . . . . 11.5 17.2 0.7 1.0 Employee contributions . . . . . . . . . . . . . . . . . . . . . . . . . . . . . . . . . — — 0.4 0.8 Benefits paid . . . . . . . . . . . . . . . . . . . . . . . . . . . . . . . . . . . . . . . . . (6.3) (5.1) (1.1) (1.8) Fair value of plan assets at end of year. . . . . . . . . . . . . . . . . . . . . . $ 147.6 $ 119.2 $ — $ — (1) Benefit obligation at beginning of year . . . ................. $ 192.9 $ 161.0 $ 14.1 $ 12.7 Service cost. . . . . . . . . . . . . . . . . . . . . . . . . ................. 24.3 24.6 1.2 1.1 Interest cost. . . . . . . . . . . . . . . . . . . . . . . . . ................. 13.2 9.6 0.8 0.7 Employee contributions . . . . . . . . . . . . . . . . ................. — — 0.4 0.8 Amendments . . . . . . . . . . . . . . . . . . . . . . . . ................. — — — 1.0 Actuarial (gains) losses . . . . . . . . . . . . . . . . ................. (9.5) 2.8 0.2 (0.4) Benefits paid . . . . . . . . . . . . . . . . . . . . . . . . ................. (6.4) (5.1) (1.1) (1.8) Benefit obligation at end of year(1) . . . . . . . . . . . . . . . . . . . . . . . . . $ 214.5 $ 192.9 $ 15.6 $ 14.1 Underfunded status at end of year . . . . . . . . . . . . . . . . . . . . . . . . . $ (66.9) $ (73.7) $ (15.6) $ (14.1) (1) Represents the projected benefit obligation for pension benefits and the accumulated postretirement benefit obli- gation for other postretirement benefits. The pension and other postretirement benefits liabilities recognized at December 26, 2009 and December 27, 2008 are as follows ($ in millions): Other Postretirement Pension Benefits Benefits 2009 2008 2009 2008 Accrued expenses and other current liabilities . . . . . . . . . . . . . . . . . $ (0.1) $ — $ (0.7) $ (0.9) Other noncurrent liabilities . . . . . . . . . . . . . . . . . . . . . . . . . . . . . . . (66.8) (73.7) (14.9) (13.2) Total pension and other postretirement liabilities . . . . . . . . . . . . . . . $ (66.9) $ (73.7) $ (15.6) $ (14.1) The accumulated benefit obligation for defined benefit pension plans was $172.6 million and $180.0 million at December 26, 2009 and December 27, 2008, respectively, and the projected benefit obligation for defined benefit pension plans was $214.5 million and $192.9 million at December 26, 2009 and December 27, 2008, respectively. The projected benefit obligation amounts are higher because they include projected future salary increases through expected retirement. 93
  • 106.
    Net actuarial gainsand losses reflect experience differentials relating to differences between expected and actual returns on plan assets, differences between expected and actual demographic changes, differences between expected and actual healthcare cost increases, and the effects of changes in actuarial assumptions. The fair value of the Company’s pension plan assets increased from $119.2 million at the end of 2008 to $147.6 million at the end of 2009 primarily resulting from investment gains. The investment gains were partially offset by increased benefit obligations related to the 2009 benefit accrual and resulted in a decrease in the pension plans’ unfunded status from $73.7 million at fiscal year-end 2008 to $66.9 million at fiscal year-end 2009 and a decrease of $28.5 million pre- tax, reflected in comprehensive income in stockholders’ equity. This decrease in unfunded status did not have an impact on the consolidated statement of income for 2009. The increase in the net pension cost for fiscal year 2009 compared to fiscal year 2008 resulted from lower than expected return on plan assets in 2008, reflected in the increased amortization of actuarial losses and the decrease in the expected return on assets. Net actuarial gains and losses, in excess of certain thresholds, are amortized into the consolidated statement of income over the 12-year average remaining service life of participants. The Company estimates the 2010 net periodic benefit cost for its pension plans to be included in its consolidated statement of income will be approximately $30 million. The net gain or loss and net prior service cost or credit recognized in other comprehensive income and reclassification adjustments for the periods presented, pre-tax, are as follows ($ in millions): Other Postretirement Pension Benefits Benefits Balances at December 29, 2007, pre-tax. . . . . . . . . . . . $ 15.3 $ (33.7) Loss (gain) arising during period . . . . . . . . . . . . . . . . . 60.7 (0.4) Amortization of actuarial loss included in net periodic benefit cost . . . . . . . . . . . . . . . . . . . . . . . . . . . . . . . — (0.5) Prior service cost (credit). . . . . . . . . . . . . . . . . . . . . . . — 1.0 Amortization of prior service (cost) credit . . . . . . . . . . (0.2) 4.2 Balances at December 27, 2008, pre-tax. . . . . . . . . . . . $ 75.8 $ (29.4) Loss (gain) arising during period . . . . . . . . . . . . . . . . . (22.9) 0.2 Amortization of actuarial loss included in net periodic benefit cost . . . . . . . . . . . . . . . . . . . . . . . . . . . . . . . (5.4) (0.5) Amortization of prior service (cost) credit . . . . . . . . . . (0.2) 4.2 Balances at December 26, 2009, pre-tax. . . . . . . . . . . . $ 47.3 $ (25.5) The estimated actuarial loss and prior service cost for the Company’s pension plans that are expected to be amortized from accumulated other comprehensive income into net pension cost in fiscal year 2010 is $2.0 million ($1.2 million after tax) and $0.2 million ($0.1 million after tax), respectively. The estimated net actuarial loss and prior service credit for the Company’s other postretirement plans that are expected to be amortized from accumulated other comprehensive income into net postretirement benefit credit in fiscal year 2010 are $0.5 million ($0.3 million after tax) and $(4.2) million ($(2.5) million after tax), respectively. See Note 2, “Summary of Significant Accounting Policies—Other Comprehensive Income and Accumulated Other Comprehensive Income,” for more information. Actuarial Assumptions. Actuarial weighted average assumptions used in determining plan information are as follows: Other Postretirement Pension Benefits Benefits 2009 2008 2007 2009 2008 2007 Weighted average assumptions used to determine benefit obligations at fiscal year-end: Discount rate . . . . . . . . . . . . . . . . . . . . . . . . . . . . . . . . . . . . . . . . . 5.70% 6.00% 6.00% 5.85% 6.00% 6.00% Salary growth rate . . . . . . . . . . . . . . . . . . . . . . . . . . . . . . . . . . . . . 4.50% 4.50% 4.50% — — — Weighted average assumptions used to determine net cost for the fiscal year ended: Discount rate . . . . . . . . . . . . . . . . . . . . . . . . . . . . . . . . . . . . . . . . . 6.00% 6.00% 5.75% 6.00% 6.00% 5.75% Expected long-term rate of return on plan assets . . . . . . . . . . . . . . . 8.25% 8.25% 8.00% — — — Salary growth rate . . . . . . . . . . . . . . . . . . . . . . . . . . . . . . . . . . . . . 4.50% 4.50% 4.50% — — — 94
  • 107.
    The expected rateof return for the pension plan represents the average rate of return to be earned on the plan assets over the period the benefits included in the benefit obligation are to be paid. The expected return on plan assets is determined by multiplying the expected long-term rate of return by the fair value of the plan assets and contributions, offset by expected return on expected benefit payments. In developing the expected rate of return, the Company considers long-term compounded annualized returns of historical market data, as well as historical actual returns on our plan assets. Using this reference information, the Company develops forward-looking return expectations for each asset category and a weighted average expected long-term rate of return for a targeted portfolio allocated across these investment categories. Future costs of the amended postretirement benefit healthcare plan are being capped based on 2004 costs. As a result, employer liability is not affected by healthcare cost trend. Pension Plan Assets. The Company believes the oversight of the investments held under its pension plans is rigorous and the investment strategies are prudent. The investment objectives of the Company’s qualified pension plan are designed to generate total asset returns both sufficient to meet its expected future benefit obligations, as well as returns greater than its policy benchmark reflecting the target weights of the asset classes used in its strategic asset allocation investment policy. The plan’s targeted strategic allocation to each asset class was determined through an asset/liability modeling study. The currently adopted strategic asset allocation targets approximately 70 percent in equity securities and 30 percent in fixed income and diversification within specific asset classes of these broad categories. The Company believes that the portfolio’s equity weighting strategy is consistent with investment goals and risk management practices applicable to the long-term nature of the plan’s benefit obligation. The precise amount for which the benefit obligations will be settled depends on future events, including interest rates, salary increases, and the life expectancy of the plan’s members. The obligations are estimated using actuarial assumptions, based on the current economic environment. The following table sets forth the target allocation for 2010 by asset category and the plan assets at fair value at the year-end 2009 reporting date by level within the fair value hierarchy ($ in millions): Percent of Target Plan Assets Allocation at Year-end Asset Category 2010 2009 Total Level 1(1) Level 2(1) Level 3(1) U.S. equity securities . . . . . . . . . . . . . . 50 – 60% 57% U.S. large-cap . . . . . . . . . . . . . . . . . $ 43.9 $ 27.1 $ 16.8(2) $ — U.S. small/mid-cap . . . . . . . . . . . . . 39.6 39.6 — — International equity securities . . . . . . . . 12 – 18% 13% 19.9 19.9 — — Fixed income . . . . . . . . . . . . . . . . . . . 27 – 33% 30% 44.2 23.5 20.7(3) — Total . . . . . . . . . . . . . . . . . . . . . . . . . . 100% $ 147.6 $ 110.1 $ 37.5 $ — (1) See Note 4, “Fair Value Disclosures,” for a description of the fair value hierarchy. (2) Consists of a common collective trust that invests in common stock of S&P 500 companies. (3) Primarily consists of a common collective trust that invests in passive bond market index lending funds and a short-term investment fund. Assets classified as Level 1 are valued at the readily available quoted price from an active market where there is significant transparency in the executed quoted price. Assets classified as Level 2 include units held in common collective trust funds, which have no readily available quoted market price but whose unit values are reported by the funds’ investment managers, and a short-term fixed income investment fund which is valued using other significant observable inputs such as quoted prices for comparable securities. 95
  • 108.
    Cash Flows. Employer Contributions. The Company has a remaining minimum pension funding requirement of $16.3 million under the Internal Revenue Code (“IRC”) during 2010 for our 2009 plan year. The Company expects to contribute an additional amount up to $14 million to its pension plans during fiscal 2010 above the aforementioned remaining minimum pension funding requirement. The expected contributions to the pension plans during 2010 are estimated to reflect amounts necessary to satisfy the minimum funding requirements or Medco’s discretion in bringing the plans to a higher funded status. The Company anticipates that contributions will consist solely of cash. Estimated Future Benefit Payments. The following benefit payments, which reflect expected future service, as appropriate, are expected to be paid ($ in millions): Other Pension Postretirement Fiscal Years Benefits(1) Benefits 2010 . . . . . . . ......................... $ 16.9 $ 0.8 2011 . . . . . . . ......................... $ 18.5 $ 0.6 2012 . . . . . . . ......................... $ 19.7 $ 0.6 2013 . . . . . . . ......................... $ 21.2 $ 0.6 2014 . . . . . . . ......................... $ 26.8 $ 0.7 2015-2019 . . . ......................... $ 134.3 $ 6.1 (1) The estimated future benefit payments increased from the amounts disclosed in the Company’s Annual Report on Form 10-K for the fiscal year ended December 27, 2008 primarily due to new employees participating in the cash balance retirement plan. Other Plans. The Company sponsors defined contribution retirement plans for all eligible employees, as defined in the plan documents. These plans are qualified under Section 401(k) of the IRC. Contributions to the plans are based on employee contributions and a Company matching contribution. The Company’s matching contributions to the plans were $37.6 million in 2009, $34.8 million in 2008 and $28.6 million in 2007. 10. TAXES ON INCOME Provision for Income Taxes. The components of the provision for income taxes are as follows ($ in millions): Fiscal Years 2009 2008 2007 Current provision: Federal . . . . . . . . . . . . . . . . . . . . . . . . . . . . . . . . . . . $ 844.9 $ 664.1 $ 594.7 State . . . . . . . . . . . . . . . . . . . . . . . . . . . . . . . . . . . . . 170.1 102.3 122.6 Foreign . . . . . . . . . . . . . . . . . . . . . . . . . . . . . . . . . . . (2.6) (1.2) — Total . . . . . . . . . . . . . . . . . . . . . . . . . . . . . . . . . . . 1,012.4 765.2 717.3 Deferred provision (benefit): Federal . . . . . . . . . . . . . . . . . . . . . . . . . . . . . . . . . . . (145.9) (63.8) (114.0) State . . . . . . . . . . . . . . . . . . . . . . . . . . . . . . . . . . . . . (42.3) (13.5) (12.0) Foreign . . . . . . . . . . . . . . . . . . . . . . . . . . . . . . . . . . . (1.2) — — Total . . . . . . . . . . . . . . . . . . . . . . . . . . . . . . . . . . . (189.4) (77.3) (126.0) Total provision for income taxes. . . . . . . . . . . . . . . . . . . $ 823.0 $ 687.9 $ 591.3 A reconciliation of the Company’s effective tax rate and the U.S. statutory rate is as follows: Fiscal Years 2009 2008 2007 U.S. statutory rate applied to pretax income . . . 35.0% 35.0% 35.0% Differential arising from: State taxes . . . . . . . . . . . . . . . . . . . . . . . . . . 3.9 3.2 4.8 Other . . . . . . . . . . . . . . . . . . . . . . . . . . . . . . 0.2 0.2 (0.5) Effective tax rate . . . . . . . . . . . . . . . . . . . . . . . 39.1% 38.4% 39.3% 96
  • 109.
    The Company’s 2009effective tax rate reflects a fourth-quarter 2009 income tax benefit of $22 million, primarily reflecting state-related tax items. The Company’s 2008 effective tax rate reflects a net state income tax benefit of $28 million recorded in the third quarter of 2008 resulting primarily from statute of limitations expirations in certain states, partially offset by state tax law changes. The Company may achieve additional state income tax savings in future quarters. To the extent that these state tax savings are realized, they will be recorded as a reduction to the provision for income taxes at the time the audit by the respective state taxing jurisdiction is complete or when the applicable statute of limitations has expired. Deferred Income Taxes. Deferred income taxes at year-end consisted of ($ in millions): December 26, 2009 December 27, 2008 Assets Liabilities Assets Liabilities Intangible assets . . . . . . . . . . . . . . . . . . . . . . . . . . . . . . . . . . . $ — $ 865.1 $ — $ 991.6 Accelerated depreciation . . . . . . . . . . . . . . . . . . . . . . . . . . . . . — 199.0 — 173.9 Accrued expenses . . . . . . . . . . . . . . . . . . . . . . . . . . . . . . . . . . 55.6 — 63.7 — Accrued rebates . . . . . . . . . . . . . . . . . . . . . . . . . . . . . . . . . . . 101.3 — 57.9 — Stock-based compensation . . . . . . . . . . . . . . . . . . . . . . . . . . . . 123.4 — 99.1 — Other . . . . . . . . . . . . . . . . . . . . . . . . . . . . . . . . . . . . . . . . . . . 92.6 36.8 85.3 46.6 Total deferred taxes. . . . . . . . . . . . . . . . . . . . . . . . . . . . . . . . . $ 372.9 $ 1,100.9 $ 306.0 $ 1,212.1 Net deferred income taxes . . . . . . . . . . . . . . . . . . . . . . . . . . . . $ 728.0 $ 906.1 Recognized as: Current deferred tax asset . . . . . . . . . . . . . . . . . . . . . . . . . . $ 230.8 $ 159.2 Noncurrent deferred tax liability . . . . . . . . . . . . . . . . . . . . . $ 958.8 $ 1,065.3 Other. Income taxes payable of $5.4 million and $34.8 million as of December 26, 2009 and December 27, 2008, respectively, are reflected in accrued expenses and other current liabilities on the audited consolidated balance sheets. Liabilities for income tax contingencies are primarily included in other noncurrent liabilities on the consolidated balance sheets. In the third quarter of 2006, the IRS commenced a routine examination of the Company’s U.S. income tax returns for the period subsequent to the spin-off, from August 20, 2003 through December 31, 2005, which was completed in December 2009. In the fourth quarter of 2008, the IRS commenced a routine examination of the Company’s 2006 and 2007 U.S. income tax returns, which is anticipated to be completed in 2010. The Company has agreed to extend the statute of limitations for the 2003 tax period and the 2004 and 2005 tax years to September 15, 2010. The IRS proposed and the Company had previously recorded certain adjustments to the Company’s 2003 to 2005 tax returns, which did not have a material impact on the consolidated financial statements. The Company is also undergoing various routine examinations by state and local tax authorities for various filing periods. During the third quarter of 2006, the Company recorded income taxes receivable associated with the IRS approval of an accounting method change for the timing of the deductibility of certain rebates passed back to clients. The income taxes receivable balance including interest was $198.3 million at December 26, 2009, of which $171.9 million represented a receivable from the IRS that was collected in February 2010. The Company expects to collect the remaining income taxes receivable representing the amounts due from various states plus interest in 2010. The income taxes receivable balance including interest was $213.4 million at December 27, 2008. The income tax receivable decreased as a result of the IRS examination where the Company and the IRS agreed that a portion of the deduction for such rebates would be deferred. 97
  • 110.
    Liabilities for IncomeTax Contingencies. The Company’s total gross liabilities for income tax contingencies as of December 26, 2009 amounted to $99.9 million, remain subject to audit, and may be released on audit closure or as a result of the expiration of statutes of limitations. A reconciliation of the beginning and ending gross liabilities for income tax contingencies is as follows ($ in millions): Fiscal Years 2009 2008 2007 Liabilities, beginning of year . . . . . . . . . . . . . . . . . . . . . . . . . . . . . . . . $ 78.3 $ 104.5 $ 89.8 Gross increases, acquisition effects . . . . . . . . . . . . . . . . ............ — — 3.0 Gross increases, prior period tax positions . . . . . . . . . . . ............ 35.6 17.2 11.5 Gross decreases, prior period tax positions . . . . . . . . . . ............ (8.4) (7.1) (5.6) Gross increases, current period tax positions . . . . . . . . . ............ 18.7 0.9 16.5 Settlements. . . . . . . . . . . . . . . . . . . . . . . . . . . . . . . . . . ............ (14.6) (0.1) (3.2) Lapse of statutes of limitations . . . . . . . . . . . . . . . . . . . ............ (9.7) (37.1) (7.5) Liabilities, end of year . . . . . . . . . . . . . . . . . . . . . . . . . . . . . . . . . . . . . $ 99.9 $ 78.3 $ 104.5 For the year ended December 26, 2009, there was a net increase of $21.6 million in the total gross liabilities for income tax contingencies primarily associated with current period tax positions. For the year ended December 27, 2008, there was a net decrease of $26.2 million in the total gross liabilities for income tax contingencies primarily due to statute of limitations expirations in certain states. As of December 26, 2009, if the Company’s liabilities for income tax contingencies were reversed into income from expense, income tax expense would be reduced by $52.8 million, net of federal income tax expense. The majority of the income tax contingencies are subject to statutes of limitations that are scheduled to expire by the end of 2014. In addition, approximately 30% of the income tax contingencies are anticipated to settle over the next twelve months. The Company recognizes interest related to liabilities for income tax contingencies in the provision for income taxes for which the Company had approximately $10.8 million and $14.2 million accrued at December 26, 2009 and December 27, 2008, respectively. Total (income) expense, net, recognized for interest related to liabilities for income tax contingencies was $(3.4) million for both 2009 and 2008 and $4.6 million for 2007. The Company’s policy for penalties related to liabilities for income tax contingencies is to recognize such penalties in the provision for income taxes. The Company has had no significant penalties for liabilities for income tax contingencies. 11. STOCK-BASED COMPENSATION Overview. The Compensation Committee of the Company’s Board of Directors regularly reviews the Company’s compensation structure and practices, including the timing of its stock-based awards. The Audit Committee of the Company’s Board of Directors also reviews the Company’s option-granting practices from time to time. The Company grants options to employees and directors to purchase shares of Medco common stock at the fair market value on the date of grant. The options generally vest over three years (director options vest in one year) and expire within 10 years from the date of the grant. Vested options held by employees may expire earlier following termination of employment. The post-termination exercise period varies from 90 days for a voluntary termination to the full remaining term for termination of employment following a change in control. Directors always have the full term to exercise vested options. All option exercises are subject to restrictions on insider trading, and directors, officers and certain other employees with regular access to material information are subject to quarterly restrictions on trading. Under the terms of the Medco Health Solutions, Inc. 2002 Stock Incentive Plan, as of December 26, 2009, 18.2 million shares of the Company’s common stock are available for awards. As of December 26, 2009, under the terms of the Accredo Health, Incorporated 2002 Long-Term Incentive Plan as amended and restated on August 18, 2005, there are 0.5 million shares of the Company’s common stock available for awards. 98
  • 111.
    The fair valueof options granted is estimated on the date of grant using the Black-Scholes option-pricing model. The Medco volatility assumption is based on the Company’s stock price volatility, and for the initial years as a publicly traded company was blended with a PBM industry volatility average. The Company uses historical data to estimate the expected option life. The expected option life represents the period of time that options granted are expected to be outstanding. Groups of employees that have similar historical exercise behavior are considered separately for valuation purposes. The risk-free rate is based on the U.S. Treasury yield curve in effect at the time of grant. The weighted average fair value of options granted for fiscal years 2009, 2008 and 2007 was $11.40, $14.60 and $11.86, respectively. The weighted average assumptions utilized for options granted during the periods presented are as follows: Fiscal Years 2009 2008 2007 Medco stock options Black-Scholes assumptions (weighted average): Expected dividend yield. . . . . . . . . . . . . . . . . . . . . . . . . . . . . . . . . . . . . . . . . . — — — Risk-free interest rate . . . . . . . . . . . . . . . . . . . . . . . . . . . . . . . . . . . . . . . . . . . 2.0% 2.8% 4.7% Expected volatility. . . . . . . . . . . . . . . . . . . . . . . . . . . . . . . . . . . . . . . . . . . . . . 27.0% 27.0% 29.0% Expected life (years) . . . . . . . . . . . . . . . . . . . . . . . . . . . . . . . . . . . . . . . . . . . . 5.0 5.0 5.0 Stock Option Plans. Summarized information related to stock options held by the Company’s employees and directors is as follows: Weighted Average Aggregate Number of Weighted Remaining Intrinsic Shares Average Contractual Value (in thousands) Exercise Price Term (in millions) Outstanding at December 27, 2008 . . . . . . . . . . . . . . . . . . 27,387.3 $29.55 Granted . . . . . . . . . . . . . . . . . . . . . . . . . . . . . . . . . . . . . . 6,578.0 41.66 Exercised . . . . . . . . . . . . . . . . . . . . . . . . . . . . . . . . . . . . . (7,027.0) 23.09 Forfeited. . . . . . . . . . . . . . . . . . . . . . . . . . . . . . . . . . . . . . (620.5) 36.23 Outstanding at December 26, 2009 . . . . . . . . . . . . . . . . . . 26,317.8 $34.14 6.77 $787.2 Exercisable at December 26, 2009 . . . . . . . . . . . . . . . . . . . 14,306.7 $27.23 5.53 $526.7 The total intrinsic value of options exercised during fiscal years 2009, 2008 and 2007 was $202.6 million, $89.0 million and $254.7 million, respectively. Net income, as reported, includes stock-based compensation expense related to stock options for fiscal years 2009, 2008 and 2007 of $45.3 million ($74.8 million pre-tax), $39.8 million ($65.7 million pre-tax) and $29.3 million ($48.2 million pre-tax), respectively. As of December 26, 2009, there was $74.1 million of total unrecognized compensation cost related to outstanding stock options. That cost is expected to be recognized over a weighted average period of 1.8 years. The total fair value of shares vested during fiscal years 2009, 2008 and 2007 was $70.0 million, $65.7 million and $69.1 million, respectively. The Company expects the majority of outstanding non- vested options to vest. The activity related to non-vested options is as follows: Weighted Number of Average Shares Grant-Date (in thousands) Fair Value Non-vested at December 27, 2008. .......................... 11,820.5 $12.55 Granted . . . . . . . . . . . . . . . . . . . . .......................... 6,578.0 12.07 Vested . . . . . . . . . . . . . . . . . . . . . .......................... (6,056.2) 11.56 Forfeited . . . . . . . . . . . . . . . . . . . .......................... (331.2) 17.01 Non-vested at December 26, 2009. . . . . . . . . . . . . . . . . . . . . . . . . . . 12,011.1 $12.66 Restricted Stock Units. The Company grants restricted stock units to employees and directors. Restricted stock units generally vest after three years (director restricted stock units vest in one year). The fair value of restricted stock units granted is determined by the product of the number of shares granted and the grant-date market price of the Company’s common stock. The fair value of the restricted stock units is expensed on a straight-line basis over the requisite service period. Net income, as reported, includes stock-based compensation expense related to restricted stock units for fiscal years 2009, 2008 and 2007 of $41.2 million ($68.1 million pre-tax), $38.3 million ($63.1 mil- lion pre-tax) and $31.8 million ($52.2 million pre-tax), respectively. 99
  • 112.
    Upon vesting, certainemployees and directors may defer conversion of the restricted stock units to common stock. Restricted stock units granted to directors are required to be deferred until their service on the Board of Directors ends. Summarized information related to restricted stock units held by the Company’s employees and directors is as follows: Aggregate Number of Intrinsic Shares Value Restricted Stock Units (in thousands) (in millions) Outstanding at December 27, 2008 . . . . . . . . . . . . . . . . . . 5,849.0 Granted . . . . . . . . . . . . . . . . . . . . . . . . . . . . . . . . . . . . . . 1,753.1 Converted . . . . . . . . . . . . . . . . . . . . . . . . . . . . . . . . . . . . . (1,641.8) Forfeited . . . . . . . . . . . . . . . . . . . . . . . . . . . . . . . . . . . . . . (178.9) Outstanding at December 26, 2009 . . . . . . . . . . . . . . . . . . 5,781.4 $370.3 Vested and deferred at December 26, 2009. . . . . . . . . . . . . 730.4 $ 46.8 The weighted average grant-date fair value of restricted stock units granted during fiscal years 2009, 2008 and 2007 was $40.71, $50.15 and $36.01, respectively. The total intrinsic value of restricted stock units converted during fiscal years 2009, 2008 and 2007 was $66.9 million, $86.8 million and $6.2 million, respectively. The increase in the restricted stock unit converted figures for 2008 compared with 2007 reflects restricted stock units becoming a larger component of total employee stock compensation beginning in fiscal 2005; those grants vested and converted in 2008. Summarized information related to non-vested restricted stock units held by the Company’s employees and directors is as follows: Weighted Number of Average Shares Grant-Date Non-vested Restricted Stock Units (in thousands) Fair Value Non-vested at December 27, 2008 . . . . . . . . . . . . . . . . . . . 5,190.5 $37.32 Granted . . . . . . . . . . . . . . . . . . . . . . . . . . . . . . . . . . . . . . . 1,753.1 40.71 Vested . . . . . . . . . . . . . . . . . . . . . . . . . . . . . . . . . . . . . . . . (1,713.7) 29.60 Forfeited . . . . . . . . . . . . . . . . . . . . . . . . . . . . . . . . . . . . . . (178.9) 40.78 Non-vested at December 26, 2009 . . . . . . . . . . . . . . . . . . . 5,051.0 $41.21 As of December 26, 2009, there was $82.5 million of total unrecognized compensation cost related to non- vested restricted stock units. That cost is expected to be recognized over a weighted average period of 1.7 years. The total grant-date fair value of restricted stock units vested during fiscal years 2009, 2008 and 2007 was $50.7 million, $50.2 million and $2.8 million, respectively. The Company expects the majority of non-vested restricted stock units to vest. Employee Stock Purchase Plan. The Company’s Board of Directors adopted the 2007 Employee Stock Purchase Plan (“2007 ESPP”) on January 24, 2007 and the Company’s shareholders approved the 2007 ESPP on May 24, 2007. Under the terms of the 2007 ESPP, 6,000,000 shares of the Company’s common stock are available for issuance, and eligible employees may have up to 10% of gross pay deducted from their payroll up to a maximum of $15,000 of fair market value per year to purchase shares of Medco common stock. The Company matches payroll deductions at the rate of 17.65% and the deductions and contributions accumulate; on the last day of trading each calendar quarter the accumulated amounts are applied to the purchase of Medco stock. The effect of the matching contribution is that employees pay 85% of the cost of shares under the ESPP. The 2007 ESPP became effective on July 1, 2007 and will expire the earlier of June 30, 2017 or the date as of which the maximum number of shares has been purchased. Purchases of Medco stock under the 2007 ESPP were 460,724 shares at a weighted average price of $45.05 in 2009, and 400,251 shares at a weighted average price of $46.73 in 2008. Net income, as reported, includes stock-based compensation expense related to the ESPP for fiscal years 2009, 2008 and 2007 of $1.9 million ($3.1 million pre-tax), $1.8 million ($2.9 million pre-tax) and $1.3 million ($2.1 million pre-tax), respectively. 100
  • 113.
    The above sharedata has been retrospectively adjusted to reflect the January 24, 2008 two-for-one stock split. See Note 1, “Background and Basis of Presentation,” for more information. 12. SHARE REPURCHASE PROGRAMS Since 2005, the Company has executed share repurchases of 186.3 million shares at a cost of $6.9 billion through its share repurchase programs. The Company is currently authorized to repurchase its shares under a $3 billion share repurchase program (the “2008 Program”), which was announced in November 2008 and expires in November 2010, with $1.6 billion remaining under its current authorization as of December 26, 2009. During fiscal year 2009 under the 2008 Program, the Company repurchased 27.3 million shares at a total cost of $1.24 billion with an average per-share cost of $45.38. In the fourth quarter 2008, the Company repurchased 5.2 million shares at a cost of $200 million under the 2008 Program. Since the inception of the 2008 Program, the Company has repurchased 32.4 million shares for a total cost of $1.44 billion with an average per-share cost of $44.34. The Company’s $5.5 billion share repurchase program, which was approved in August 2005 (the “2005 Program”), originally authorized share repurchases of $500 million and was increased at various times. The Company completed the 2005 Program in October 2008. During fiscal year 2008, the Company repurchased 42.4 million shares at a cost of $1.98 billion under the 2005 Program. From time to time, the Company may make additional share repurchases, which it intends to fund with the Company’s free cash flow (cash flow from operations less capital expenditures). The Company’s Board of Directors periodically reviews the Company’s share repurchase programs and approves the associated trading parameters. 13. SEGMENT AND GEOGRAPHIC DATA Reportable Segments. The Company has two reportable segments, PBM and Specialty Pharmacy. The PBM segment involves sales of traditional prescription drugs and supplies to the Company’s clients and members, either through the Company’s networks of contractually affiliated retail pharmacies or the Company’s mail-order pharma- cies. The PBM segment also includes the operating results of PolyMedica, a provider of diabetes testing supplies and related products, as well as majority-owned Europa Apotheek, which primarily provides mail-order pharmacy services in Germany, commencing on the April 28, 2008 acquisition date. The Specialty Pharmacy segment, which was formed at the time of the Accredo acquisition in 2005, includes the sale of higher-margin specialty pharmacy products and services for the treatment of chronic and complex (potentially life-threatening) diseases. The Specialty Pharmacy segment also includes the operating results of Critical Care, a provider of specialty infusion services. The Company defines the Specialty Pharmacy segment based on a product set and associated services, broadly characterized to include drugs that are high-cost, usually developed by biotechnology companies and often injectable or infusible, and which require elevated levels of patient support. When dispensed, these products frequently require ancillary administration equipment, special packaging, and a higher degree of patient-oriented customer service than is required in the traditional PBM business model, including in-home nursing services and administration. In addition, specialty pharmacy products and services are often covered through medical benefit programs with the primary payors being insurance companies and government programs. Additionally, payors include patients, as well as PBM clients. Factors Used to Identify Reportable Segments. The Specialty Pharmacy segment was formed as a result of the 2005 acquisition of Accredo in response to a management desire to manage the acquired business together with Medco’s pre-existing specialty pharmacy activity as a separate business from Medco’s PBM operations. This acquisition complemented the pre-existing Medco specialty pharmacy operation, which was evolving in 2005. 101
  • 114.
    Selected Segment Incomeand Asset Information. Total net revenues and operating income are measures used by the chief operating decision maker to assess the performance of each of the Company’s operating segments. The following tables present selected financial information about the Company’s reportable segments, including a reconciliation of operating income to income before provision for income taxes ($ in millions): For Fiscal Years Ended: December 26, 2009 December 27, 2008 December 29, 2007 Specialty Specialty Specialty PBM Pharmacy Total PBM(1) Pharmacy Total(1) PBM(2) Pharmacy(3) Total(2)(3) Product net revenues . . . . . . . . . . . . . . . . . . . $49,526.2 $9,435.2 $58,961.4 $42,678.5 $7,897.7 $50,576.2 $37,981.4 $5,980.5 $43,961.9 Total service revenues . . . . . . . . . . . . . . . . . . 750.5 92.3 842.8 605.3 76.5 681.8 482.1 62.2 544.3 Total net revenues . . . . . . . . . . . . . . . . . . . . . 50,276.7 9,527.5 59,804.2 43,283.8 7,974.2 51,258.0 38,463.5 6,042.7 44,506.2 Total cost of revenues . . . . . . . . . . . . . . . . . . 46,951.5 8,825.7 55,777.2 40,186.2 7,343.4 47,529.6 35,997.7 5,563.2 41,560.9 Selling, general and administrative expenses . . . . . 1,158.3 297.2 1,455.5 1,120.0 305.0 1,425.0 884.3 229.8 1,114.1 Amortization of intangibles . . . . . . . . . . . . . . . 258.1 47.5 305.6 240.5 44.6 285.1 188.6 39.5 228.1 Operating income . . . . . . . . . . . . . . . . . . . . . $ 1,908.8 $ 357.1 $ 2,265.9 $ 1,737.1 $ 281.2 $ 2,018.3 $ 1,392.9 $ 210.2 $ 1,603.1 Reconciling items to income before provision for income taxes: Interest expense . . . . . . . . . . . . . . . . . . . . . . 172.5 233.7 134.2 Interest (income) and other (income) expense, net . . (9.9) (6.2) (34.4) Income before provision for income taxes . . . . . . $ 2,103.3 $ 1,790.8 $ 1,503.3 Capital expenditures . . . . . . . . . . . . . . . . . . . $ 209.1 $ 29.7 $ 238.8 $ 258.5 $ 28.4 $ 286.9 $ 142.4 $ 35.3 $ 177.7 (1) Includes majority-owned Europa Apotheek’s operating results commencing on the April 28, 2008 acquisition date, and for the subsequent period. (2) Includes PolyMedica’s operating results commencing on the October 31, 2007 acquisition date, and for the subsequent periods. (3) Includes Critical Care’s operating results commencing on the November 14, 2007 acquisition date, and for the subsequent periods. Identifiable Assets: As of December 26, 2009 As of December 27, 2008 Specialty Specialty PBM Pharmacy Total PBM Pharmacy Total Total identifiable assets . . . . . . . . . . . . $14,226.8 $3,688.7 $17,915.5 $13,267.2 $3,743.7 $17,010.9 Geographic Information. The Company’s net revenues from its European operations represented less than 1% of the Company’s consolidated net revenues for fiscal years 2009 and 2008. There were no revenues from European operations in fiscal 2007. All other revenues are primarily earned in the United States. 14. COMMITMENTS AND CONTINGENCIES Legal Proceedings In the ordinary course of business, the Company is involved in litigation, claims, government inquiries, investigations, charges and proceedings, including, but not limited to, those relating to regulatory, commercial, employment, employee benefits and securities matters. The significant matters are described below. There is uncertainty regarding the possible course and outcome of the proceedings discussed below. Although it is not feasible to predict or determine the final outcome of any proceedings with certainty, the Company believes there is no litigation pending against the Company that could have, individually or in the aggregate, a material adverse effect on the Company’s business, financial condition, liquidity and operating results. However, there can be no assurances that an adverse outcome in any of the proceedings described below will not result in material fines, penalties and damages, changes to the Company’s business practices, loss of (or litigation with) clients or a material adverse effect on the Company’s business, financial condition, liquidity and operating results. It is also possible that future results of operations for any particular quarterly or annual period could be materially adversely affected by the ultimate resolution of one or more of these matters, or changes in the Company’s assumptions or its strategies related to these proceedings. The Company continues to believe that its business practices comply in all material respects with applicable laws and regulations and is vigorously defending itself in the actions described below. The Company believes that most of the claims made in these proceedings would not likely be covered by insurance. 102
  • 115.
    In accordance withthe FASB’s standard on accounting for contingencies, the Company records accruals for contingencies when it is probable that a liability will be incurred and the amount of loss can be reasonably estimated. These assessments can involve a series of complex judgments about future events and may rely heavily on estimates and assumptions that have been deemed reasonable by management. Government Proceedings and Requests for Information. The Company is aware of the existence of three sealed qui tam matters. The first action is filed in the Eastern District of Pennsylvania and it appears to allege that the Company billed government payors using invalid or out-of-date national drug codes (“NDCs”). The second action is filed in the District of New Jersey and appears to allege that the Company charged government payors a different rate than it reimbursed pharmacies; engaged in duplicate billing; refilled prescriptions too soon; and billed government payors for prescriptions written by unlicensed physicians and physicians with invalid Drug Enforcement Agency authorizations. The Department of Justice has not yet made any decision as to whether it will intervene in either of these matters. The matters are under seal and U.S. District Court orders prohibit the Company from answering inquiries about the complaints. The Company was notified of the existence of these two qui tam matters during settlement negotiations on an unrelated matter with the Department of Justice in 2006. The Company does not know the identities of the relators in either of these matters. A third qui tam matter relates to PolyMedica, a subsidiary of the Company acquired in the fourth quarter of 2007. The Company is currently complying with a subpoena for documents relating to this matter from the Department of Health and Human Services Office of the Inspector General and fully cooperating with the Government’s investigation. The Company has learned that the Government’s investigation arose from a qui tam complaint that was filed against the Company and PolyMedica. The Company was able to make the public disclosure of the existence of the qui tam pursuant to an order issued by the Court where the qui tam complaint was filed, permitting disclosure of the existence of the qui tam complaint. The qui tam complaint itself, and all filings in the case, remain under seal until further order of the applicable Court. By order of the Court, Medco is prohibited from disclosing any additional information regarding the qui tam complaint. The Government has not made an intervention decision at this time. ERISA and Similar Litigation. In December 1997, a lawsuit captioned Gruer v. Merck-Medco Managed Care, L.L.C. was filed in the U.S. District Court for the Southern District of New York against Merck & Co., Inc. (“Merck”) and the Company. The suit alleges that the Company should be treated as a “fiduciary” under the provisions of ERISA (the Employee Retirement Income Security Act of 1974) and that the Company had breached fiduciary obligations under ERISA in a variety of ways. After the Gruer case was filed, a number of other cases were filed in the same Court asserting similar claims. In December 2002, Merck and the Company agreed to settle the Gruer series of lawsuits on a class action basis for $42.5 million, and agreed to certain business practice changes, to avoid the significant cost and distraction of protracted litigation. In September 2003, the Company paid $38.3 million to an escrow account, representing the Company’s portion, or 90%, of the proposed settlement. The release of claims under the settlement applies to plans for which the Company administered a pharmacy benefit at any time between December 17, 1994 and the date of final approval. It does not involve the release of any potential antitrust claims. In May 2004, the U.S. District Court granted final approval to the settlement and a final judgment was entered in June 2004. Various appeals were taken and in October 2007, the U.S. Court of Appeals for the Second Circuit overruled all but one objection to the settlement that had been the subject of the appeals. The appeals court vacated the lower court’s approval of the settlement in one respect, and remanded the case to the District Court for further proceedings relating to the manner in which the settlement funds should be allocated between self-funded and insured plans. Since that time, the settlement has been revised to allocate a greater percentage of the settlement funds to self- funded plans, and in June 2009, the District Court approved the modified plan of allocation. The plaintiff in one of the similar Gruer series of cases discussed above, Blumenthal v. Merck-Medco Managed Care, L.L.C., et al., has elected to opt out of the settlement. 103
  • 116.
    Similar ERISA-based complaintsagainst the Company and Merck were filed in eight additional actions by ERISA plan participants, purportedly on behalf of their plans, and, in some of the actions, similarly situated self- funded plans. The ERISA plans themselves, which were not parties to these lawsuits, had elected to participate in the Gruer settlement discussed above and, accordingly, seven of these actions had been dismissed pursuant to the final judgment discussed above. The plaintiff in another action, Betty Jo Jones v. Merck-Medco Managed Care, L.L.C., et al., has filed a Second Amended Complaint, in which she seeks to represent a class of all participants and beneficiaries of ERISA plans that required such participants to pay a percentage co-payment on prescription drugs. The effect of the release under the Gruer settlement discussed above on the Jones action has not yet been litigated. In addition to these cases, a proposed class action complaint against Merck and the Company has been filed in the U.S. District Court for the Northern District of California by trustees of another benefit plan, the United Food and Commercial Workers Local Union No. 1529 and Employers Health and Welfare Plan Trust. This plan has elected to opt out of the Gruer settlement. The United Food and Commercial Workers Local Union No. 1529 and Employers Health and Welfare Plan Trust v. Medco Health Solutions, Inc. and Merck & Co., Inc. action has been transferred and consolidated in the U.S. District Court for the Southern District of New York by order of the Judicial Panel on Multidistrict Litigation. In September 2002, a lawsuit captioned Miles v. Merck-Medco Managed Care, L.L.C., based on allegations similar to those in the ERISA cases discussed above, was filed against Merck and the Company in the Superior Court of California. The theory of liability in this action is based on a California law prohibiting unfair business practices. The Miles case was removed to the U.S. District Court for the Southern District of California and was later transferred to the U.S. District Court for the Southern District of New York and consolidated with the ERISA cases pending against Merck and the Company in that Court. The Company does not believe that it is a fiduciary under ERISA (except in those instances in which it has expressly contracted to act as a fiduciary for limited purposes), and believes that its business practices comply with all applicable laws and regulations. Antitrust and Related Litigation. In August 2003, a lawsuit captioned Brady Enterprises, Inc., et al. v. Medco Health Solutions, Inc., et al. was filed in the U.S. District Court for the Eastern District of Pennsylvania against Merck and the Company. The plaintiffs, who seek to represent a national class of retail pharmacies that had contracted with the Company, allege that the Company has conspired with, acted as the common agent for, and used the combined bargaining power of plan sponsors to restrain competition in the market for the dispensing and sale of prescription drugs. The plaintiffs allege that, through the alleged conspiracy, the Company has engaged in various forms of anticompetitive conduct, including, among other things, setting artificially low reimbursement rates to such pharmacies. The plaintiffs assert claims for violation of the Sherman Act and seek treble damages and injunctive relief. The plaintiffs’ motion for class certification is currently pending before the Multidistrict Litigation Court. In October 2003, a lawsuit captioned North Jackson Pharmacy, Inc., et al. v. Medco Health Solutions, Inc., et al. was filed in the U.S. District Court for the Northern District of Alabama against Merck and the Company. In their Second Amended Complaint, the plaintiffs allege that Merck and the Company engaged in price fixing and other unlawful concerted actions with others, including other PBMs, to restrain trade in the dispensing and sale of prescription drugs to customers of retail pharmacies who participate in programs or plans that pay for all or part of the drugs dispensed, and conspired with, acted as the common agent for, and used the combined bargaining power of plan sponsors to restrain competition in the market for the dispensing and sale of prescription drugs. The plaintiffs allege that, through such concerted action, Merck and the Company engaged in various forms of anticompetitive conduct, including, among other things, setting reimbursement rates to such pharmacies at unreason- ably low levels. The plaintiffs assert claims for violation of the Sherman Act and seek treble damages and injunctive relief. The plaintiffs’ motion for class certification has been granted, but this matter has been consolidated with other actions where class certification remains an open issue. 104
  • 117.
    In December 2005,a lawsuit captioned Mike’s Medical Center Pharmacy, et al. v. Medco Health Solutions, Inc., et al. was filed against the Company and Merck in the U.S. District Court for the Northern District of California. The plaintiffs seek to represent a class of all pharmacies and pharmacists that had contracted with the Company and California pharmacies that had indirectly purchased prescription drugs from Merck and make factual allegations similar to those in the Alameda Drug Company action discussed below. The plaintiffs assert claims for violation of the Sherman Act, California antitrust law and California law prohibiting unfair business practices. The plaintiffs demand, among other things, treble damages, restitution, disgorgement of unlawfully obtained profits and injunctive relief. In April 2006, the Brady plaintiffs filed a petition to transfer and consolidate various antitrust actions against PBMs, including North Jackson, Brady, and Mike’s Medical Center before a single federal judge. The motion was granted in August 2006. These actions are now consolidated for pretrial purposes in the U.S. District Court for the Eastern District of Pennsylvania. The consolidated action is known as In re Pharmacy Benefit Managers Antitrust Litigation. The plaintiffs’ motion for class certification in certain actions is currently pending before the Multidistrict Litigation Court. In January 2004, a lawsuit captioned Alameda Drug Company, Inc., et al. v. Medco Health Solutions, Inc., et al. was filed against the Company and Merck in the Superior Court of California. The plaintiffs, which seek to represent a class of all California pharmacies that had contracted with the Company and that had indirectly purchased prescription drugs from Merck, allege, among other things, that since the expiration of a 1995 consent injunction entered by the U.S. District Court for the Northern District of California, if not earlier, the Company failed to maintain an Open Formulary (as defined in the consent injunction), and that the Company and Merck had failed to prevent nonpublic information received from competitors of Merck and the Company from being disclosed to each other. The plaintiffs further allege that, as a result of these alleged practices, the Company has been able to increase its market share and artificially reduce the level of reimbursement to the retail pharmacy class members, and that the prices of prescription drugs from Merck and other pharmaceutical manufacturers that do business with the Company had been fixed and raised above competitive levels. The plaintiffs assert claims for violation of California antitrust law and California law prohibiting unfair business practices. The plaintiffs demand, among other things, compensatory damages, restitution, disgorgement of unlawfully obtained profits and injunctive relief. In the complaint, the plaintiffs further allege, among other things, that the Company acts as a purchasing agent for its plan sponsor customers, resulting in a system that serves to suppress competition. Contract Litigation. In 2006, a group of independent pharmacies filed an arbitration demand against Medco captioned Tomeldon Company, Inc. et al. v. Medco Health Solutions, Inc. The claimant pharmacies allege, among other things, breach of contract arising out of Medco’s Pharmacy Services Manual and Medco’s retail pharmacy audits of compound claims. The arbitration demand was filed on behalf of a purported class of retail pharmacies that had been audited for overpriced compounds. The claimants later expanded their claims to include two additional classes: one for pharmacies that claimed they lost profits after leaving Medco’s network following an audit finding of overpriced compounds and one for pharmacies subject to audits that were not yet finalized. In August 2008, the arbitration panel certified the original class but only concerning certain breach of contract claims. The panel declined to certify the additional proposed classes and also declined to certify the original class based on business tort or quasi-contract claims. In June 2009, the parties reached an agreement in principle to settle the dispute for an immaterial amount. The arbitration panel issued a final order approving the settlement on November 11, 2009. PolyMedica Shareholder Litigation. In August 2007, a putative stockholder class action lawsuit related to the merger was filed by purported stockholders of PolyMedica in the Superior Court of Massachusetts for Middlesex County against, amongst others, the Company and its affiliate, MACQ Corp. The lawsuit captioned Groen v. PolyMedica Corp. et al., alleged, among other things, that the price agreed to in the merger agreement was inadequate and unfair to the PolyMedica stockholders and that the defendants breached their duties to the stockholders and/or aided breaches of duty by other defendants in negotiating and approving the merger agreement. Shortly thereafter, two virtually identical lawsuits (only one of which named the Company as a defendant) were filed in the same Court. In September 2007, the parties to these actions reached an agreement in principle to settle the actions for an immaterial amount and in May 2008, the Court granted final approval of the settlement and dismissed the actions with prejudice on the merits. Plaintiffs’ counsel’s application for attorneys’ fees was rejected by the Court, resulting in the award of costs only. Plaintiffs’ counsel has filed a motion for reconsideration of the fees with the Court. 105
  • 118.
    Other Matters The Company entered into an indemnification and insurance matters agreement with Merck in connection with the Company’s spin-off in 2003. To the extent that the Company is required to indemnify Merck for liabilities arising out of a lawsuit, an adverse outcome with respect to Merck could result in the Company making indemnification payments in amounts that could be material, in addition to any damages that the Company is required to pay. In the ordinary course of business, the Company is involved in disputes with clients, retail pharmacies and vendors, which may involve litigation, claims, arbitrations and other proceedings. Although it is not feasible to predict or determine the final outcome of any proceedings with certainty, the Company does not believe that any of these disputes could have, individually or in the aggregate, a material adverse effect on the Company’s business, financial condition, liquidity or operating results. Purchase Commitments As of December 26, 2009, the Company has purchase commitments primarily for contractual commitments to purchase inventory from certain biopharmaceutical manufacturers associated with Accredo’s Specialty Pharmacy business consisting of a firm commitment of $324.6 million, and firm commitments for 2010 of $123.5 million with additional commitments through 2012 subject to price increases or variable quantities based on patient usage or days on hand. The Company also has purchase commitments for diabetes supplies of $69.9 million, technology-related agreements of $44.0 million and advertising commitments of $11.8 million. Insurance The Company maintains insurance coverage with deductibles and self-insurance that management considers adequate for its needs under current circumstances, including commercial professional liability coverage of $85 million per individual claim. Such coverage reflects market conditions (including cost and availability) existing at the time coverage is written. In addition to the Company’s commercial professional liability insurance policies, the Company has a retained liability component requiring certain self-insurance reserves to cover potential claims. The Company currently processes any claims included in self-insured retention levels through a captive insurance company. The Company’s PBM operations, including, for example, the dispensing of prescription drugs by its mail- order pharmacies, may subject the Company to litigation and liability for damages. Historically, the Company has not had any professional liability claims that have exceeded its insurance coverage amount, and any claims have not been material. The Company believes that its insurance coverage protection for these types of claims is adequate. However, the Company might not be able to maintain its professional and general liability insurance coverage in the future, and insurance coverage might not be available on acceptable terms or adequate to cover any or all potential professional liability claims. A successful professional liability claim in excess of the Company’s insurance coverage, or one for which an exclusion from coverage applies, could have a material adverse effect on the Company’s financial condition and results of operations. 106
  • 119.
    Item 9. Changesin and Disagreements with Accountants on Accounting and Financial Disclosure. Not applicable. Item 9A. Controls and Procedures. Management’s Responsibility for Financial Statements Our management is responsible for the integrity and objectivity of all information presented in this Annual Report on Form 10-K. The consolidated financial statements were prepared in conformity with accounting principles generally accepted in the United States of America and include amounts based on management’s best estimates and judgments. The Audit Committee of the Board of Directors, which is comprised solely of independent directors, meets regularly with our independent registered public accounting firm, PricewaterhouseCoopers LLP, the internal auditors and representatives of management to review accounting, financial reporting, internal control and audit matters, as well as the nature and extent of the related audit efforts. The Audit Committee is responsible for the engagement of our independent registered public accounting firm. Our independent registered public accounting firm and internal auditors have free access to the Audit Committee. Conclusion Regarding the Effectiveness of Disclosure Controls and Procedures The Company maintains disclosure controls and procedures that are designed to provide reasonable assurance that information required to be disclosed by the Company in reports that we file or submit under the Securities Exchange Act of 1934, as amended (the “Exchange Act”) is recorded, processed, summarized, and reported within the time periods specified in SEC rules and forms, and is accumulated and communicated to management, including our Chief Executive Officer and Chief Financial Officer, as appropriate, to allow timely decisions regarding required disclosure. As of the end of the period covered by this Report, our management, with the participation of the Chief Executive Officer and Chief Financial Officer, evaluated the effectiveness of the design and operation of the Company’s disclosure controls and procedures (as defined in Rules 13a-15(e) and 15d-15(e) under the Exchange Act). Based on this evaluation our Chief Executive Officer and Chief Financial Officer have concluded that the Company’s disclosure controls and procedures were effective to provide reasonable assurance that the objectives described above were met as of the end of the period covered by this Annual Report on Form 10-K. Management’s Report on Internal Control over Financial Reporting The Company’s management is responsible for establishing and maintaining adequate internal control over financial reporting, as such term is defined in Rules 13a-15(f) and 15d-15(f) under the Securities Exchange Act of 1934. Because of its inherent limitations, internal control over financial reporting may not prevent or detect misstatements. Also, projections of any evaluation of effectiveness to future periods are subject to the risk that controls may become inadequate because of changes in conditions, or that the degree of compliance with the policies or procedures may deteriorate. The Company’s management, with the participation of its Chief Executive Officer and Chief Financial Officer, assessed the effectiveness of the Company’s internal control over financial reporting as of December 26, 2009. In making this assessment, the Company’s management used the criteria set forth by the Committee of Sponsoring Organizations of the Treadway Commission in Internal Control—Integrated Framework (the “COSO criteria”). Based on its assessment, management has concluded that, as of December 26, 2009, the Company’s internal control over financial reporting is effective based on the COSO criteria. The effectiveness of the Company’s internal control over financial reporting as of December 26, 2009 has been audited by PricewaterhouseCoopers LLP, an independent registered public accounting firm, as stated in their report, which is set forth in Part II, Item 8 of this Annual Report on Form 10-K. Changes in Internal Control There were no changes in our internal control over financial reporting identified in connection with the evaluation of our controls performed during the quarter ended December 26, 2009 that have materially affected, or are reasonably likely to materially affect, our internal control over financial reporting. Item 9B. Other Information. Not applicable. 107
  • 120.
    PART III Item 10.Directors, Executive Officers and Corporate Governance. Information about our directors and nomination procedures is incorporated by reference to the discussion under the heading “Proposal 1. Election of Directors” and “Corporate Governance and Related Matters” of our Proxy Statement for the 2010 Annual Meeting of Shareholders. Information about compliance with Section 16(a) of the Securities Exchange Act of 1934 is incorporated by reference to the discussion under the heading “Other Matters— Section 16(a) Beneficial Ownership Reporting Compliance” in our Proxy Statement for the 2010 Annual Meeting of Shareholders. Information about our Audit Committee, including the members of the committee and our Audit Committee financial experts, is incorporated by reference to the discussion under the headings “Corporate Governance and Related Matters—Board and Committee Membership” and “Audit Committee Report” in our Proxy Statement for the 2010 Annual Meeting of Shareholders. The balance of the information required by this Item 10 is contained in the discussion entitled “Executive Officers of the Company” in Part I of this Annual Report on Form 10-K. The Company’s Code of Conduct is available on our website at http://www.medcohealth.com. We intend to satisfy the disclosure requirement under Item 5.05 of Form 8-K regarding an amendment to, or waiver from, a provision of our Code of Conduct by posting such information on our website at http://www.medcohealth.com. Item 11. Executive Compensation. Information about director and executive compensation is incorporated by reference to the discussion under the headings “Director Compensation,” “Executive Compensation,” “Compensation Discussion and Analysis,” “Compen- sation Committee Report” and “Corporate Governance and Related Matters—Compensation Committee Interlocks and Insider Participation” in our Proxy Statement for the 2010 Annual Meeting of Shareholders. Item 12. Security Ownership of Certain Beneficial Owners and Management and Related Shareholder Matters. Information required by this item is incorporated by reference to the discussion under the caption “Ownership of Securities” and “Other Matters—Equity Compensation Plan Information” in our Proxy Statement for the 2010 Annual Meeting of Shareholders. Rule 10b5-1 Sales Plans. Medco’s comprehensive compliance program includes a broad policy against insider trading. The procedures promulgated under that policy include regularly scheduled blackout periods that apply to over 600 employees. Executive officers are prohibited from trading in Company stock during the period that begins on the first day of the last month of the fiscal period and ends on the third trading day after the release of earnings. In addition, executive officers are required to pre-clear all of their trades. Medco’s executive officers are also subject to share ownership guidelines and retention requirements. The ownership targets are based on a multiple of salary (5, 3 or 1.5 times salary), but are expressed as a number of shares. The targets are determined using base salary and the closing price of our stock on the date of our Annual Meeting of Shareholders. The number of shares required to be held has been calculated using a $44.38 stock price, the closing price of our stock on the date of the 2009 Annual Meeting of Shareholders. To facilitate compliance with the ownership guidelines and retention requirements, Medco’s Board of Directors authorized the use of prearranged trading plans under Rule 10b5-1 of the Securities Exchange Act of 1934. Rule 10b5-1 permits insiders to adopt predetermined plans for selling specified amounts of stock or exercising stock options under specified conditions and at specified times. Executive officers may only enter into a trading plan during an open trading window and they must not possess material nonpublic information regarding the Company at the time they adopt the plan. Using trading plans, insiders can diversify their investment portfolios while avoiding concerns about transactions occurring at a time when they might possess material nonpublic information. Under Medco’s policy, sales instructions made pursuant to a written trading plan may be executed during a blackout period. In addition, the use of trading plans provides Medco with a greater ability to monitor trading and compliance with its stock ownership guidelines. Generally, under these trading plans, the individual relinquishes control over the transactions once the trading plan is put into place. Accordingly, sales under these plans may occur at any time, including possibly before, simultaneously with, or immediately after significant events involving our company. 108
  • 121.
    All trading plansadopted by Medco executives are reviewed and approved by the Office of the General Counsel. For ease of administration, executives have been permitted to add new orders to existing plans rather than requiring the adoption of a new plan. Once modified, a plan cannot be changed for at least 90 days. Both new plans and modifications are subject to a mandatory “waiting period” designed to safeguard the plans from manipulation or market timing. The following table, which we are providing on a voluntary basis, sets forth the Rule 10b5-1 sales plans entered into by our executive officers in effect as of February 19, 2010(1): Number of Number of Shares Sold Projected Projected Shares to be Sold Under the Beneficial Aggregate Name and Position Under the Plan(2) Timing of Sales Under the Plan Plan(3) Ownership(4) Holdings(5) Gabriel Cappucci 12,136 Option exercise of 0 41,877 93,664 Senior Vice President and 12,136 shares shall occur when Controller, Chief Accounting stock reaches specific prices. Officer John P. Driscoll(6) —(6) See footnote(6). 0 214,888 483,959 President, New Markets Robert S. Epstein 51,440 Option exercise of 0 73,882 335,382 Chief Medical Officer and 51,440 shares shall occur when President, Medco Research stock reaches a specific price. Institute Brian T. Griffin(6) 280,245 Option exercise of 0 53,877 313,816 Group President, Health Plans 268,164 shares shall occur when stock reaches specific prices; sale of 12,081 previously acquired shares shall occur when stock reaches a specific price. See footnote(6). Laizer Kornwasser(6) —(6) See footnote(6). 0 87,789 259,004 President, Liberty Medical and Senior Vice President, Channel and Generic Strategy Karin Princivalle(6) 21,621 Option exercise of 0 99,763 236,015 Senior Vice President, 21,621 shares shall occur when Human Resources stock reaches specific prices. See footnote(6). Timothy C. Wentworth(6) 136,165 Option exercise of 0 49,429 307,548 Group President, 136,165 shares shall occur Employer Accounts when stock reaches specific prices. See footnote(6). (1) This table does not include any trading plans entered into by any executive officer that have been terminated or expired by their terms or have been fully executed through February 19, 2010. (2) This column reflects the number of shares remaining to be sold as of February 19, 2010. (3) This column reflects the number of shares sold under the plan through February 19, 2010. (4) This column reflects an estimate of the number of whole shares each identified executive officer will beneficially own following the sale of all shares under the Rule 10b5-1 sales plans currently in effect. This information reflects the beneficial ownership of our common stock as of February 19, 2010, and includes shares of our com- mon stock subject to options or restricted stock units that were then vested or exercisable and unvested options and restricted stock units that are included in a current trading plan for sales periods that begin after the applica- ble vesting date. Options cannot be exercised and restricted stock units cannot be converted prior to vesting. The estimates reflect option exercises and sales under the plan, but do not reflect any changes to beneficial ownership that may have occurred since February 19, 2010 outside of the plan. 109
  • 122.
    (5) This column reflects an estimate of the total aggregate number of whole shares each identified executive officer will have an interest in following the sale of all shares under the Rule 10b5-1 sales plans currently in effect. This information reflects the beneficial ownership of our common stock as of February 19, 2010, and includes shares of our common stock subject to options (whether or not currently exercisable) or restricted stock units (whether or not vested). Options cannot be exercised and restricted stock units cannot be converted prior to vesting. The estimates reflect option exercises and sales under the plan, but do not reflect any changes to beneficial ownership that may have occurred since February 19, 2010 outside of the plan. (6) The trading plans for Mr. Driscoll, Mr. Griffin, Mr. Kornwasser, Ms. Princivalle and Mr. Wentworth also cover 100 percent of the net shares that will be delivered upon the vesting of the individual’s restricted stock unit granted on February 23, 2007, after the payment of withholding taxes and provided the stock reaches a specific price. The exact number of shares will be determined on the vesting date. As a result, the shares are not reflected in this table. Certain directors who have served on the Board since Medco became a publicly traded company in August 2003 entered into Rule 10b5-1 sales plans to diversify a portion of their holdings in Company common stock. The following table, which we are providing on a voluntary basis, sets forth the Rule 10b5-1 sales plans entered into by our directors in effect as of February 19, 2010(1): Number of Number of Shares Sold Projected Projected Shares to be Sold Under the Beneficial Aggregate Name and Position Under the Plan(2) Timing of Sales Under the Plan Plan(3) Ownership(4) Holdings(5) John L. Cassis 16,000 Option exercise of 16,000 shares shall occur 0 73,900 83,900 when stock reaches specific price. Michael Goldstein 16,000 Option exercise of 16,000 shares shall occur 0 50,090 60,090 when stock reaches specific price. (1) This table does not include any trading plans entered into by any director that have been terminated or expired by their terms or have been fully executed through February 19, 2010. (2) This column reflects the number of shares remaining to be sold as of February 19, 2010. (3) This column reflects the number of shares sold under the plan through February 19, 2010. (4) This column reflects an estimate of the number of whole shares each identified director will beneficially own fol- lowing the sale of all shares under the Rule 10b5-1 sales plans currently in effect. This information reflects the beneficial ownership of our common stock as of February 19, 2010, and includes shares of our common stock subject to options or restricted stock units that were then vested or exercisable and unvested options and restricted stock units that are included in a current trading plan for sales periods that begin after the applicable vesting date. Options cannot be exercised and restricted stock units cannot be converted prior to vesting. The esti- mates reflect option exercises and sales under the plan, but do not reflect any changes to beneficial ownership that may have occurred since February 19, 2010 outside of the plan. (5) This column reflects an estimate of the total aggregate number of whole shares each identified director will have an interest in following the sale of all shares under the Rule 10b5-1 sales plans currently in effect. This informa- tion reflects the beneficial ownership of our common stock as of February 19, 2010, and includes shares of our common stock subject to options (whether or not currently exercisable) or restricted stock units (whether or not vested). Options cannot be exercised and restricted stock units cannot be converted prior to vesting. The estimates reflect option exercises and sales under the plan, but do not reflect any changes to beneficial ownership that may have occurred since February 19, 2010 outside of the plan. Item 13. Certain Relationships and Related Transactions, and Director Independence. Information required by this item is incorporated by reference to the discussions under the captions “Transac- tions with Related Persons” and “Corporate Governance and Related Matters—Director Independence,” in our Proxy Statement for the 2010 Annual Meeting of Shareholders. Item 14. Principal Accounting Fees and Services. Information about the fees for 2009 and 2008 for professional services rendered by our independent registered public accounting firm is incorporated by reference to the discussion under the heading “Proposal 2. Ratification of Independent Registered Public Accounting Firm” of our Proxy Statement for the 2010 Annual Meeting of Shareholders. Our Audit Committee’s policy on pre-approval of audit and permissible non-audit services of our independent auditors is incorporated by reference to the discussion under the heading “Proposal 2. Ratification of Independent Registered Public Accounting Firm” of our Proxy Statement for the 2010 Annual Meeting of Shareholders. 110
  • 123.
    PART IV Item 15.Exhibits, Financial Statement Schedules. (a) The following documents are filed as part of this report: (1) Financial Statements. The following financial statements are filed as part of this report under Item 8, “Financial Statements and Supplementary Data”: Report of Independent Registered Public Accounting Firm Consolidated Balance Sheets as of December 26, 2009 and December 27, 2008 Consolidated Statements of Income for the Years Ended December 26, 2009, December 27, 2008 and December 29, 2007 Consolidated Statements of Stockholders’ Equity for the Years Ended December 29, 2007, December 27, 2008 and December 26, 2009 Consolidated Statements of Cash Flows for the Years Ended December 26, 2009, December 27, 2008 and December 29, 2007 Notes to Consolidated Financial Statements (2) Financial Statement Schedule: Schedule II—Valuation and Qualifying Accounts All other schedules are omitted as the required information is inapplicable or the information is presented in the consolidated financial statements and notes thereto in Item 8 above. (3) Exhibits: Exhibit Number Exhibit Description 3.1 Third Amended and Restated Certificate of Incorporation of Medco Health Solutions, Inc. as of May 22, 2008. Incorporated by reference to Exhibit 3.1 to the Registrant’s Current Report on Form 8-K filed May 23, 2008. 3.2 Amended and Restated Bylaws of Medco Health Solutions, Inc. as of December 10, 2008. Incorporated by reference to Exhibit 3.1 to the Registrant’s Current Report on Form 8-K filed December 11, 2008. 4.1 Form of Medco Health Solutions, Inc. common stock certificate. Incorporated by reference to Exhibit 4.1 to the Registrant’s Amendment No. 3 to Form 10, File No. 1-31312, filed July 25, 2003. 4.2 Indenture between the Registrant and U.S. Bank Trust National Association, as Trustee, relating to the Registrant’s senior notes due 2013. Incorporated by reference to Exhibit 4.2 to the Registrant’s Annual Report on Form 10-K for the fiscal year ended December 27, 2003, File No. 001-31312. 111
  • 124.
    Exhibit Number Exhibit Description 4.3 Indenture between the Registrant and U.S. Bank Trust National Association, as Trustee, relating to the Registrant’s senior notes due 2018. Incorporated by reference to Exhibit 4.3 to the Registrant’s Current Report on Form 8-K filed March 18, 2008. 10.1 Credit Agreement, dated as of April 30, 2007, among the Registrant, the lenders party thereto and Bank of America, N.A., as administrative agent and Citicorp North America, Inc. and JPMorgan Chase Bank, N.A., as Co-Syndication Agents. Incorporated by reference to Exhibit 10.1 to the Registrant’s Quarterly Report on Form 10-Q filed May 2, 2007. 10.2 Second Amended and Restated Receivables Purchase Agreement dated July 28, 2008, among Medco Health Receivables, LLC, the financial institutions and commercial paper conduits party thereto and Citicorp North America, Inc., as administrative agent. Incorporated by reference to Exhibit 10.3 to the Registrant’s Annual Report on Form 10-K filed February 24, 2009. 10.3* Amendment No. 1 dated July 27, 2009 to Second Amended and Restated Receivables Purchase Agreement dated July 28, 2008, among Medco Health Receivables, LLC, the financial institutions and commercial paper conduits party thereto and Citicorp North America, Inc., as administrative agent. 10.4† Medco Health Solutions, Inc. 2002 Stock Incentive Plan, as amended. Incorporated by reference to Exhibit 10.1 to the Registrant’s Quarterly Report on Form 10-Q filed July 29, 2005. 10.5† Medco Health Solutions, Inc. 2006 Executive Severance Plan. Incorporated by reference to Exhibit 10.1 to the Registrant’s Current Report on Form 8-K filed February 7, 2006. 10.6† Medco Health Solutions, Inc. 2006 Change in Control Executive Severance Plan. Incorporated by reference to Exhibit 10.2 to the Registrant’s Current Report on Form 8-K filed February 7, 2006. 10.7 Indemnification and Insurance Matters Agreement between Merck & Co., Inc. and the Registrant. Incorporated by reference to Exhibit 10.4 to the Registrant’s Annual Report on Form 10-K for the fiscal year ended December 27, 2003, File No. 001-31312. 10.8 Tax Responsibility Allocation Agreement, dated as of August 12, 2003, between Merck & Co., Inc. and the Registrant. Incorporated by reference to Exhibit 10.5 to the Registrant’s Annual Report on Form 10-K for the fiscal year ended December 27, 2003, File No. 001-31312. 10.9† Employment Agreement with David B. Snow, Jr., dated as of February 10, 2009. Incorporated by reference to Exhibit 10.1 to the Registrant’s Current Report on Form 8-K filed February 13, 2009. 10.10*† Assignment and Assumption Agreement, dated as of December 27, 2009 to the February 10, 2009 Employment Agreement with David B. Snow, Jr. 10.11† Medco Health Solutions, Inc. Executive Annual Incentive Plan. Incorporated by reference to Exhibit 10.1 to the Registrant’s Current Report on Form 8-K, filed February 8, 2005, File No. 001-31312. 112
  • 125.
    Exhibit Number Exhibit Description 10.12† Performance Goals for 2010 under the Registrant’s Executive Annual Incentive Plan. Incorporated by reference to the Registrant’s Current Report on Form 8-K filed January 29, 2010. 10.13† Form of terms and conditions for director stock option and restricted stock unit awards. Incorporated by reference to Exhibit 10.2 to the Registrant’s Current Report on Form 8-K, filed February 8, 2005, File No. 001-31312. 10.14† Accredo Health, Incorporated 2002 Long-Term Incentive Plan. Incorporated by reference to Exhibit 10.3 of the Registrant’s Current Report on Form 8-K filed August 24, 2005. 10.15† Form of terms and conditions of the 2008 Restricted Stock Unit Grants under the Medco Health Solutions, Inc. 2002 Stock Incentive Plan. Incorporated by reference to Exhibit 10.22 to the Registrant’s Annual Report on Form 10-K filed February 19, 2008. 10.16† Form of terms and conditions of 2008 Non-Qualified Stock Option Grants under the Medco Health Solutions, Inc. 2002 Stock Incentive Plan. Incorporated by reference to Exhibit 10.23 to the Registrant’s Annual Report on Form 10-K filed February 19, 2008. 10.17† Medco Health Solutions, Inc. Deferred Compensation Plan for Directors. Incorporated by reference to Exhibit 10.24 to the Registrant’s Annual Report on Form 10-K filed February 19, 2008. 10.18 Settlement Agreement and Mutual Releases, dated as of October 23, 2006, entered into by and among the United States of America, acting through the United States Department of Justice, on behalf of the Office of the Inspector General of the Department of Health and Human Services, the Office of Personnel Management, and the Department of Defense TRICARE Management Activity; Medco Health Solutions, Inc.; Diane M. Collins; and relators George Bradford Hunt, Walter William Gauger and Joseph Piacentile. Incorporated by reference to Exhibit 10.1 to the Registrant’s Current Report on Form 8-K filed October 27, 2006. 10.19 Settlement Agreement and Mutual Releases, dated as of October 23, 2006, entered into by and among the United States of America, acting through the United States Department of Justice, on behalf of the Office of the Inspector General of the Department of Health and Human Services and the Office of Personnel Management; Medco Health Solutions, Inc.; and relator Karl S. Schumann. Incorporated by reference to Exhibit 10.2 to the Registrant’s Current Report on Form 8-K filed October 27, 2006. 10.20 Settlement Agreement and Mutual Releases, dated as of October 23, 2006, entered into by and among the United States of America, acting through the United States Department of Justice, on behalf of the Office of the Inspector General of the Department of Health and Human Services and Medco Health Solutions, Inc. Incorporated by reference to Exhibit 10.3 to the Registrant’s Current Report on Form 8-K filed October 27, 2006. 10.21 Corporate Integrity Agreement, dated as of October 23, 2006, between the Office of the Inspector General of the Department of Health and Human Services and the Office of the Inspector General of the Office of Personnel Management and Medco Health Solutions, Inc. Incorporated by reference to Exhibit 10.4 to the Registrant’s Current Report on Form 8-K filed October 27, 2006. 12.1* Statement of Consolidated Ratios of Earnings to Fixed Charges. 21.1* List of Subsidiaries. 23.1* Consent of PricewaterhouseCoopers LLP, dated February 23, 2010. 113
  • 126.
    Exhibit Number Exhibit Description 31.1* Certification of Chief Executive Officer pursuant to Section 302 of the Sarbanes-Oxley Act of 2002. 31.2* Certification of Chief Financial Officer pursuant to Section 302 of the Sarbanes-Oxley Act of 2002. 32.1** Certification of Chief Executive Officer pursuant to 18 U.S.C. Section 1350, as adopted pursuant to Section 906 of the Sarbanes-Oxley Act of 2002. 32.2** Certification of Chief Financial Officer pursuant to 18 U.S.C. Section 1350, as adopted pursuant to Section 906 of the Sarbanes-Oxley Act of 2002. 101.INS** XBRL Instance Document. 101.SCH** XBRL Taxonomy Extension Schema. 101.CAL** XBRL Taxonomy Extension Calculation Linkbase. 101.DEF** XBRL Taxonomy Extension Definition Linkbase. 101.LAB** XBRL Taxonomy Extension Label Linkbase. 101.PRE** XBRL Taxonomy Extension Presentation Linkbase. † Management contract or compensatory plan or arrangement * Filed herewith ** Furnished herewith 114
  • 127.
    MEDCO HEALTH SOLUTIONS,INC. SCHEDULE II VALUATION AND QUALIFYING ACCOUNTS ($ in millions) Allowance for Doubtful Accounts Receivable: Balance at Beginning Balance at of Period Other Provision Write-offs(1) End of Period Fiscal Year Ended December 26, 2009 . . . . . . . . . . . . . $120.0 $ 0.2 $133.1 $(120.0) $133.3 Fiscal Year Ended December 27, 2008 . . . . . . . . . . . . . $130.0 $ 1.0 $ 91.8 $(102.8) $120.0 (2) Fiscal Year Ended December 29, 2007 . . . . . . . . . . . . . $ 81.8 $41.2 $ 61.9 $ (54.9) $130.0 (1) Uncollectible accounts, net of recoveries. (2) Primarily represents balances acquired as a result of the PolyMedica and Critical Care acquisitions. 115
  • 128.
    Signatures Pursuant to therequirements of Section 13 or 15(d) of the Securities Exchange Act of 1934, the Registrant has duly caused this report to be signed on its behalf by the undersigned, thereunto duly authorized. Medco Health Solutions, Inc. /s/ David B. Snow, Jr. Name: David B. Snow, Jr. Title: Chairman and Chief Executive Officer Date: February 23, 2010 Pursuant to the requirements of the Securities Exchange Act of 1934, this report has been signed below by the following persons on behalf of the Registrant and in the capacities and on the dates indicated. Dated: February 23, 2010 /s/ David B. Snow, Jr. Name: David B. Snow, Jr. Title: Chairman and Chief Executive Officer Dated: February 23, 2010 /s/ Richard J. Rubino, CPA Name: Richard J. Rubino, CPA Title: Senior Vice President, Finance and Chief Financial Officer Dated: February 23, 2010 /s/ Gabriel R. Cappucci, CPA Name: Gabriel R. Cappucci, CPA Title: Senior Vice President and Controller, Chief Accounting Officer Dated: February 23, 2010 /s/ Howard W. Barker, Jr., CPA Name: Howard W. Barker, Jr., CPA Title: Director Dated: February 23, 2010 /s/ John L. Cassis Name: John L. Cassis Title: Director Dated: February 23, 2010 /s/ Michael Goldstein, CPA Name: Michael Goldstein, CPA Title: Director Dated: February 23, 2010 /s/ Charles M. Lillis, Ph.D. Name: Charles M. Lillis, Ph.D. Title: Director 116
  • 129.
    Dated: February 23,2010 /s/ Myrtle S. Potter Name: Myrtle S. Potter Title: Director Dated: February 23, 2010 /s/ William L. Roper, M.D., M.P.H. Name: William L. Roper, M.D., M.P.H. Title: Director Dated: February 23, 2010 /s/ David D. Stevens Name: David D. Stevens Title: Director Dated: February 23, 2010 /s/ Blenda J. Wilson, Ph.D. Name: Blenda J. Wilson, Ph.D. Title: Director 117
  • 130.
  • 131.
    INVESTOR INFORMATION BOARD OFDIRECTORS EXECUTIVE OFFICERS David B. Snow, Jr. William L. Roper, M.D., M.P.H.3, 5 David B. Snow, Jr. Laizer D. Kornwasser Chairman and Chief Executive Officer, Dean of the School of Medicine at the Chairman and President, Medco Health Solutions, Inc. University of North Carolina (UNC), Chief Executive Officer Liberty Medical and Vice Chancellor for Medical Affairs, Senior Vice President, Howard W. Barker, Jr., CPA1,2,4 and Chief Executive Officer, Kenneth O. Klepper Channel and Generic Strategy Partner (Retired), KPMG LLP UNC Health Care System President and Chief Operating Officer Thomas M. Moriarty John L. Cassis1,2,4 David D. Stevens1, 4, 5 General Counsel, Secretary and Partner, Cross Atlantic Partners, Inc. Private investor and former Chairman Gabriel R. Cappucci, CPA Senior Vice President, and Chief Executive Officer, Senior Vice President and Controller, Pharmaceutical Strategies and Michael Goldstein, CPA1,3,4 Accredo Health, Incorporated Chief Accounting Officer Solutions Former Chairman and Chief Executive Karin V. Princivalle Officer, Toys “R” Us Blenda J. Wilson, Ph.D.3, 5 Mary T. Daschner Senior Vice President, Consultant and former President, Group President, Human Resources Charles M. Lillis, Ph.D.2,4 Nellie Mae Education Foundation Retiree Solutions Managing Partner, Richard J. Rubino, CPA 1 LoneTree Capital Management LLC and Audit Committee John P. Driscoll Senior Vice President, Finance former Chairman and Chief Executive (Howard W. Barker, Jr., CPA, Chairman) President, and Chief Financial Officer Officer, MediaOne Group, Inc. 2 New Markets Compensation Committee (John L. Cassis, Chairman) Jack A. Smith 2, 5 Myrtle Potter Robert S. Epstein, M.D., M.S. Senior Vice President, Consultant and former 3 Corporate Governance and Chief Medical Officer and Chief Marketing Officer Chief Operating Officer, Nominating Committee President, Medco Research Institute Genentech, Inc. (Michael Goldstein, CPA, Chairman) Glenn C. Taylor Steven R. Fitzpatrick Group President, 4 Mergers and Acquisitions Committee President, Accredo Health Group, Inc. Key Accounts 5 Public Policy Committee (William L. Roper, Brian T. Griffin Timothy C. Wentworth Chairman) Group President, Group President, Health Plans Employer Accounts On June 17, 2009, David B. Snow, Jr., Chairman and Chief Executive Officer, submitted to the NYSE the Written Affirmation required by the rules of the NYSE certifying that he was not aware of any violations by Medco of NYSE Corporate Governance listing standards. The certifications of Mr. Snow and Mr. Rubino, Senior Vice President, Finance and Chief Financial Officer, made pursuant to Section 302 of the Sarbanes-Oxley Act of 2002 regarding the quality of Medco’s public disclosure, have been filed as exhibits to Medco’s Annual Report on Form 10-K for the fiscal year ended December 26, 2009. SHAREHOLDER INFORMATION Transfer Agent and Registrar Corporate Headquarters Independent Registered Public Accounting Firm Wells Fargo Shareowner Services Medco Health Solutions, Inc. PricewaterhouseCoopers LLP P.O. Box 64874 100 Parsons Pond Drive Florham Park, NJ 07932 St. Paul, MN 55164-0874 Franklin Lakes, NJ 07417-2603 1 866 808-8310 1 201 269-3400 Shareholder Information 1 651 554-3957 (Outside the United States) www.medcohealth.com Medco’s Corporate Governance Guidelines; Standards 1 651 450-4144 (Hearing-Impaired TDD Phone) of Business Conduct; Code of Conduct; Conflict of www.wellsfargo.com/shareownerservices Common Stock Interest; Safety, Health and Environmental Policy; Medco’s common stock is listed on the New York Audit, Compensation, Corporate Governance and Investor Inquiries Stock Exchange under the ticker symbol MHS. Nominating and Public Policy Committee charters; 1 866 MHS-NEWS (1 866 647-6397) On March 12, 2010, the closing market price of our and the reports and registration statements it files 1 678 999-4574 (Outside the United States) common stock on the NYSE was $64.70 and there with the Securities and Exchange Commission are investor_relations@medco.com were 78,417 shareholders of record. posted on Medco’s website at www.medcohealth.com/investor. Shareholders may Annual Meeting Dividends receive, free of charge, printed copies of these Medco’s 2010 Annual Meeting of Medco currently does not pay dividends and does documents, including Medco’s 2009 Annual Report on Shareholders will be held on May 12, 2010, not plan to pay dividends in the foreseeable future. Form 10-K, by contacting Medco Health Solutions, Inc., at 9:00 a.m. at the Park Ridge Marriott, 100 Parsons Pond Drive, Franklin Lakes, NJ 07417-2603, Park Ridge, NJ. Attention: Investor Relations. All rights in the product names, trade names, or logos of all third-party products appearing in this annual report, whether or not appearing with the trademark symbol, belong exclusively to their respective owners.
  • 132.
    www.medco.com To minimize ourenvironmental impact, this annual report t was printed on paper with 10 percent post-consumer fiber, which accounted for the following savings: • 26 trees were not harvested • 8 million BTUs of energy (the equivalent of operating one home for 1 month) were saved • 2,400 pounds of carbon dioxide (the equivalent of driving an average car for 82 days) were not released into the atmosphere • 11,800 gallons of water were not used The f facility printing the report purchases 100 percent renewable, Green- Green-e certified wind energy and is a Leadership Club member of the EPA Green Power Partnership. Medco and Medco Therapeutic Resource Centers are registered trademarks and Making Medicine Smarter, Medco Making Medicine Smarter, Medco Medc Medco Pharmacy, Medc Health Store, Medco Foundation, Medco Research Institute, and Genetics for Generics are trademarks of Medco Health Solutions, Inc. Medco , © 2010 Medco Health Solutions, Inc. All rights reserved. Medco Solutions, Inc.