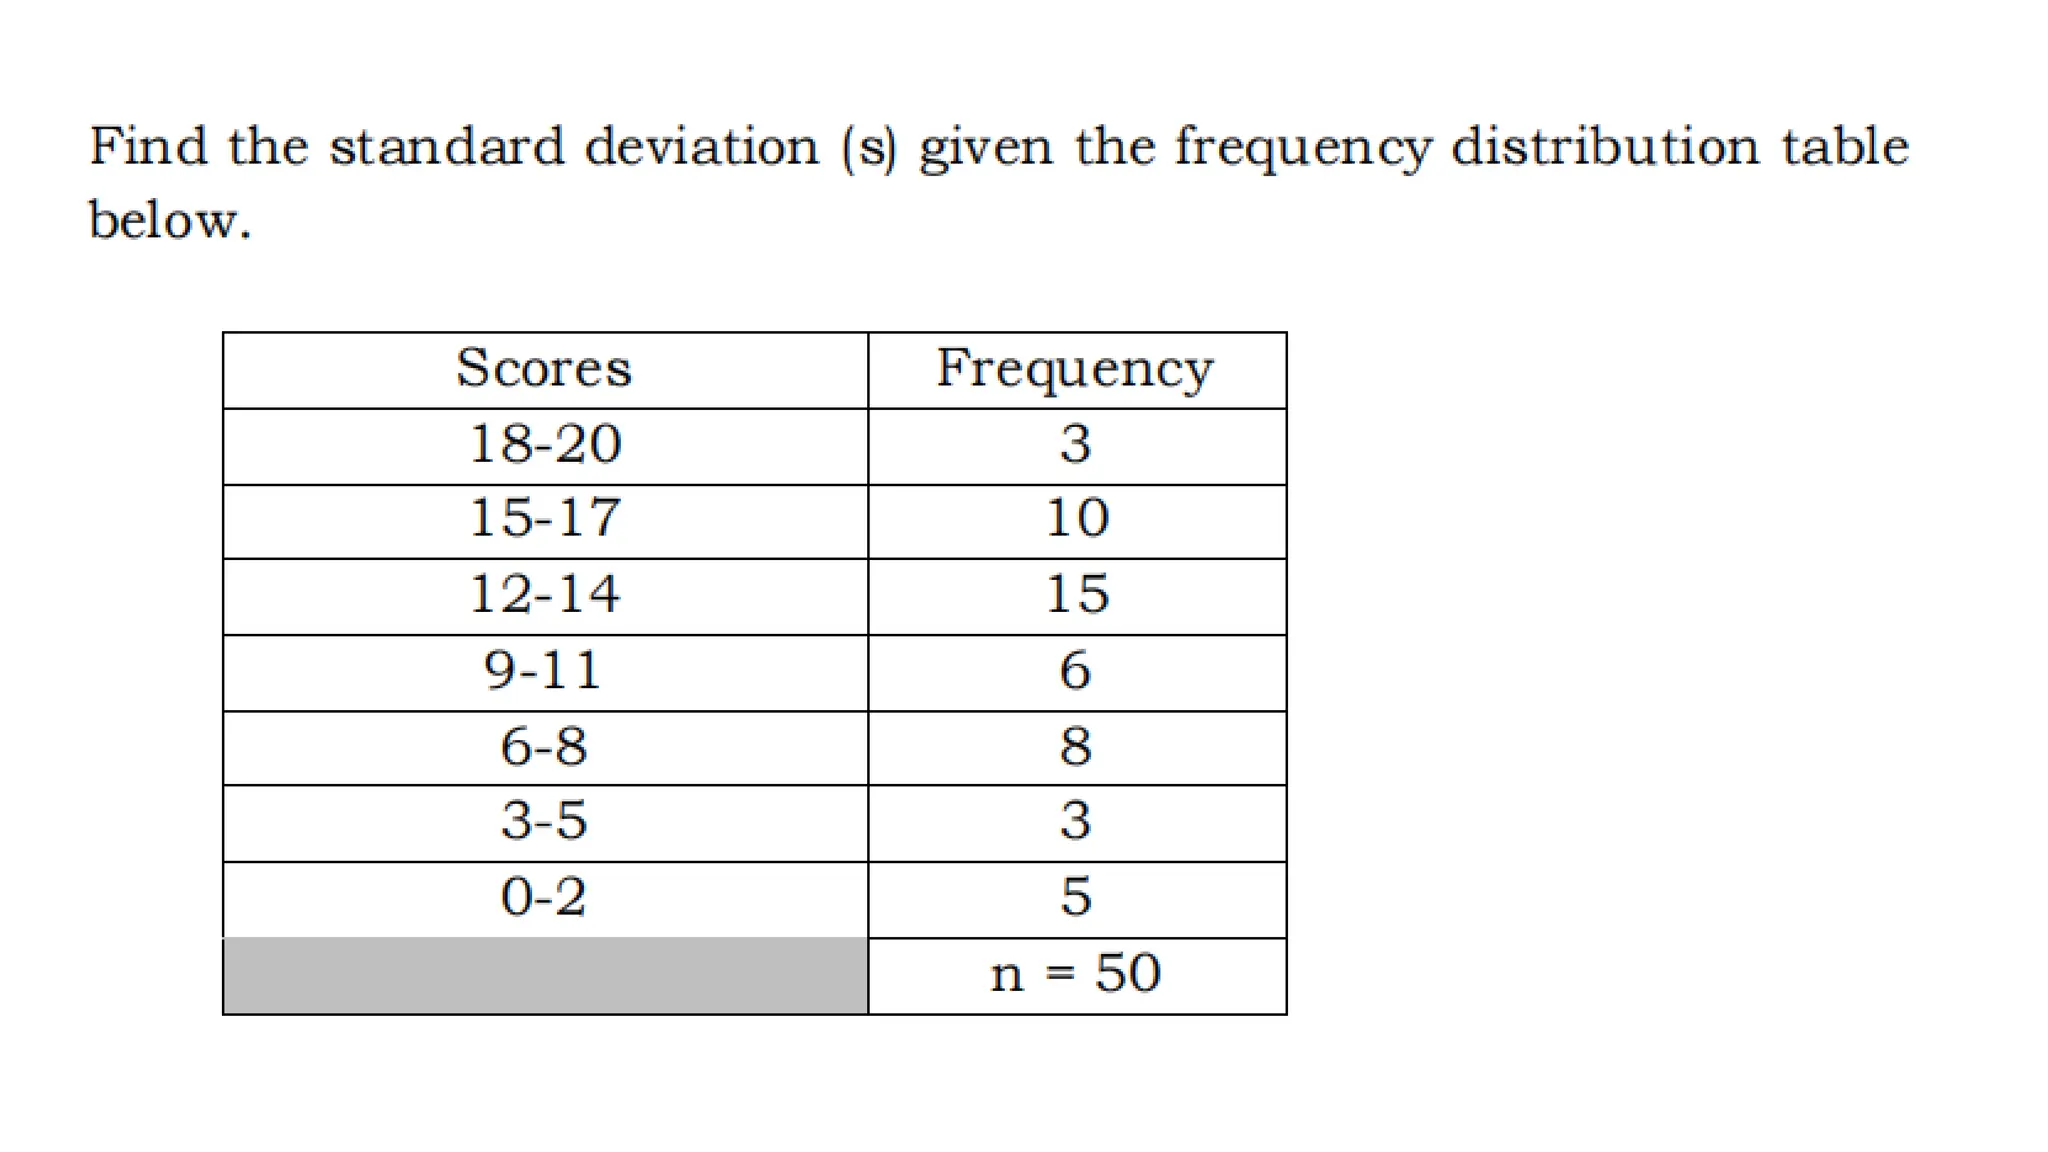
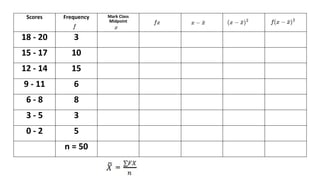
Scores Frequency Mark Class
Midpoint
18 - 20 3
15 - 17 10
12 - 14 15
9 - 11 6
6 - 8 8
3 - 5 3
0 - 2 5
n = 50
Measures of variability Mathematics 10 activity

Measures of variability Mathematics 10 activity

  • 2.
    Scores Frequency MarkClass Midpoint 18 - 20 3 15 - 17 10 12 - 14 15 9 - 11 6 6 - 8 8 3 - 5 3 0 - 2 5 n = 50

Editor's Notes

  • #2 Step 1: Compute for the mean Step 2. Compute the required data in the table. Step 3. Use and apply the formula of variance and standard deviation.