1. 1
Chapter 1
Introduction to Managerial Economics
What Is Managerial Economics?
One standard definition for economics is the study of the production, distribution, and
consumption of goods and services. A second definition is the study of choice related to
the allocation of scarce resources. The first definition indicates that economics includes
any business, nonprofit organization, or administrative unit. The second definition
establishes that economics is at the core of what managers of these organizations do.
This book presents economic concepts and principles from the perspective of
“managerial economics,” which is a subfield of economics that places special emphasis
on the choice aspect in the second definition. The purpose of managerial economics is
to provide economic terminology and reasoning for the improvement of managerial
decisions.
Most readers will be familiar with two different conceptual approaches to the study of
economics: microeconomics and macroeconomics. Microeconomics studies
phenomena related to goods and services from the perspective of individual decision-
making entities—that is, households and businesses. Macroeconomics approaches the
same phenomena at an aggregate level, for example, the total consumption and
production of a region. Microeconomics and macroeconomics each have their merits.
The microeconomic approach is essential for understanding the behavior of atomic
entities in an economy. However, understanding the systematic interaction of the many
households and businesses would be too complex to derive from descriptions of the
individual units. The macroeconomic approach provides measures and theories to
understand the overall systematic behavior of an economy.
Since the purpose of managerial economics is to apply economics for the improvement
of managerial decisions in an organization, most of the subject material in managerial
economics has a microeconomic focus. However, since managers must consider the
state of their environment in making decisions and the environment includes the overall
2. 2
economy, an understanding of how to interpret and forecast macroeconomic measures
is useful in making managerial decisions.
1.1 Why Managerial Economics Is Relevant for Managers
In a civilized society, we rely on others in the society to produce and distribute nearly all
the goods and services we need. However, the sources of those goods and services are
usually not other individuals but organizations created for the explicit purpose of
producing and distributing goods and services. Nearly every organization in our
society—whether it is a business, nonprofit entity, or governmental unit—can be viewed
as providing a set of goods, services, or both. The responsibility for overseeing and
making decisions for these organizations is the role of executives and managers.
Most readers will readily acknowledge that the subject matter of economics applies to
their organizations and to their roles as managers. However, some readers may question
whether their own understanding of economics is essential, just as they may recognize
that physical sciences like chemistry and physics are at work in their lives but have
determined they can function successfully without a deep understanding of those
subjects.
Whether or not the readers are skeptical about the need to study and understand
economics per se, most will recognize the value of studying applied business disciplines
like marketing, production/operations management, finance, and business strategy.
These subjects form the core of the curriculum for most academic business and
management programs, and most managers can readily describe their role in their
organization in terms of one or more of these applied subjects. A careful examination of
the literature for any of these subjects will reveal that economics provides key
terminology and a theoretical foundation. Although we can apply techniques from
marketing, production/operations management, and finance without understanding the
underlying economics, anyone who wants to understand the why and how behind the
technique needs to appreciate the economic rationale for the technique.
3. 3
We live in a world with scarce resources, which is why economics is a practical science.
We cannot have everything we want. Further, others want the same scarce resources
we want. Organizations that provide goods and services will survive and thrive only if
they meet the needs for which they were created and do so effectively. Since the
organization’s customers also have limited resources, they will not allocate their scarce
resources to acquire something of little or no value. And even if the goods or services
are of value, when another organization can meet the same need with a more favorable
exchange for the customer, the customer will shift to the other supplier. Put another way,
the organization must create value for their customers, which is the difference between
what they acquire and what they produce. The thesis of this book is that those managers
who understand economics have a competitive advantage in creating value.
1.2 Managerial Economics Is Applicable to Different Types of Organizations
In this book, the organization providing goods and services will often be called
a “business” or a “firm,” terms that connote a for-profit organization. And in some portions
of the book, we discuss principles that presume the underlying goal of the organization
is to create profit. However, managerial economics is relevant to nonprofit organizations
and government agencies as well as conventional, for-profit businesses. Although the
underlying objective may change based on the type of organization, all these
organizational types exist for the purpose of creating goods or services for persons or
other organizations.
Managerial economics also addresses another class of manager: the regulator. As we
will discuss in Chapter 8 "Market Regulation", the economic exchanges that result from
organizations and persons trying to achieve their individual objectives may not result in
the best overall pattern of exchange unless there is some regulatory guidance.
Economics provides a framework for analyzing regulation, both the effect on decision
making by the regulated entities and the policy decisions of the regulator.
1.3 The Focus of This Book
4. 4
The intent of this book is to familiarize the reader with the key concepts, terminology,
and principles from managerial economics. After reading the text, you should have a
richer appreciation of your environment—your customers, your suppliers, your
competitors, and your regulators. You will learn principles that should improve your
intuition and your managerial decisions. You will also be able to communicate more
effectively with your colleagues and with expert consultants.
As with much of microeconomic theory, many of the economic principles in this book
were originally derived with the help of mathematics and abstract models based on logic
and algebra. In this book, the focus is on the insights gained from these principles, not
the derivation of the principles, so only a modest level of mathematics is employed here
and an understanding of basic algebra will suffice. We will consider some key economic
models of managerial decision making, but these will be presented either verbally,
graphically, or with simple mathematical representations. For readers who are interested
in a more rigorous treatment, the reference list at the conclusion of this text includes
several books that will provide more detail. Alternatively, a web search using one of the
terms from this book will generally yield several useful links for further exploration of a
concept.
A note about economic models is that models are simplified representations of a real-
world organization and its environment. Some aspects of the real-world setting are not
addressed, and even those aspects that are addressed are simplifications of any actual
setting being represented. The point of using models is not to match the actual setting
in every detail, but to capture the essential aspects so determinations can be made
quickly and with a modest cost. Models are effective when they help us understand the
complex and uncertain environment and proceed to appropriate action.
5. 5
Chapter 2
Key Measures and Relationships
A Simple Business Venture
In this chapter we will be covering some of the key measures and relationships of a
business operation. To help illustrate these concepts, we will consider the following
simple business venture opportunity.
Suppose three students like spending time at the beach. They have pondered whether
they could work and live at the beach during their summer break and learned that they
could lease a small building by the beach with existing freezer capacity and apply for a
local license to sell ice cream bars.
2.1 Revenue, Cost, and Profit
Most businesses sell something—either a physical commodity like an ice cream bar or
a service like a car repair. In a modern economy, that sale is made in return for money
or at least is evaluated in monetary terms. The total monetary value of the goods or
services sold is called revenue.
Few businesses are able to sell something without incurring expenses to make the sale
possible. The collective expenses incurred to generate revenue over a period of time,
expressed in terms of monetary value, are the cost. Some cost elements are related to
the volume of sales; that is, as sales go up, the expenses go up. These costs are
called variable costs. The cost of raw materials used to make an item of clothing would
be an example of a variable cost. Other costs are largely invariant to the volume of sales,
at least within a certain range of sales volumes. These costs are called fixed costs. The
cost of a machine for cutting cloth to make an item of clothing would be a fixed cost.
Businesses are viable on a sustained basis only when the revenue generated by the
business generally exceeds the cost incurred in operating the business. The difference
6. 6
between the revenue and cost (found by subtracting the cost from the revenue) is called
the profit. When costs exceed revenue, there is a negative profit, or loss.
The students in our simple venture realize they need to determine whether they can
make a profit from a summer ice cream bar business. They met the person who operated
an ice cream bar business in this building the previous summer. He told them last
summer he charged $1.50 per ice cream bar and sold 36,000 ice cream bars. He said
the cost of the ice cream bars—wholesale purchase, delivery, storage, and so on—
comes to about $0.30 per bar. He indicated his other main costs—leasing the building,
license, local business association fee, and insurance—came to about $16,000.
Based on this limited information, the students could determine a rough estimate of the
revenue, costs, and profit they would have if they were to repeat the outcomes for the
prior operator. The revenue would be $1.50 per ice cream bar times 36,000 ice cream
bars, or $54,000. The variable cost would be $0.30 per ice cream bar times 36,000 ice
cream bars, or $10,800. The fixed cost would be $16,000, making the total cost $26,800.
The profit would be $54,000 minus $26,800, or $27,200.
Based on this analysis, the students are confident the summer business venture can
make money. They approach the owner of the building and learn that if they want to
reserve the right of first option to lease the building over the summer, they will need to
make a nonrefundable $6000 deposit that will be applied to the lease. They proceeded
to make that deposit.
A few weeks later, all three students were unexpectedly offered summer business
internships at a large corporation. Each student would earn $10,000. However, the work
site for the internships is far from the beach and they would be in an office all day. They
now must decide whether to accept the internships and terminate their plan to run a
business at the beach or turn down the internships.
2.2 Economic Versus Accounting Measures of Cost and Profit
7. 7
The discipline of accounting provides guidelines for the measurement of revenue, cost,
and profit. Having analyses based on generally accepted principles is important for
making exchanges in our economy. For example, corporations must produce financial
statements to help investors and creditors assess the health of the corporation.
Individuals and businesses must produce tax returns to determine a fair measurement
of income for taxation purposes.
Costs as measured according to accounting principles are not necessarily the relevant
measurements for decisions related to operating or acquiring a business. For example,
accounting standards dictate that businesses depreciate long-lived assets, like buildings,
by spreading the cost over the life of the asset.The particulars on depreciation can be
found in any financial accounting text. However, from the perspective of the business,
the entire expense was incurred when the asset was acquired, even if borrowing was
necessary to make the purchase and there will be the opportunity to take increased tax
deductions in future years.
Likewise, there are other business costs relevant to decision making that may not be
considered as costs from the perspective of accounting standards. For example, the
owner/operator of a proprietorship invests time and effort in operating a business. These
would typically not be treated as expenses on the proprietorship’s tax return but are
certainly relevant to the owner in deciding how to manage his self-run business.
Based on these differences in perspective, it is useful to distinguish accounting
costs from economic costs. In turn, since profit is the residue of revenue minus costs,
we also distinguish accounting profit from economic profit.
Consider our three students who are now in a quandary about whether to sell ice cream
bars on the beach or accept the summer internships, and let us see how distinguishing
the economic cost/profit from the accounting cost/profit helps to clarify their decision.
There is the matter of the students’ time and energy, which is not reflected in the
projection of the $27,200 profit based on last year’s operation. One way to measure that
cost is based on how much they will forfeit by not using their time in the next best
8. 8
alternative, which in this case is the summer internship. We can consider this forfeited
income as being equivalent to a charge against the operation of the ice cream business,
a measurement commonly referred to as an opportunity cost. The students’ time has an
opportunity cost of $30,000. This should be added to the earlier fixed cost of $16,000,
making an economic fixed cost of $46,000, a total economic cost of $56,800, and an
economic loss of $2800. So maybe the ice cream business would not be a good idea
after all.
However, recall that the students have already made a $6000 nonrefundable deposit.
This money is spent whether the students proceed to run the summer business or not.
It is an example of what is called a sunk cost. Assuming the fixed cost of the business
was the same as for the prior operator, the students would have a $16,000 accounting
fixed cost to report on a tax return. Yet, from the perspective of economic costs, only
$10,000 is really still avoidable by not operating the business. The remaining $6000 is
gone regardless of what the students decide. So, from an economic cost/profit
perspective, viewed after the nonrefundable deposit but before the students declined the
summer internships, if the students’ other costs and revenue were identical to the
previous year, they would have economic costs of just $50,800 and an economic profit
of $3200.
If a business properly measures costs from an economic perspective, ignoring sunk
costs and including opportunity costs, you can conclude that a venture is worth pursuing
if it results in an economic profit of zero or better. However, this is generally not a valid
principle if you measure performance in terms of accounting profit. Most stockholders in
a corporation would not be satisfied if the corporation only managed a zero accounting
profit because this means there is no residual from the business to reward them with
either dividends or increased stock value. From an economic cost perspective,
stockholder capital is an asset that can be redeployed, and thus it has an opportunity
cost—namely, what the investor could earn elsewhere with their share of the corporation
in a different investment of equivalent risk.Readers interested in estimating the
opportunity cost of investment capital are encouraged to consult a general text in
financial analysis, such as Brigham and Ehrhardt (2010). This opportunity cost could be
9. 9
estimated and included in the economic cost. If the resulting profit is zero or positive after
netting out the opportunity cost of capital, the investor’s participation is worthwhile.
2.3 Revenue, Cost, and Profit Functions
In the preceding projections for the proposed ice cream bar venture, the assumption was
that 36,000 ice cream bars would be sold based on the volume in the prior summer.
However, the actual volume for a future venture might be higher or lower. And with an
economic profit so close to zero, our students should consider the impact of any such
differences.
There is a relationship between the volume or quantity created and sold and the resulting
impact on revenue, cost, and profit. These relationships are called the revenue function,
cost function, and profit function. These relationships can be expressed in terms of
tables, graphs, or algebraic equations.
In a case where a business sells one kind of product or service, revenue is the product
of the price per unit times the number of units sold. If we assume ice cream bars will be
sold for $1.50 apiece, the equation for the revenue function will be
R = $1.5 Q,
where R is the revenue and Q is the number of units sold.
The cost function for the ice cream bar venture has two components: the fixed cost
component of $40,000 that remains the same regardless of the volume of units and the
variable cost component of $0.30 times the number of items. The equation for the cost
function is
C = $40,000 + $0.3 Q,
where C is the total cost. Note we are measuring economic cost, not accounting cost.
Since profit is the difference between revenue and cost, the profit functions will be
π = R − C = $1.2 Q − $40,000.
10. 10
Here π is used as the symbol for profit. (The letter P is reserved for use later as a symbol
for price.)
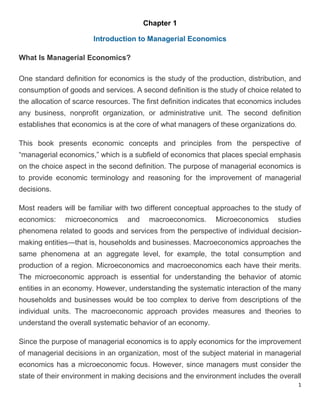
Table 2.1 "Revenue, Cost, and Profit for Selected Sales Volumes for Ice Cream Bar
Venture" provides actual values for revenue, cost, and profit for selected values of the
volume quantity Q. Figure 2.1 "Graphs of Revenue, Cost, and Profit Functions for Ice
Cream Bar Business at Price of $1.50", provides graphs of the revenue, cost, and profit
functions.
The average cost is another interesting measure to track. This is calculated by dividing
the total cost by the quantity. The relationship between average cost and quantity is
the average cost function. For the ice cream bar venture, the equation for this function
would be
AC = C/Q = ($40,000 + $0.3 Q)/Q = $0.3 + $40,000/Q.
Figure 2.2 "Graph of Average Cost Function for Ice Cream Bar Venture" shows a graph
of the average cost function. Note that the average cost function starts out very high but
drops quickly and levels off.
Table 2.1 Revenue, Cost, and Profit for Selected Sales Volumes for Ice Cream Bar
Venture
Units Revenue Cost Profit
0 $0 $40,000 –$40,000
10,000 $15,000 $43,000 –$28,000
20,000 $30,000 $46,000 –$16,000
30,000 $45,000 $49,000 –$4,000
40,000 $60,000 $52,000 $8,000
50,000 $75,000 $55,000 $20,000
60,000 $90,000 $58,000 $32,000
11. 11
Figure 2.1 Graphs of Revenue, Cost, and Profit Functions for Ice Cream Bar Business
at Price of $1.50
Essentially the average cost function is the variable cost per unit of $0.30 plus a portion
of the fixed cost allocated across all units. For low volumes, there are few units to spread
the fixed cost, so the average cost is very high. However, as the volume gets large, the
fixed cost impact on average cost becomes small and is dominated by the variable cost
component.
12. 12
Figure 2.2 Graph of Average Cost Function for Ice Cream Bar Venture
2.4 Breakeven Analysis
A scan of Figure 2.1 "Graphs of Revenue, Cost, and Profit Functions for Ice Cream Bar
Business at Price of $1.50" shows that the ice cream bar venture could result in an
economic profit or loss depending on the volume of business. As the sales volume
increases, revenue and cost increase and profit becomes progressively less negative,
turns positive, and then becomes increasingly positive. There is a zone of lower volume
levels where economic costs exceed revenues and a zone on the higher volume levels
where revenues exceed economic costs.
One important consideration for our three students is whether they are confident that the
sales volume will be high enough to fall in the range of positive economic profits. The
volume level that separates the range with economic loss from the range with economic
profit is called the breakeven point. From the graph we can see the breakeven point is
13. 13
slightly less than 35,000 units. If the students can sell above that level, which the prior
operator did, it will be worthwhile to proceed with the venture. If they are doubtful of
reaching that level, they should abandon the venture now, even if that means losing their
nonrefundable deposit.
There are a number of ways to determine a precise value for the breakeven level
algebraically. One is to solve for the value of Q that makes the economic profit function
equal to zero:
0 = $1.2 Q − $40,000 or Q = $40,000/$1.2 = 33,334 units.
An equivalent approach is to find the value of Q where the revenue function and cost
function have identical values.
Another way to assess the breakeven point is to find how large the volume must be
before the average cost drops to the price level. In this case, we need to find the value
of Q where AC is equal to $1.50. This occurs at the breakeven level calculated earlier.
A fourth approach to solving for the breakeven level is to consider how profit changes as
the volume level increases. Each additional item sold incurs a variable cost per unit of
$0.30 and is sold for a price of $1.50. The difference, called the unit contribution margin,
would be $1.20. For each additional unit of volume, the profit increases by $1.20. In order
to make an overall economic profit, the business would need to accrue a sufficient
number of unit contribution margins to cover the economic fixed cost of $40,000. So the
breakeven level would be
Q = fixed cost/(price per unit − variable cost per unit) = $40,000/($1.50 − $0.30) =
33,333.3 or 33,334 units.
Once the operating volume crosses the breakeven threshold, each additional unit
contribution margin results in additional profit.
We get an interesting insight into the nature of a business by comparing the unit
contribution margin with the price. In the case of the ice cream business, the unit
contribution margin is 80% of the price. When the price and unit contribution margins are
14. 14
close, most of the revenue generated from additional sales turns into profit once you get
above the breakeven level. However, if you fall below the breakeven level, the loss will
grow equally dramatically as the volume level drops. Businesses like software providers,
which tend have mostly fixed costs, see a close correlation between revenue and profit.
Businesses of this type tend to be high risk and high reward.
On the other hand, businesses that have predominantly variable costs, such as a retail
grocery outlet, tend to have relatively modest changes in profit relative to changes in
revenue. If business level falls off, they can scale down their variable costs and profit will
not decline so much. At the same time, large increases in volume levels beyond the
breakeven level can achieve only modest profit gains because most of the additional
revenue is offset by additional variable costs.
2.5 The Impact of Price Changes
In the preceding analyses of the ice cream venture, we assumed ice cream bars would
be priced at $1.50 per unit based on the price that was charged in the previous summer.
The students can change the price and should evaluate whether there is a better price
for them to charge. However, if the price is lowered, the breakeven level will increase
and if the price is raised, the breakeven level will drop, but then so may the customer
demand.
To examine the impact of price and determine a best price, we need to estimate the
relationship between the price charged and the maximum unit quantity that could be
sold. This relationship is called a demand curve. Demand curves generally follow a
pattern called the law of demand, whereby increases in price result in decreases in the
maximum quantity that can be sold.
We will consider a simple demand curve for the ice cream venture. We will assume that
since the operator of the business last year sold 36,000 units at a price of $1.50 that we
could sell up to 36,000 units at the same price this coming summer. Next, suppose the
students had asked the prior operator how many ice cream bars he believes he would
have sold at a price of $2.00 and the prior operator responds that he probably would
15. 15
have sold 10,000 fewer ice cream bars. In other words, he estimates his sales would
have been 26,000 at a price of $2.00 per ice cream bar.
To develop a demand curve from the prior operator’s estimates, the students assume
that the relationship between price and quantity is linear, meaning that the change in
quantity will be proportional to the change in price. Graphically, you can infer this
relationship by plotting the two price-quantity pairs on a graph and connecting them with
a straight line. Using intermediate algebra, you can derive an equation for the linear
demand curve
P = 3.3 − 0.00005 Q,
where P is price in dollars and Q is the maximum number of ice cream bars that will sell
at this price. Figure 2.3 "Linear Demand Curve for Ice Cream Bar Venture" presents a
graph of the demand curve.
16. 16
Figure 2.3 Linear Demand Curve for Ice Cream Bar Venture
It may seem awkward to express the demand curve in a manner that you use the quantity
Q to solve for the price P. After all, in a fixed price market, the seller decides a price and
the buyers respond with the volume of demand. Mathematically, the relationship for ice
cream bars could be written
Q = 66,000 − 20,000 P.
However, in economics, the common practice is to describe the demand curve as the
highest price that could be charged and still sell a quantity Q.
The linear demand curve in Figure 2.3 "Linear Demand Curve for Ice Cream Bar
Venture" probably stretches credibility as you move to points where either the price is
zero or demand is zero. In actuality, demand curves are usually curved such that
demand will get very high as the price approaches zero and small amounts would still
sell at very high prices, similar to the pattern in Figure 2.4 "Common Pattern for Demand
Curves". However, linear demand curves can be reasonably good estimates of behavior
if they are used within limited zone of possible prices.
17. 17
Figure 2.4 Common Pattern for Demand Curves
We can use the stated relationship in the demand curve to examine the impact of price
changes on the revenue and profit functions. (The cost function is unaffected by the
demand curve.) Again, with a single type of product or service, revenue is equal to price
times quantity. By using the expression for price in terms of quantity rather than a fixed
price, we can find the resulting revenue function
R = P Q = (3.3 − 0.00005 Q) Q = 3.3 Q − 0.00005 Q2
.
By subtracting the expression for the cost function from the revenue function, we get the
revised profit function
π = (3.3 Q − 0.00005 Q2
) − (40,000 + $0.3 Q) = –0.00005 Q2
+ 3 Q − 40,000.
Graphs for the revised revenue, cost, and profit functions appear in Figure 2.5 "Graphs
of Revenue, Cost, and Profit Functions for Ice Cream Bar Venture for Linear Demand
18. 18
Curve". Note that the revenue and profit functions are curved since they are quadratic
functions. From the graph of the profit function, it can be seen that it is possible to earn
an economic profit with a quantity as low as 20,000 units; however, the price would need
to be increased according to the demand curve for this profit to materialize. Additionally,
it appears a higher profit is possible than at the previously planned operation of 36,000
units at a price of $1.50. The highest profitability appears to be at a volume of about
30,000 units. The presumed price at this volume based on the demand curve would be
around $1.80.
.Figure 2.5 Graphs of Revenue, Cost, and Profit Functions for Ice Cream Bar Venture
for Linear Demand Curve
2.6 Marginal Analysis
Economists analyze relationships like revenue functions from the perspective of how the
function changes in response to a small change in the quantity. These marginal
measurements not only provide a numerical value to the responsiveness of the function
to changes in the quantity but also can indicate whether the business would benefit from
19. 19
increasing or decreasing the planned production volume and in some cases can even
help determine the optimal level of planned production.
The marginal revenue measures the change in revenue in response to a unit increase
in production level or quantity. The marginal cost measures the change in cost
corresponding to a unit increase in the production level. The marginal profit measures
the change in profit resulting from a unit increase in the quantity. Marginal measures for
economic functions are related to the operating volume and may change if assessed at
a different operating volume level.
There are multiple computational techniques for actually calculating these marginal
measures. If the relationships have been expressed in the form of algebraic equations,
one approach is to evaluate the function at the quantity level of interest, evaluate the
function if the quantity level is increased by one, and determine the change from the first
value to the second.
Suppose we want to evaluate the marginal revenue for the revenue function derived in
the previous section at last summer’s operating level of 36,000 ice cream bars. For a
value of Q = 36,000, the revenue function returns a value of $54,000. For a value of Q =
36,001, the revenue function returns a value of $53,999.70. So, with this approach, the
marginal revenue would be $53,999.70 − $54,000, or –$0.30. What does this tell us?
First, it tells us that for a modest increase in production volume, if we adjust the price
downward to compensate for the increase in quantity, the net change in revenue is a
decrease of $0.30 for each additional unit of planned production.
Marginal measures often can be used to assess the change if quantity is decreased by
changing sign on the marginal measure. Thus, if the marginal revenue is –$0.30 at Q =
36,000, we can estimate that for modest decreases in planned quantity level (and
adjustment of the price upward based on the demand function), revenue will rise $0.30
per unit of decrease in Q.
At first glance, the fact that a higher production volume can result in lower revenue
seems counterintuitive, if not flawed. After all, if you sell more and are still getting a
20. 20
positive price, how can more volume result in less revenue? What is happening in this
illustrated instance is that the price drop, as a percentage of the price, exceeds the
increase in quantity as a percentage of quantity. A glance back at Figure 2.5 "Graphs of
Revenue, Cost, and Profit Functions for Ice Cream Bar Venture for Linear Demand
Curve" confirms that Q = 36,000 is in the portion of the revenue function where the
revenue function declines as quantity gets larger.
If you follow the same computational approach to calculate the marginal cost and
marginal profit when Q = 36,000, you would find that the marginal cost is $0.30 and the
marginal profit is –$0.60. Note that marginal profit is equal to marginal revenue minus
marginal cost, which will always be the case.
The marginal cost of $0.30 is the same as the variable cost of acquiring and stocking an
ice cream bar. This is not just a coincidence. If you have a cost function that takes the
form of a linear equation, marginal cost will always equal the variable cost per unit.
The fact that marginal profit is negative at Q = 36,000 indicates we can expect to find a
more profitable value by decreasing the quantity and increasing the price, but not by
increasing the quantity and decreasing the price. The marginal profit value does not
provide enough information to tell us how much to lower the planned quantity, but like a
compass, it points us in the right direction.
Since marginal measures are the rate of change in the function value corresponding to
a modest change in Q, differential calculus provides another computational technique
for deriving marginal measures. Differential calculus finds instantaneous rates of
change, so the values computed are based on infinitesimal changes in Q rather than
whole units of Q and thus can yield slightly different values. However, a great strength
of using differential calculus is that whenever you have an economic function in the form
of an algebraic equation, you can use differential calculus to derive an entire function
that can be used to calculate the marginal value at any value of Q.
21. 21
How to apply differential calculus is beyond the scope of this text; however, here are the
functions that can be derived from the revenue, cost, and profit functions of the previous
section (i.e., those that assume a variable price related to quantity):
marginal revenue at a volume Q = $3.3 − $0.0001 Q,marginal cost at a volume Q = $
0.3,marginal profit at a volume Q = $3 − $0.0001 Q.
Substituting Q = 36,000 into these equations will produce the same values we found
earlier. However, these marginal functions are capable of more.
Since the marginal change in the function is the rate of change in the function at a
particular point, you can visualize this by looking at the graphs of the functions and
drawing a tangent line on the graph at the quantity level of interest. A tangent line is a
straight line that goes through the point on the graph, but does not cross the graph as it
goes through the point. The slope of the tangent line is the marginal value of the function
at that point. When the slope is upward (the tangent line rises as it goes to the right), the
marginal measure will be positive. When the slope is downward, the marginal measure
will be negative. If the line has a steep slope, the magnitude of the marginal measure
will be large. When the line is fairly flat, the magnitude will be small.
Suppose we want to find where the profit function is at its highest value. If you look at
that point (in the vicinity of Q = 30,000) on Figure 2.5 "Graphs of Revenue, Cost, and
Profit Functions for Ice Cream Bar Venture for Linear Demand Curve", you see it is like
being on the top of a hill. If you draw the tangent line, it will not be sloped upward or
downward; it will be a flat line with a zero slope. This means the marginal profit at the
quantity with the highest profit has a value of zero. So if you set the marginal profit
function equal to zero and solve for Q you find
0 = $3.00 − $0.0001 Q implies Q = $3.00/$0.0001 = 30,000.
This confirms our visual location of the optimum level and provides a precise value.
This example illustrates a general economic principle: Unless there is a constraint
preventing a change to a more profitable production level, the most profitable production
22. 22
level will be at a level where marginal profit equals zero. Equivalently, in the absence of
production level constraints, the most profitable production level is where marginal
revenue is equal to marginal cost. If marginal revenue is greater than marginal cost at
some production level and the level can be increased, profit will increase by doing so. If
marginal cost is greater than marginal revenue and the production level can be
decreased, again the profit can be increased.
2.7 The Conclusion for Our Students
Our students will look at this analysis and decide not only to go forward with the ice
cream business on the beach but to charge $1.80, since that is the price on the demand
curve corresponding to a sales volume of 30,000 ice cream bars. Their expected revenue
will be $54,000, which coincidently is the same as in the original plan, but the economic
costs will be only $49,000, which is lower than in the original analysis, and their economic
profit will be slightly higher, at $5000.
At first glance, a $5000 profit does not seem like much. However, bear in mind that we
already assigned an opportunity cost to the students’ time based on the income foregone
by not accepting the corporate internships. So the students can expect to complete the
summer with $10,000 each to compensate for the lost internship income and still have
an additional $5000 to split between them.
2.8 The Shutdown Rule
You may recall earlier in this chapter that, before deciding to disregard the $6000
nonrefundable down payment (to hold the option to operate the ice cream business) as
a relevant economic cost, the total cost of operating the business under a plan to sell
36,000 ice cream bars at a price of $1.50 per item would have exceeded the expected
revenue. Even after further analysis indicated that the students could improve profit by
planning to sell 30,000 ice cream bars at a price of $1.80 each, if the $6000 deposit had
not been a sunk cost, there would have been no planned production level and associated
price on the demand curve that would have resulted in positive economic profit. So the
students would have determined the ice cream venture to be not quite viable if they had
23. 23
known prior to making the deposit that they could instead each have a summer corporate
internship. However, having committed the $6000 deposit already, they will gain going
forward by proceeding to run the ice cream bar business.
A similar situation can occur in ongoing business concerns. A struggling business may
appear to generate insufficient revenue to cover costs yet continue to operate, at least
for a while. Such a practice may be rational when a sizeable portion of the fixed costs in
the near term are effectively sunk, and the revenue generated is enough to offset the
remaining fixed costs and variable costs that are still not firmly committed.
Earlier in the chapter, we cited one condition for reaching a breakeven production level
where revenue would equal or exceed costs as the point where average cost per unit is
equal to the price. However, if some of the costs are already sunk, these should be
disregarded in determining the relevant average cost. In a circumstance where a
business regards all fixed costs as effectively sunk for the next production period, this
condition becomes a statement of a principle known as the shutdown rule: If the selling
price per unit is at least as large as the average variable cost per unit, the firm should
continue to operate for at least a while; otherwise, the firm would be better to shut down
operations immediately.
Two observations about the shutdown rule are in order: In a circumstance where a firm’s
revenue is sufficient to meet variable costs but not total costs (including the sunk costs),
although the firm may operate for a period of time because the additional revenue
generated will cover the additional costs, eventually the fixed costs will need to be
refreshed and those will be relevant economic costs prior to commitment to continue
operating beyond the near term. If a business does not see circumstances changing
whereby revenue will be getting better or costs will be going down, although it may be a
net gain to operate for some additional time, such a firm should eventually decide to
close down its business.
Sometimes, it is appropriate to shut down a business for a period of time, but not to close
the business permanently. This may happen if temporary unfavorable circumstances
mean even uncommitted costs cannot be covered by revenue in the near term, but the
24. 24
business expects favorable conditions to resume later. An example of this would be the
owner of an oil drilling operation. If crude oil prices drop very low, the operator may be
unable to cover variable costs and it would be best to shut down until petroleum prices
climb back and operations will be profitable again. In other cases, the opportunity cost
of resources may be temporarily high, so the economic profit is negative even if the
accounting profit would be positive. An example would be a farmer selling his water rights
for the upcoming season because he is offered more for the water rights than he could
net using the water and farming.
2.9 A Final Word on Business Objectives
In the example used in this chapter, we assumed the students’ goal in how to operate
the ice cream business was to maximize their profit—more specifically, to maximize their
economic profit. Is this an appropriate overall objective for most businesses?
Generally speaking, the answer is yes. If a business is not able to generate enough
revenue to at least cover their economic costs, the business is losing in the net. In
addition to the business owners having to cover the loss out of their wealth (or out of
society’s largesse for a bankruptcy), there is an inefficiency from a societal perspective
in that the resources used by the business could be more productive elsewhere.
The ice cream business analyzed here was simple in many respects, including that it
was intended to operate for only a short period of time. Most businesses are intended to
operate for long periods of time. Some businesses, especially newly formed businesses,
will intentionally operate businesses at a loss or operate at volumes higher than would
generate the maximum profit in the next production period. This decision is rational if the
business expects to realize larger profits in future periods in exchange for enduring a
loss in the near future. There are quantitative techniques, such as discounting,Many
accounting and economics texts discuss the concept of discounting of profits over time.
One good discussion can be found in an appendix in Hirschey and Pappas (1996). that
allow a business decision maker to make these trade-offs between profit now and profit
later. These techniques will not be covered in this text.
25. 25
Economists refer to a measure called the value of the firm, which is the collective value
of all economic profits into the future and approximately the amount the owners should
expect to receive if they sold the business to a different set of owners. For a corporation,
in theory this would roughly equate to the value of the equity on a company’s balance
sheet, although due to several factors like sunk costs, is probably not really that value.
Economists would say that a business should make decisions that maximize the value
of the firm, meaning the best decisions will result in larger economic profits either now
or later.
One response to the principle that the overall goal of a firm is to maximize its value is
that, although that goal may be best for those who own the business, it is not the optimal
objective for the overall society in which the business operates. One specific objection
is that those who work for the business may not be the same as those who own the
business and maximizing the value for the owners can mean exploiting the nonowner
employees. The common response to this objection is that it will be in the owners’ best
interest in the long run (several periods of operation) to treat their employees fairly.
Businesses that exploit their employees will lose their good employees and fail to
motivate those employees who remain. The collective result will be lower profits and a
lower value of the firm.
A second objection to the appropriateness of operating a business to maximize the value
for the owners is that this invites businesses to exploit their customers, suppliers, and
the society in which they operate to make more money. Firms may be able to take
advantage of outside parties for a while, but eventually the customers and suppliers will
wise up and stop interacting with the business. With a high level of distrust, there will be
a decline in profits in future periods that will more than offset any immediate gain. If a
business tries to exploit the overall society by ruining the environment or causing an
increase in costs to the public, the business can expect governmental authorities to take
actions to punish the firm or limit its operations, again resulting in a net loss over time.
So maximizing the value of the firm for the owners does not imply more profit for the
owners at the expense of everyone else. Rather, a rational pursuit of maximal value will
respect the other stakeholders of a business.
26. 26
In the case of nonprofit organizations, maximizing the value of the organization will be
different than with for-profit businesses like our ice cream example. A nonprofit
organization may be given a budget that sets an upper limit on its costs and is expected
to provide the most value to the people it serves. Since most nonprofit organizations do
not charge their “customers” in the same way as for-profit businesses, the determination
of value will be different than estimating sales revenue. Techniques such as cost-benefit
analysisA classic text in cost-benefit analysis was written by E. J. Mishan (1976). have
been developed for this purpose.
27. 27
Chapter 3
Demand and Pricing
Decisions related to demand and pricing are usually called marketing decisions.
Marketing is an established profession and an applied academic discipline with a large
body of literature. However, economic reasoning and concepts provide much of the
theoretical foundation for marketing practice. In this chapter, we will address these
elements from the perspective of economics.
3.1 Theory of the Consumer
Back in Chapter 2 "Key Measures and Relationships", we used a demand curve to
represent the relationship between the price charged for ice cream bars and the
maximum number of ice cream bars that customers would purchase. We will address
how to create a demand curve later in this chapter, but we will begin our discussion with
a brief review of microeconomic theory that endeavors to explain how consumers
behave.
A consumer is someone who makes consumption decisions for herself or for her
household unit. In a modern society, consumption is largely facilitated by purchases for
goods and services. Some of these goods and services are essential to a consumer’s
livelihood, but others are discretionary, perhaps even a luxury. Consumers are limited in
how much they can consume by their wealth. A consumer’s wealth will change over time
due to income and expenditures. She might be able to borrow against future income so
as to increase her capacity to purchase now in exchange for diminished wealth and
consumption later. Similarly, she may retain some of her current wealth as savings
toward increased future consumption. Consumption decisions may be planned into the
future, taking account of the expected changes in wealth over time.
The theory of the consumer posits that a consumer plans her purchases, the timing of
those purchases, and borrowing and saving so as maximize the satisfaction she and her
household unit will experience from consumption of goods and services. In this theory,
consumers are able to compare any two patterns of consumption, borrowing, and saving
28. 28
and deem that either one is preferred to the second or they are indifferent between the
two patterns. Based on the ability to do these comparisons, consumers look at the prices
charged for various services now, and what they expect prices to be for goods and
services in the future, and select the pattern of consumption, borrowing, and saving that
generates the greatest satisfaction over their lifetime within the constraint of their wealth
and expected future income.
Although the consumers may anticipate changes in prices over time, they may find that
their guesses about future prices are incorrect. When this happens, the theory states
that they will adjust their consumption, borrowing, and saving to restore the optimality
under the newly revealed prices. In fact, the theory identifies two effects of price
changes: the substitution effect and the income effect.
The substitution effect is based on an argument employing marginal reasoning like the
marginal analysis discussed in Chapter 2 "Key Measures and Relationships".
Economists often use the term utility as a hypothetical quantitative value for satisfaction
that a consumer receives from a pattern of consumption. If a consumer were to receive
one more unit of some good or service, the resulting increase in their utility is called
the marginal utility of the good. As a consequence of maximizing their overall satisfaction
from consumption, or equivalently maximizing their utility, it will be the case that if you
take the marginal utility of one good or service and divide it by its price, you should get
the same ratio for any other good or service. If they were not roughly equal, the consumer
would be able to swap consumption of one good or service for another, keep within their
wealth constraint, and have higher utility. The substitution effect is the consumer’s
response to a changing price to restore balance in the ratios of marginal utility to price.
Just as a simple illustration, suppose a consumer likes bananas and peaches as a treat.
For the sake of the illustration, let’s suppose an additional banana has a marginal utility
of 2 and a peach has a marginal utility of 3. If a banana costs $0.20 and a peach costs
$0.30, bananas and peaches have a ratio of the marginal utility to its price equal to 10.
If the peach price increases to $0.40, the ratio will become lower for peaches and the
consumer may substitute some purchases of peaches with purchases of more bananas.
29. 29
As the result of price changes and substitution, the consumer’s overall utility may
increase or decrease. Consequently, the consumer may experience the equivalent of an
increase or decrease in wealth, in the sense that it would have required a different level
of wealth to just barely afford the new consumption pattern under the previous set of
prices. This equivalent change in purchasing power is called the income effect.
Economists have precise techniques for separating the response to a price change into
a substitution effect and an income effect.See Varian (1993) for a discussion of the
substitution effect, income effect, and Giffen goods. This is beyond the scope of this text.
For our purposes, it is sufficient to appreciate that price changes will affect the mix of
goods and services that is best and change the consumer’s overall level of satisfaction.
In most cases, the primary response to a price change is a substitution effect, with a
relatively modest income effect. However, for goods and services that a consumer
cannot substitute easily, a sizeable price change may have a significant income effect.
For example, when gasoline prices jumped dramatically in the United States, consumers
may have reduced their driving somewhat but were unable to find a substitute for the
essential needs served by driving their cars. As a result, consumers experienced a
dramatic drop in wealth available for other goods and services and consumed generally
less of all of those to compensate for the greater expenditure on gasoline.
Normally, price increases result in less consumption of the associated good or service,
whereas price decreases results in more consumption. This typical pattern is usually
supported by both the substitution effect and the income effect. An interesting exception
is the case of Giffen goods, which is a situation where consumption of a good or service
may increase in response to a price increase or decrease in response to a price
decrease. This anomaly is explained by a strong income effect. An economist named
Robert Giffen discovered that Irish consumers increased the use of potatoes in their diet
during the Irish Potato Famine of the 1840s, even though the price of potatoes rose
dramatically. Basically, because potatoes were a staple of the Irish diet, when the potato
price increased, the wealth available to purchase other food items diminished and Irish
30. 30
consumers wanted to purchase more potatoes to compensate for the diminished
purchases of other food items.
3.2 Is the Theory of the Consumer Realistic?
Strictly speaking, it would be difficult to make a case that the theory of the consumer
conforms to our own experience of consumption decisions or what we observe of other
consumers. We don’t consciously weigh the relative marginal utilities of tens of
thousands of possible goods and services we might consume. We don’t know all the
current prices and don’t even know of the existence of many goods and services. Even
if we did, the computational complexity to solve for optimal consumption would
overwhelm our faculties, and probably even the fastest computers available.
Many times we and others don’t think of our consumption in terms of what gives us the
greatest satisfaction but in terms of what it takes to get by. Consumers who are
impoverished or suffer a major ailment are probably unable to do even a modest attempt
at optimizing consumption. Others may simply consume as a matter of habit rather than
conscious choice.
Although our consumption decisions may not fully conform to the theory of the consumer,
there have been some attempts to argue that we do approximate it. Herbert Simon
proposed a theory of bounded rationalityBounded rationality and satisficing are
discussed in Simon (1997). that states that humans do behave rationally with a limited
range of options. So if consumers focus on a modest set of important goods and
services, they may be able to achieve something close to the theoretical optimum in
terms of overall utility. Simon also observed that human beings may not optimize so
much as they “satisfice,” meaning that they work to meet a certain level of consumption
satisfaction rather than the very best pattern of consumption. If the level of acceptability
is reasonably close to the optimum level, again the results of consumption decisions may
approximate what would occur if the consumers operated according to this theory.
Another argument suggesting that differences between the theory and actual behavior
may not result in starkly different consumption is that we observe how others behave. If
31. 31
someone else, either by active choice or by accidental discovery, is experiencing greater
satisfaction under similar circumstances of wealth and income, their friends and
neighbors will detect it and start to emulate their consumption patterns. So our
consumption may evolve in the direction of the optimal pattern.
Perhaps most importantly, the lack of face validity of the theory of the consumer does
mean the theory is not useful in modeling consumer behavior. We do expect consumers
to respond to price changes and we do expect consumers to respond to changes in their
wealth, whether due to changes in their actual discretionary income or indirect impacts
on wealth resulting from price changes.
3.3 Determinants of Demand
We can approach the challenge of modeling consumer behavior in a more practical
manner that is informed by the theory of the consumer. To estimate demand and study
the nature of consumer demand, we start by identifying a set of key factors that have a
strong influence on consumer demand.
Probably the most important influencing factor is one we considered for the ice cream
business in Chapter 2 "Key Measures and Relationships"—the price of the item itself.
Price is also the key determinant of demand in the theory of the consumer. In the
simplest cases, there is a single price that applies to any item or unit of service being
sold. However, as we will discuss later in the section on price discrimination, prices may
vary depending on who is buying it and how much they are buying.
Businesses incur promotional costs to boost the consumption of their products.
Promotion can be in the form of advertising, free samples, appearance in business
directories, and so on. The theory of the consumer provides a supporting rationale for
expenditure on promotion: If a consumer is regarded as deciding how to allocate his
wealth across available goods and services, in order for your product to be included as
a candidate in that choice, the consumer has to be aware that your product or service
exists. However, as we will discuss in Chapter 7 "Firm Competition and Market
Structure", large firms often engage in promotion at expenditure levels well beyond what
32. 32
is needed to make your firm and product known to the consumer, as a tactic of
competition.
Consumer demand may vary depending on where and when the consumption is
occurring. Being able to quantitatively assess how consumption changes by location or
time is a powerful tool in deciding where and when to sell your product. Some businesses
decide to serve broad geographical regions; others target specific locations. Some
businesses sell most or all times of the day and days of the year; others limit their
operations to a restricted number of hours or periods within a year. What strategy will
work best will depend on the product and the company’s overall marketing strategy.
Businesses have a choice of channels for selling. They can operate their own
commercial establishments or sell wholesale to other retailers. Goods can be sold
directly at a retail site or via the Internet, telephone, or mail order. Understanding how
the channels used will affect demand is important.
The selection of price, promotional activities, location, and channel are generally in the
control of the business concern. In texts on marketing strategy,Kotler and Armstrong
(2010) is a popular text on marketing principles. the composition of these decisions is
called a marketing mix. For a marketing mix to be effective, the different elements need
to be consistent.
However, there are other important determinants of consumption for a good or service
that are largely out of the control of the providing firm. We will next consider some of
these determinants.
As suggested by the substitution effect in the theory of the consumer, the consumer is
able to alter his pattern of consumption to meet his needs as prices and wealth levels
change. The most significant swaps are likely to be between goods and services that
come close to meeting the same consumer need. For example, a banana can serve as
a substitute for a peach in meeting the need for a piece of fruit. Usually the items that
act as substitutes to the product of one firm will be sold by a different firm. Consequently,
how that other firm elects to price, promote, locate, and channel its goods or services
33. 33
will have an impact on the consumption of substitutable goods or services sold by the
first firm.
Different goods and services can be strongly related in another way called a
complementary relationship. Consumption of some goods and services can necessitate
greater consumption of other goods and services. For example, if more automobiles are
sold, there will be increased demand for tires, oil, repair services, automobile financing,
automobile insurance, and so on. Correctly monitoring and forecasting the demand of
key complements can improve the ability of a firm to forecast its own consumer demand.
Most firms sell multiple products and services that are related. Within this collection,
there are probably important substitute and complementary relationships. A car dealer
that sells several models of vehicles has substitutable products that compete with each
other. The car dealer may be offering services like repair service and financing that are
complementary to vehicle sales. In situations with strong substitute and complementary
product relationships, the firm needs to consider these in its demand forecasting and
market strategy.
Earlier, we discussed the income effect caused by price changes and indicated that this
is caused by the consumer realizing an increase or decrease in overall purchasing
wealth. Probably a more significant cause of changes in wealth occurs from fluctuations
in the economic activity, which will affect the demand for most goods and services. The
relationship between demand quantities and economic indicators of economic activity or
disposable income can improve business forecasting considerably.
Demand is also affected by the demographics of the population of eligible customers.
How many people live in a region, their ethnic and socioeconomic composition, and age
distribution can explain variations in demand across regions and the ability to forecast in
the future as these demographics change.
3.4 Modeling Consumer Demand
34. 34
To develop a formal model of consumer demand, the first step is to identify the most
important determinants of demand and define variables that measure those
determinants. Ideally, we should use variables for which data exist so that statistical
estimation techniques can be applied to develop an algebraic relationship between the
units of a good consumed and the values of the key determinants. Techniques to derive
these algebraic relationships from historical data are outside the scope of this text, but
an interested reader may want to consult a text on econometrics.Stock and Watson
(2007) is an established econometrics text.
We will examine a simple example of a model of consumer demand. Suppose a business
is selling broadband services in a community. The managers of the business have
identified four key determinants of demand: (a) the price they charge for the service, (b)
their advertising expenditure, (c) the price charged by the competition, and (d) the
disposable income of their potential customers. They define four variables to measure
these determinants:
P = the price per month of their service, in dollars,A = advertising expenditure per month,
in dollars,CP = the price per month of the competitor’s service, in dollars,DIPC = the
disposable income per capita, in dollars, as measured by the U.S. Department of
Commerce for that month.
Using past data, they estimate the following equation to relate these variables to number
of broadband subscribers to their service during a month, symbolized by Q:
Q = 25,800 − 800 P + 4 A + 200 CP + 0.4 DIPC.
This relationship is called a demand function.
One application of the demand function is to estimate the consumption quantity Q for
specific values of P, CP, and DIPC. Suppose P = $30, A = $5000, CP = $25, and DIPC
= $33,000:
Q = 25,800 − 800(30) + 4(5000) + 200(25) + 0.4(33,000) = 40,000 subscribers
In Chapter 2 "Key Measures and Relationships", we introduced a demand curve to
describe the relationship between the quantity of items sold and the price of the item.
35. 35
When there are multiple determinants of demand, the demand curve can be interpreted
as a reduced view of the demand function where only the price of the product is allowed
to vary. Any other variables are assumed to remain at a fixed level. For the previous
demand function for broadband service, suppose we assume A is fixed at $5000, CP is
fixed at $25, and DIPC is fixed at $33,000. If you substitute these values into the demand
function and aggregate constant terms, the demand function becomes
Q = 64,000 − 800 P.
Recall that demand curves are usually expressed with price as a function of quantity.
With some basic algebra the equation of the demand curve can be written as
P = $80 − $0.00125 Q.
What happens to the demand curve if one of the other variables is a different value?
Well, in short, the demand curve would shift. Suppose the competitor decides to increase
its price to $35. Repeating the preceding steps, the demand function simplifies to
Q = 66,000 − 800 P
or, expressed with P as a function of Q,
P = $82.50 − 0.00125 Q.
Figure 3.1 "Shift in Demand Curve for Broadband Service Caused by Increase of
Competitor Price From $25/month to $35/month" shows a graph of the demand curve
before and after the shift. Effectively, the result is that the broadband firm would see its
demand increase by 2000 customers per month, or alternatively, the firm could raise its
price to $32.50 and still maintain 40,000 customers per month.
3.5 Forecasting Demand
Identifying the key determinants of demand and developing demand functions gives a
business manager a better understanding of his customers. A benefit of that
understanding is an improved accuracy in forecasting the demand levels for their
products and services in an upcoming period. Most businesses need to plan production
36. 36
activities well in advance of when the goods and services are actually provided to the
consumer. Businesses need to have an adequately sized operation, have a sufficient
staff in terms of size and training, and obtain any necessary resources for production.
These capabilities are usually not possible to achieve overnight. For some goods,
production is a process that takes significant time from initiation to completion, such as
constructing apartments or office space that will be leased to customers. Even
businesses that provide products or services “made to order,” where most of the direct
organization or production activities occur after a purchase is made, usually need to have
supplies, trained labor, and management structures in place in advance of the order to
be in a position to negotiate a sale.
Figure 3.1 Shift in Demand Curve for Broadband Service Caused by Increase of
Competitor Price From $25/month to $35/month
Without some concrete estimate of what level of demand will result after these planning,
designing, and production activities, a business may find itself with an excess of unused
capacity or unable to serve the demand that follows. Excess capability is costly because
idle resources have an opportunity cost but do not contribute to sales or revenue,
especially when the unused resources spoil and cannot be used at a later time. When
businesses set production targets too low, they discover missed opportunities for profit
37. 37
and unmet demand that is likely to discourage those consumers from being customers
in the future.
To a limited extent, a business may be able to alter future demand to be more in line
with its capacity because it has control over some determinants of demand, like pricing,
promotion, and location. If the business is surprised by demand levels that are higher or
lower than expected, these market strategy elements can be adjusted to either stimulate
or diminish demand to conform to its production capabilities. Still, the financial
performance of an enterprise is improved when the demand is consistent with the levels
anticipated in the initial planning stages.
Further, most businesses are not in control of all the key determinants of demand. The
business cannot control the direction of the overall economy and consumer incomes.
The business may be able to guess at, but not control, actions by other companies that
sell substitute and complementary goods and services. Anticipating the impact of these
outside forces is critical.
Businesses can improve demand forecasting with their demand functions using the
future values of determinant variables in those demand functions. Forecasts for widely
followed economic indicators like disposable income are available from public releases
or private forecasting services. If the business has a record of data for these
uncontrollable variables, they can apply quantitative forecasting techniques like time
series analysis or develop casual models that relate these factors to other variables that
can be forecast. Readers are encouraged to look at a text in business forecasting for
assistance in doing quantitative forecasts. One business forecasting text is a book
authored by Hanke and Wichern (2009).
For variables where past patterns may not continue into the future, like competitor
actions on pricing and promotion or unexpected climate events, a business can construct
scenarios in which management postulates settings for these factors and then develops
a demand forecast for each scenario. Although the future will almost certainly not
conform exactly to any single scenario, the exercise prepares them to monitor for
38. 38
changes in these factors and be ready to make a prompt response whenever a similar
scenario emerges.
3.6 Elasticity of Demand
Another use of a mathematical demand function is measuring how sensitive demand is
to changes in the level of one of the determinants. Suppose we would like to assess
whether the demand for broadband service will change much in response to a change
in its price. One indicator of the level of response to a price change is the coefficient of
the price term in the demand function equation, –800 P. The interpretation of the
coefficient –800 is that for each increase of $1 in the monthly subscriber price, the
number of monthly subscribers will decrease by 800 subscribers.
This observation provides some insight, particularly if the broadband firm is considering
a price change and would like to know the impact on the number of subscribers.
However, for someone who measures price in terms of a different currency, say
Japanese yen, a conversion to U.S. dollars would be needed to appreciate whether the
demand change implied by the coefficient value is large or modest. Another limitation of
this approach to measuring the responsiveness of demand to a determinant of demand
is that the observation may not apply readily to other communities that may have a larger
or smaller population of potential customers.
An alternative approach to measuring the sensitivity of demand to its determinant factors
is to assess the ratio of percentage change in demand to the percentage change in its
determinant factor. This type of measurement is called an elasticity of demand.
Assessing the elasticity of demand relative to changes in the price of the good or service
being consumed is called the own-price elasticity or usually just the price elasticity. As
an illustration of this, suppose we want to measure the sensitivity of demand for
broadband services corresponding to a modest change in its price. First, to determine
the price elasticity, you need to clearly understand the settings for all the determinant
factors because elasticity changes if you look at a different configuration of factor levels.
Suppose we decide to find the price elasticity when P = $30, A = $5000, CP = $25, and
39. 39
DIPC = $33,000. Earlier we determined that the demand quantity at this setting was Q =
40,000 monthly subscribers.
If we let the price increase by 10% from $30 to $33 and repeat the calculation of Q in the
demand function, the value of Q will decline to 37,600 subscribers, which is a decline of
2400 customers. As a percentage of 40,000 monthly customers, this would be a 6%
decrease. So the price elasticity here would be
Price elasticity = –6%/10% = –0.6.
Since the law of demand states that quantity demanded will drop when its price increases
and quantity demanded will increase when its price decreases, price elasticities are
usually negative numbers (other than special cases like Giffen goods, described earlier
in this chapter).
Goods and services are categorized as being price elastic whenever the price elasticity
is more negative than –1. In this category, the percentage change in quantity will be
greater than the percentage change in price if you ignore the negative sign.
When the computed price elasticity is between 0 and –1, the good or service is
considered to be price inelastic. This does not mean that demand does not respond to
changes in price, but only that the response on a percentage basis is lower than the
percentage change in price when the negative sign is ignored.
In those rare instances where price elasticities are positive, the product violates the law
of demand. Again, these are similar to the Giffen goods discussed earlier.
By assessing sensitivity to changes on a percentage basis, it does not matter what units
are used in the variable measurements. We could have constructed our demand function
with a price measurement in cents or euros, and the price elasticity would have been the
same. Also, if we wanted to compare the price elasticity of broadband service in this
community with the price elasticity of broadband service in a larger community, we could
compare the price elasticities directly without any need for further adjustment.
40. 40
Another important class of elasticities is the response of demand to changes in income,
or the income elasticity. For our broadband example, if we were to calculate the income
elasticity at the same point where we calculated the price elasticity, we would have found
an elasticity of 0.33. The interpretation of this value is as follows: For an increase of 1%
in income levels, demand for broadband will increase by 0.33%.
When income elasticity of a product is greater than one, we call the product a cyclic
good. The adjective “cyclic” suggests that this demand is sensitive to changes in the
business cycle and will generally change more on a percentage basis than income
levels. Luxury goods that customers can do without in hard economic times often fall in
this category.
When income elasticity is between zero and one, we call the product a noncyclic good.
Our broadband service falls in this category. The demand for noncyclic goods tends to
move up and down with income levels, but not as strongly on a percentage basis. Most
of the staple goods and services we need are noncyclic.
Normally we would expect demand for a good or service to increase when incomes
increase and decrease when incomes decrease, other things being equal. However,
there are arguably some exceptions that do not behave this way. Low-cost liquor, which
might see increased use in hard economic times, is one of these possible exceptions.
When income elasticity is negative, we call the product a countercyclic good.
When elasticities are calculated to measure the response of demand to price changes
for a different good or service, say either a substitute product or complementary product,
we call the calculated value a cross-price elasticity. Cross-price elasticities tend to be
positive for substitute goods and negative for complementary goods. In our example, the
competitor’s service is a substitute good. If we calculate the cross-price elasticity for
changes in the competitor’s price on demand for broadband service at the point
examined earlier, the result is 0.125.
Elasticities can be calculated for any factor on demand that can be expressed
quantitatively. In our example, we could also calculate an advertising elasticity, which
41. 41
has a value of 0.5 at the given settings for the four factors in our demand function. This
value indicates that an increase of 1% in our monthly advertising will result in a 0.5%
increase in subscribers.
In interpreting and comparing elasticities, it is important to be clear whether the elasticity
applies to a single business in a market or to all sellers in a market. Some elasticities,
like price elasticities and advertising elasticities, tend to reflect greater sensitivity to
changes in the factor when an elasticity is calculated for a single business than when
assessed for the total demand for all sellers in a market. For example, we noted earlier
that consumers will be unable to decrease gasoline consumption much, at least
immediately, even if gasoline prices climb dramatically. This implies that gasoline is very
price inelastic. However, this observation really applies to the gasoline industry as a
whole. Suppose there was a street intersection in a city that has a gasoline station on
every corner selling effectively the same product at about the same price, until one
station increases its price dramatically (believing gasoline was highly inelastic to
changes in price, so why not), but the other three stations leave their price where it was.
If prices were clearly displayed, most customers would avoid the station that tried to
increase the price and that station would see nearly all of its business disappear. In this
situation where the competitors’ goods are highly substitutable, the price elasticity for a
single gasoline station would be very price elastic.
3.7 Consumption Decisions in the Short Run and the Long Run
The main reason most consumers are unable to respond very quickly to an increase in
gasoline prices is because there is not an effective substitute for automobile travel.
However, if consumers were convinced that gasoline prices were going to continue to
rise into the foreseeable future, they would gradually make changes to their lifestyles so
that they are able to reduce gasoline consumption significantly. They could purchase
more fuel-efficient cars or cars that use an alternative fuel, or they could change jobs or
change residences so that they are closer to their places of employment, shopping, and
such.
42. 42
Economists distinguish short-run decisions from long-run decisions. A consumer
decision is considered short run when her consumption will occur soon enough to be
constrained by existing household assets, personal commitments, and know-how. Given
sufficient time to remove these constraints, the consumer can change her consumption
patterns and make additional improvements in the utility of consumption. Decisions
affecting consumption far enough into the future so that any such adjustments can be
made are called long-run decisions.
Demand functions and demand curves can be developed for short-run or long-run time
horizons. Short-run demand curves are easier to develop because they estimate
demand in the near future and generally do not require a long history of data on
consumption and its determinant factors. Because long-run demand must account for
changes in consumption styles, it requires longer histories of data and greater
sophistication.
Elasticities of demand in the short run can differ substantially from elasticities in the long
run. Long-run price elasticities for a product are generally of higher magnitude than their
short-run counterparts because the consumer has sufficient time to change consumption
styles.
There is so much uncertainty about long-run consumption that these analyses are
usually limited to academic and government research. Short-run analyses, on the other
hand, are feasible for many analysts working for the businesses that must estimate
demand in order to make production decisions.
3.8 Price Discrimination
In the ice cream bar summer business in Chapter 2 "Key Measures and Relationships",
we presumed that the student operators would decide on a price to charge. All ice cream
bars would be sold at that price. We reasoned that more ice cream bars could be sold
as the price is decreased. If the students decide to charge $1.50 per ice cream bar, a
potential customer will decide if the utility of the ice cream bar is sufficiently high for them
to be willing to give up $1.50 of their wealth. If not, they will walk away without making a
43. 43
purchase. If the students instead decide to charge $1.80 per ice cream bar, the demand
curve indicated that 6000 fewer unit purchases would occur, meaning 6000 of those
purchases were not worth $1.80 to the purchasers. However, some of the customers
would have been willing to pay over $2.00, and fewer even more than $2.50 or $3.00.
When all consumers pay the same price, some of them get a kind of surplus because
they would have been willing to pay more for the ice cream bar. Sellers may wish they
were able to charge customers the maximum amount they are willing to pay, which would
result in more revenue and no added cost. In economics, the term for charging different
prices to different customers is called price discrimination. Economists have actually
defined multiple types of price discrimination, called first-degree price discrimination,
second-degree price discrimination, and third-degree price discrimination.
First-degree price discrimination is an attempt by the seller to leave the price
unannounced in advance and charge each customer the highest price they would be
willing to pay for the purchase. If perfectly executed, this would meet the ideal of getting
the greatest revenue possible from sales. Unfortunately, anything close to perfect
execution of first-degree price discrimination is unrealistic because customers have an
incentive to not reveal how much they would be willing to pay and instead try to pay as
little as possible. Attempts to sell using first-degree price discrimination may be illegal as
well, as it may be deemed discriminatory in the legal sense of the word.
Some commercial dealings resemble attempts at first-degree price discrimination.
Sometimes there is no set price, and the buyer and seller negotiate a price. This is the
customary way that automobiles have been sold in the United States. The process may
start with a preannounced price, but one that is usually higher than the seller actually
expects to receive. This falls short of pure first-degree discrimination because the buyer
is probably able to negotiate down from the most he would pay, possibly quite a bit if the
buyer is a good negotiator. In addition, there is time and effort expended in the
negotiating, which is a kind of cost to the transaction that the buyer may see as part of
the purchase cost and the seller may see as an added cost of business.
44. 44
Goods and services are sometimes sold or purchased via an auction. This is usually an
effective means when the seller has a limited number of items to sell. Run properly, an
auction will distinguish those willing to pay more, although it probably will not manage to
get a bid as high as the maximum the buyer would have paid. Again, the cost of operating
an auction is expensive in comparison to selling using a set, preannounced price.
Businesses that sell a product that is in demand with no good substitute available will
sometimes employ a sliding price, where they begin selling at a very high price that is
attractive to relatively few consumers. After a time when presumably those high-value
customers make their purchases, the business will drop the price somewhat and attract
purchases from another group that was willing pay slightly less than the first group.
Successive price drops can continue until it would be unprofitable for the seller to drop
the price any lower. Sliding prices are sometimes used with products that employ new
technologies, when the initial seller has the market to itself, at least for a while, and offers
a got-to-have item for some customers. Of course, although these eager customers may
be willing to pay more, they may be aware of this pricing strategy and delay their
purchase, so this approach will not extract the full value customers would have been
willing to pay.
When goods and services are sold according to a preannounced price, the customary
arrangement is that the charge for multiple items is the price times the number of items.
This is called linear pricing. However, customers differ in the volume they are interested
in purchasing. A business may benefit by offering different prices to those who purchase
in larger volumes because either they can increase their profit with the increased volume
sales or their costs per unit decrease when items are purchased in volume. Businesses
can create alternative pricing methods that distinguish high-volume buyers from low-
volume buyers. This is second-degree price discrimination.
A donut shop might offer a free donut to anyone who purchases a whole dozen because
the purchase requires less clerk time per donut sold and increases how many donuts
get purchased. However, since only those who buy at least a dozen donuts get a free
45. 45
donut, the discount is limited to those people and not the customer who purchases just
a donut or two. This would be second-degree price discrimination.
Another nonlinear pricing scheme to employ second-degree discrimination is a two-part
price. A customer pays a flat charge to be a customer and then pays a per unit charge
based on how much they consume. Some services like telephone service are primarily
fixed cost and have a very small per unit variable cost. By charging telephone customers
a flat monthly fee and low per unit charge, they encourage more use of the service than
if they simply charged a linear price per unit and see more revenue in relation to costs.
Membership stores that require customers to pay an entry fee before being allowed to
shop, but offer lower prices than regular stores for purchased items, is another example
of a two-part pricing.
Third-degree price discrimination is differential pricing to different groups of customers.
One justification for this practice is that producing goods and services for sale to one
identifiable group of customers is less than the cost of sales to another group of
customers. For example, a publisher of music or books may be able to sell a music
album or a book in electronic form for less cost than a physical form like a compact disc
or printed text.
A second justification for charging different prices to different groups of customers is that
one group may be more sensitive to price than the other group. Earlier we discussed
elasticity of demand. If we separated the demand for the two groups into separate
demand curves, at any given price the more price sensitive group will have stronger
negative price elasticity. Sellers are able to increase economic profit by charging a lower
price to the price-elastic group and a higher price to the more price-inelastic group. As
an example, 25 years ago music was sold in two formats: cassette tapes and compact
discs. The production cost of a cassette tape was roughly equivalent to a compact disc,
but music on compact discs often retailed at a higher price because it was perceived that
customers of compact discs were more demanding of quality and more price inelastic.
To apply third-degree price discrimination, the seller must be able to clearly identify and
sort the customer by a salient characteristic. For example, a cable provider may be
46. 46
aware that existing subscribers are price inelastic relative to other households that are
not existing customers. The cable provider will typically charge reduced rates to attract
new customers and is able to execute the price discrimination because it knows whether
a customer is an existing customer or not. A sports clothing retailer may know that fans
of a team are more price inelastic in the purchase of apparel displaying the name or
mascot of that team than customers who are not fans. However, if the clothing retailer
were to attempt to charge differential prices, the customers who are fans would have the
incentive to disguise that characteristic, so third-degree price discrimination would not
work well in this case.
47. 47
Chapter 4
Cost and Production
In the previous two chapters we examined the economics underlying decisions related
to which goods and services a business concern will sell, where it will sell them, how it
will sell them, and in what quantities. Another challenge for management is to
determine how to acquire and organize its production resources to best support those
commitments. In this chapter and in the following chapter we will be discussing key
concepts and principles from microeconomics that guide its organization and
production activities to improve profitability and be able to compete effectively.
A number of highly useful methodologies have been developed based on the concepts
and principles discussed. This text will not address specific techniques for tracking costs
and planning production activities. Readers seeking guidance on these tasks might
consult a text on cost accounting or operations management.Two classic texts on cost
accounting and operations management are by Horngren (1972) and Stevenson (1986),
respectively.
4.1 Average Cost Curves
In Chapter 2 "Key Measures and Relationships", we cited average cost as a key
performance measure in producing a good or service. Average cost reflects the cost on
a per unit basis. A portion of the average cost is the amount of variable costs that can
be assigned to the production unit. The other portion is the allocation of fixed costs
(specifically those fixed costs that are not sunk), apportioned to each production unit.
The average cost generally varies as a function of the production volume per period.
Since fixed costs do not increase with quantity produced, at least in the short run where
production capabilities are relatively set, the portion of the average cost attributable to
fixed cost is very high for small production volume but declines rapidly and then levels
off as the volume increases.
48. 48
The portion of average cost related to the variable cost usually changes less dramatically
in response to production volume than the average fixed cost. In fact, in the example of
the ice cream bar business in Chapter 2 "Key Measures and Relationships", we
assumed the average variable cost of an ice cream bar would remain $0.30 per unit
whether the operation sold a small volume or large volume of ice cream bars. However,
in actual production environments, average variable cost may fluctuate with volume.
At very low production volumes, resources may not be used efficiently, so the variable
cost per unit is higher. For example, suppose the ice cream bar venture operators
purchase those bars wholesale from a vendor who delivers them in a truck with a freezer.
Since the vendor’s charge for ice cream bars must cover the cost of the truck driver and
truck operation, a large delivery that fills the truck is likely to cost less per ice cream bar
than a very small delivery.
At the same time, pushing production levels to the upper limits of an operation’s
capability can result in other inefficiencies and cause the average variable cost to
increase. For example, in order to increase production volume in a factory, it may be
necessary to pay workers to work overtime at a rate 1.5 times their normal pay rate.
Another example is that machines may be overworked to drive higher volume but result
in either less efficiency or higher maintenance cost, which translates into an increase in
average variable cost.
Figure 4.1 "Breakdown of Average Cost Function Into Variable Cost and Fixed Cost
Component" shows a general breakdown of average cost into average fixed cost and
average variable cost. The figure reflects the earlier situations of variable cost
inefficiencies at very low and very high production volumes. Note that even with the
continued decline in the average fixed cost, there is a production level (marked Q*)
where the average total cost is at its lowest value. Economists called the production
volume where average cost is at the lowest value the capacity of the operation.
In conversational language, we often think of capacity of a container as the maximum
volume the container can hold. In that sense of the word, it seems awkward to call the
production level Q* the capacity when the graph indicates that it is possible to produce
49. 49
at higher volume levels but just that the average cost per unit will be higher. However,
even in physics, the volume in a container can be changed by the use of pressure or
temperature, so volume is not limited by the capacity under normal pressures and
temperatures.
Figure 4.1 Breakdown of Average Cost Function Into Variable Cost and Fixed Cost
Component
The production level corresponding to the lowest point on the graph for average cost
indicates the short-run capacity of the business operation.
In the economic sense of the word, we might think of capacity as the volume level where
we have the most efficient operation in terms of average cost. Many businesses can
operate over capacity, up to some effective physical limit, but in so doing will pay for that
supplemental production volume in higher costs, due to needing to employ either more
expensive resources or less productive resources, creating congestion that slows
production, or overusing resources that results in higher maintenance costs per unit.
If the price earned by the business at these overcapacity volumes is sufficiently high, the
firm may realize more profit by operating over capacity than at the capacity point where
total average cost is at its lowest. Similarly, if demand is weak and customers will pay a
price well in excess of average cost only at volumes lower than capacity, the firm will
probably do better by operating below capacity. However, if a firm that is operating well
50. 50
above capacity or well below capacity does not see this as a temporary situation, the
discrepancy suggests that the firm is sized either too small or too large. The firm may be
able to improve profits in future production periods by resizing its operations, which will
readjust the capacity point. If the firm operates in a very competitive market, there may
even be little potential for profit for firms that are not operating near their capacity level.
4.2 Long-Run Average Cost and Scale
In the last chapter, we distinguished short-run demand from long-run demand to reflect
the range of options for consumers. In the short run, consumers were limited in their
choices by their current circumstances of lifestyles, consumption technologies, and
understanding. A long-run time frame was of sufficient length that the consumer had the
ability to alter her lifestyle and technology and to improve her understanding, so as to
result in improved utility of consumption.
There is a similar dichotomy of short-run production decisions and long-run production
decisions for businesses. In the short run, businesses are somewhat limited by their
facilities, skill sets, and technology. In the long run, businesses have sufficient time to
expand, contract, or modify facilities. Businesses can add employees, reduce
employees, or retrain or redeploy employees. They can change technology and the
equipment used to carry out their businesses.
The classification of short-run planning is more an indication of some temporary
constraint on redefining the structure of a firm rather than a period of a specific length.
In fact, there are varying degrees of short run. In a very brief period, say the coming
week or month, there may be very little that most businesses can do. It will take at least
that long to make changes in employees and they probably have contractual obligations
to satisfy. Six months may be long enough to change employment structures and what
supplies a firm uses, but the company is probably still limited to the facilities and
technology they are using.
How long a period is needed until decisions are long term varies by the kind of
organization or industry. A retail outlet might easily totally redefine itself in a matter of
51. 51
months, so for them any decisions going out a year or longer are effectively long-term
decisions. For electricity power generators, it can take 20 years to plan, get approvals,
and construct a new power generation facility, and their long-term period can be in terms
of decades.
One important characteristic that distinguishes short-run production decisions and long-
run production decisions is in the nature of costs. In the short run, there are fixed costs
and variable costs. However, in the long run, since the firm has the flexibility to change
anything about its operations (within the scope of what is technologically possible and
they can afford), all costs in long-run production decisions can be regarded as variable
costs.
Another important distinction between short-run production and long-run production is in
the firm’s ability to alter its capacity. In a decidedly short-run time frame, the firm’s
capacity or point of lowest average cost is effectively fixed. The firm may elect to operate
either under or slightly over their capacity depending on the strength of market demand
but cannot readily optimize production for that selected output level. In the long run, the
firm is able to make decisions that alter its capacity point by resizing operations to where
the firm expects to have the best stream of profits over time.
Because a business has the ability to redesign all of its operations to suit a targeted level
of production, average cost curves for long-run planning are flatter than short-run
average cost curves. If it appears that a low-volume operation would yield the best
returns, the firm can be downsized to remove the cost of excess capacity and arrive at
a lower average cost than would be achievable in the short run. By expanding its
capacity, a firm would be able to perhaps even lower average cost, but certainly avoid
the inefficiencies of being overcapacity, should higher production levels appear to be
better.
One way to think of a long-run average cost curve is that each point on the curve reflects
the lowest possible average cost of an operation resized to be optimal for that level of
production. For example, in Figure 4.2 "Graph of Long-Run Average Cost (LRAC)
Function Shown as the Short-Run Average Cost (SRAC) at Capacity for Different Scales
52. 52
of Operation", the long-run average cost on curve LRAC at a production rate of 1000
units per period is the lowest cost, or cost at the capacity point, for a cost structure
reflected by short-run average cost curve SRAC1. The long-run average cost at a
production rate of 2000 units per production period is the lowest cost for average cost
curve SRAC2 (which has a capacity of 2000). The long-run average cost at a production
rate of 3000 units per production would be the average cost at capacity for SRAC3.
Like short-run average cost curves, long-run average cost curves trend downward at low
target production rates, although the rate of decline in the long-run average cost curve
is somewhat flatter due to the ability to readjust all factors of production. The typical
reason for this declining long-run average cost curve at low production levels is because
there are efficiencies in cost or production that can be exploited for modest increases in
quantity. For example, for a business that is manufacturing major appliances or vehicles
that require several assembly steps, in a larger operation it is possible to assign different
assembly steps to different workers and, via this specialization, speed up the rate of
production over what would be possible if the firm hired the same workers with each
worker performing all assembly steps. As we pointed out in the previous chapter,
customers who buy in large quantities can sometimes buy at a lower per unit price. Since
most firms are buyers as well as sellers, and larger firms will buy in larger quantities,
they can reduce the contribution of acquired parts and materials to the average cost.
Figure 4.2 Graph of Long-Run Average Cost (LRAC) Function Shown as the Short-Run
Average Cost (SRAC) at Capacity for Different Scales of Operation