1. 26%
23%
22%
51%
43%
39%
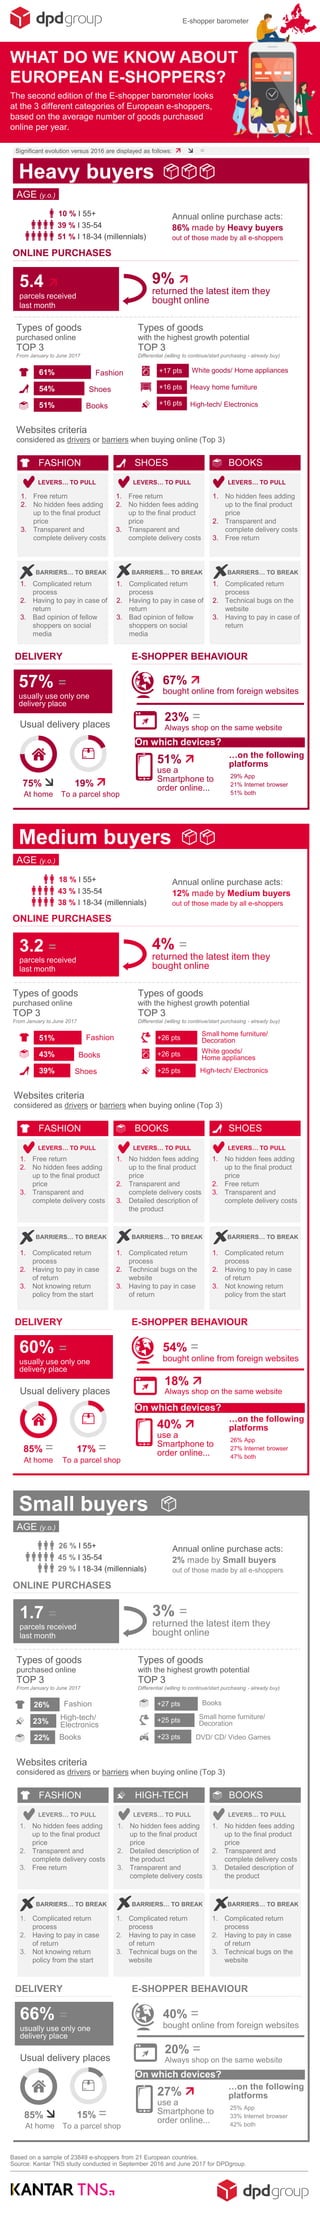
61%
54%
51%
Source: Kantar TNS study conducted in September 2016 and June 2017 for DPDgroup.
Based on a sample of 23849 e-shoppers from 21 European countries.
5.4
parcels received
last month
Heavy buyers
AGE (y.o.)
DELIVERY
9%
returned the latest item they
bought online
Usual delivery places
75%
At home
19%
To a parcel shop
ONLINE PURCHASES
Types of goods
purchased online
TOP 3
From January to June 2017
Types of goods
with the highest growth potential
TOP 3
Differential (willing to continue/start purchasing - already buy)
67%
bought online from foreign websites
51%
use a
Smartphone to
order online...
…on the following
platforms
23% =
Always shop on the same website
On which devices?
E-SHOPPER BEHAVIOUR
57% =
usually use only one
delivery place
Websites criteria
considered as drivers or barriers when buying online (Top 3)
BARRIERS… TO BREAK
LEVERS… TO PULL
BARRIERS… TO BREAK BARRIERS… TO BREAK
WHAT DO WE KNOW ABOUT
EUROPEAN E-SHOPPERS?
51 % I 18-34 (millennials)
10 % I 55+
39 % I 35-54
LEVERS… TO PULL LEVERS… TO PULL
E-shopper barometer
1.7 =
parcels received
last month
Small buyers
AGE (y.o.)
DELIVERY
3% =
returned the latest item they
bought online
Usual delivery places
85%
At home
15% =
To a parcel shop
ONLINE PURCHASES
Books
High-tech/
Electronics
Fashion
Types of goods
purchased online
TOP 3
From January to June 2017
Types of goods
with the highest growth potential
TOP 3
Differential (willing to continue/start purchasing - already buy)
DVD/ CD/ Video Games
Small home furniture/
Decoration
Books
40% =
bought online from foreign websites
27%
use a
Smartphone to
order online...
20% =
Always shop on the same website
On which devices?
E-SHOPPER BEHAVIOUR
66% =
usually use only one
delivery place
Websites criteria
considered as drivers or barriers when buying online (Top 3)
BARRIERS… TO BREAK
LEVERS… TO PULL
BARRIERS… TO BREAK BARRIERS… TO BREAK
LEVERS… TO PULL LEVERS… TO PULL
Annual online purchase acts:
2% made by Small buyers
out of those made by all e-shoppers
3.2 =
parcels received
last month
Medium buyers
AGE (y.o.)
DELIVERY
4% =
returned the latest item they
bought online
Usual delivery places
85% =
At home
17% =
To a parcel shop
ONLINE PURCHASES
Fashion
Books
Shoes
Types of goods
purchased online
TOP 3
From January to June 2017
Types of goods
with the highest growth potential
TOP 3
Differential (willing to continue/start purchasing - already buy)
Small home furniture/
Decoration
White goods/
Home appliances
High-tech/ Electronics
54% =
bought online from foreign websites
40%
use a
Smartphone to
order online...
18%
Always shop on the same website
On which devices?
E-SHOPPER BEHAVIOUR
60% =
usually use only one
delivery place
Websites criteria
considered as drivers or barriers when buying online (Top 3)
BARRIERS… TO BREAK
LEVERS… TO PULL
BARRIERS… TO BREAK BARRIERS… TO BREAK
LEVERS… TO PULL LEVERS… TO PULL
Annual online purchase acts:
12% made by Medium buyers
out of those made by all e-shoppers
+25 pts
+26 pts
+26 pts
+23 pts
+25 pts
+27 pts
Annual online purchase acts:
86% made by Heavy buyers
out of those made by all e-shoppers
The second edition of the E-shopper barometer looks
at the 3 different categories of European e-shoppers,
based on the average number of goods purchased
online per year.
38 % I 18-34 (millennials)
18 % I 55+
43 % I 35-54
29 % I 18-34 (millennials)
26 % I 55+
45 % I 35-54
…on the following
platforms
…on the following
platforms
29% App
21% Internet browser
51% both
47% both
27% Internet browser
26% App
42% both
33% Internet browser
25% App
Books
Shoes
Fashion White goods/ Home appliances
Heavy home furniture
High-tech/ Electronics+16 pts
+16 pts
+17 pts
BOOKSSHOESFASHION
SHOESBOOKSFASHION
BOOKSHIGH-TECHFASHION
1. Complicated return
process
2. Technical bugs on the
website
3. Having to pay in case of
return
1. Complicated return
process
2. Having to pay in case of
return
3. Bad opinion of fellow
shoppers on social
media
1. Complicated return
process
2. Having to pay in case of
return
3. Bad opinion of fellow
shoppers on social
media
1. No hidden fees adding
up to the final product
price
2. Transparent and
complete delivery costs
3. Free return
1. Free return
2. No hidden fees adding
up to the final product
price
3. Transparent and
complete delivery costs
1. Free return
2. No hidden fees adding
up to the final product
price
3. Transparent and
complete delivery costs
1. Complicated return
process
2. Having to pay in case
of return
3. Not knowing return
policy from the start
1. Complicated return
process
2. Technical bugs on the
website
3. Having to pay in case
of return
1. Complicated return
process
2. Having to pay in case
of return
3. Not knowing return
policy from the start
1. No hidden fees adding
up to the final product
price
2. Free return
3. Transparent and
complete delivery costs
1. No hidden fees adding
up to the final product
price
2. Transparent and
complete delivery costs
3. Detailed description of
the product
1. Free return
2. No hidden fees adding
up to the final product
price
3. Transparent and
complete delivery costs
1. Complicated return
process
2. Having to pay in case
of return
3. Technical bugs on the
website
1. Complicated return
process
2. Having to pay in case
of return
3. Technical bugs on the
website
1. Complicated return
process
2. Having to pay in case
of return
3. Not knowing return
policy from the start
1. No hidden fees adding
up to the final product
price
2. Transparent and
complete delivery costs
3. Detailed description of
the product
1. No hidden fees adding
up to the final product
price
2. Detailed description of
the product
3. Transparent and
complete delivery costs
1. No hidden fees adding
up to the final product
price
2. Transparent and
complete delivery costs
3. Free return
Significant evolution versus 2016 are displayed as follows: =