This document is a training manual for Eclipse BIRT (Business Intelligence and Reporting Tools). It provides an overview of BIRT and outlines 22 topics to help users learn how to design reports with BIRT, including introductions to BIRT reports, the anatomy of a report, installing and configuring BIRT, the basic tools in the BIRT Report Designer, different report items, how to create a new project and report connected to a database, and how to view and save a completed report. The manual was prepared by Mian Aasim Mahmood and contains 43 pages of content to guide users through building reports with BIRT.


![Solution Heights (Pvt) Ltd. User Manual Guide of ECLIPSE BIRT (Report Designer)
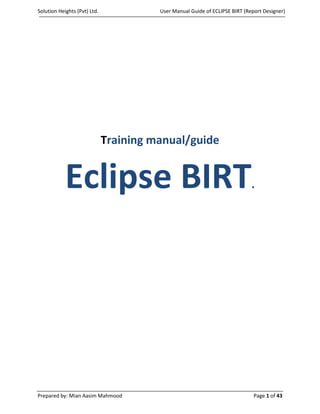
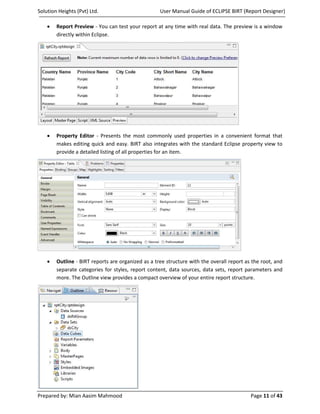
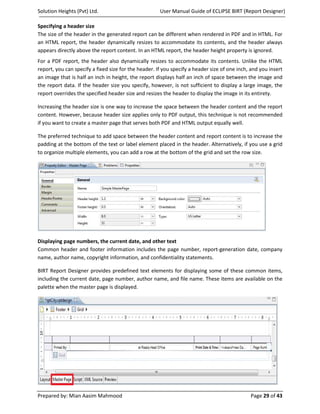
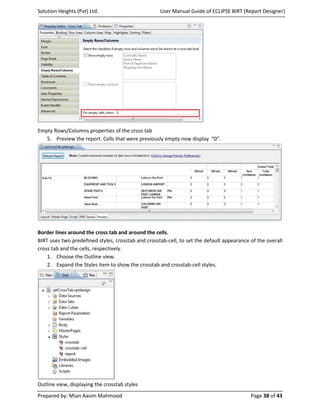
Report Items (Elements).
BIRT provides a variety of report items or Elements for use when creating your report. Report items
appear in the Palette view. Report items include:
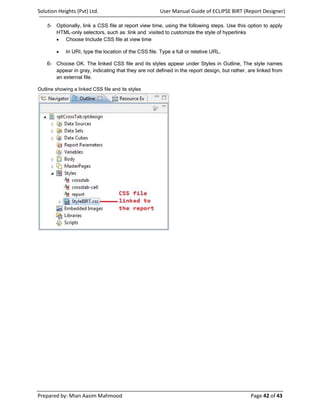
• Label - Label elements are used for displaying static text. As with most report elements, the text
can be externalized for localization and supports such properties as hyperlinking, font sizing, and
highlighting. (Simple piece of text such as "City Name".)
• Text - Displays a multi-line block of text defined within the report. Can contain embedded
formatting and value expressions. Text that can include HTML formatting and computed values.
Used to create headings, form letters, "mail-merge" effects, etc. Use to include richly formatted
text to your report, including the ability to integrate HTML formatting with your dynamic data
• Dynamic Text - Displays a database column that can contain HTML formatted (CLOB) data.
Allows for advanced CLOB data manipulation through expressions. Use to integrate your static
text with dynamic or conditional data.
• Data - Displays a database column or a computed value. Provides formatting. ( data set or
computed value with optional formatting) Data elements are the essential element for
displaying values from data sources. Using the Expression Builder, data values can be altered
and manipulated. For example, if a data set contains a column for first name and another for
last name, using the expression builder you can concatenate the values into one data element.
Use to include data from your connection in the report
dataSetRow["contactLastName"] + ", " + dataSetRow["contactFirstName")
• Image - Any kind of image supported by a web browser. Image elements are used to include
pictures in the report output. BIRT supports retrieving images from a URI, embedding the image
in the design, dynamic images (BLOB) from a data source, and image files in a resource folder.
• Grid - Provides a tabular arrangement of report items, much like an HTML table. Grid elements
act as containers for other report elements and are used to position elements in a logical
manner. Grid elements are configured in tabular format. For example, if your report is displaying
product sales and you want a chart representation to the right of your table data, you would add
a grid element with one row and two columns.
Prepared by: Mian Aasim Mahmood Page 13 of 43](https://image.slidesharecdn.com/manualguideforbirteclipsereportdesigner-120307232523-phpapp02/85/Manual-guide_for_birt_eclipse_report-designer-13-320.jpg)
![Solution Heights (Pvt) Ltd. User Manual Guide of ECLIPSE BIRT (Report Designer)
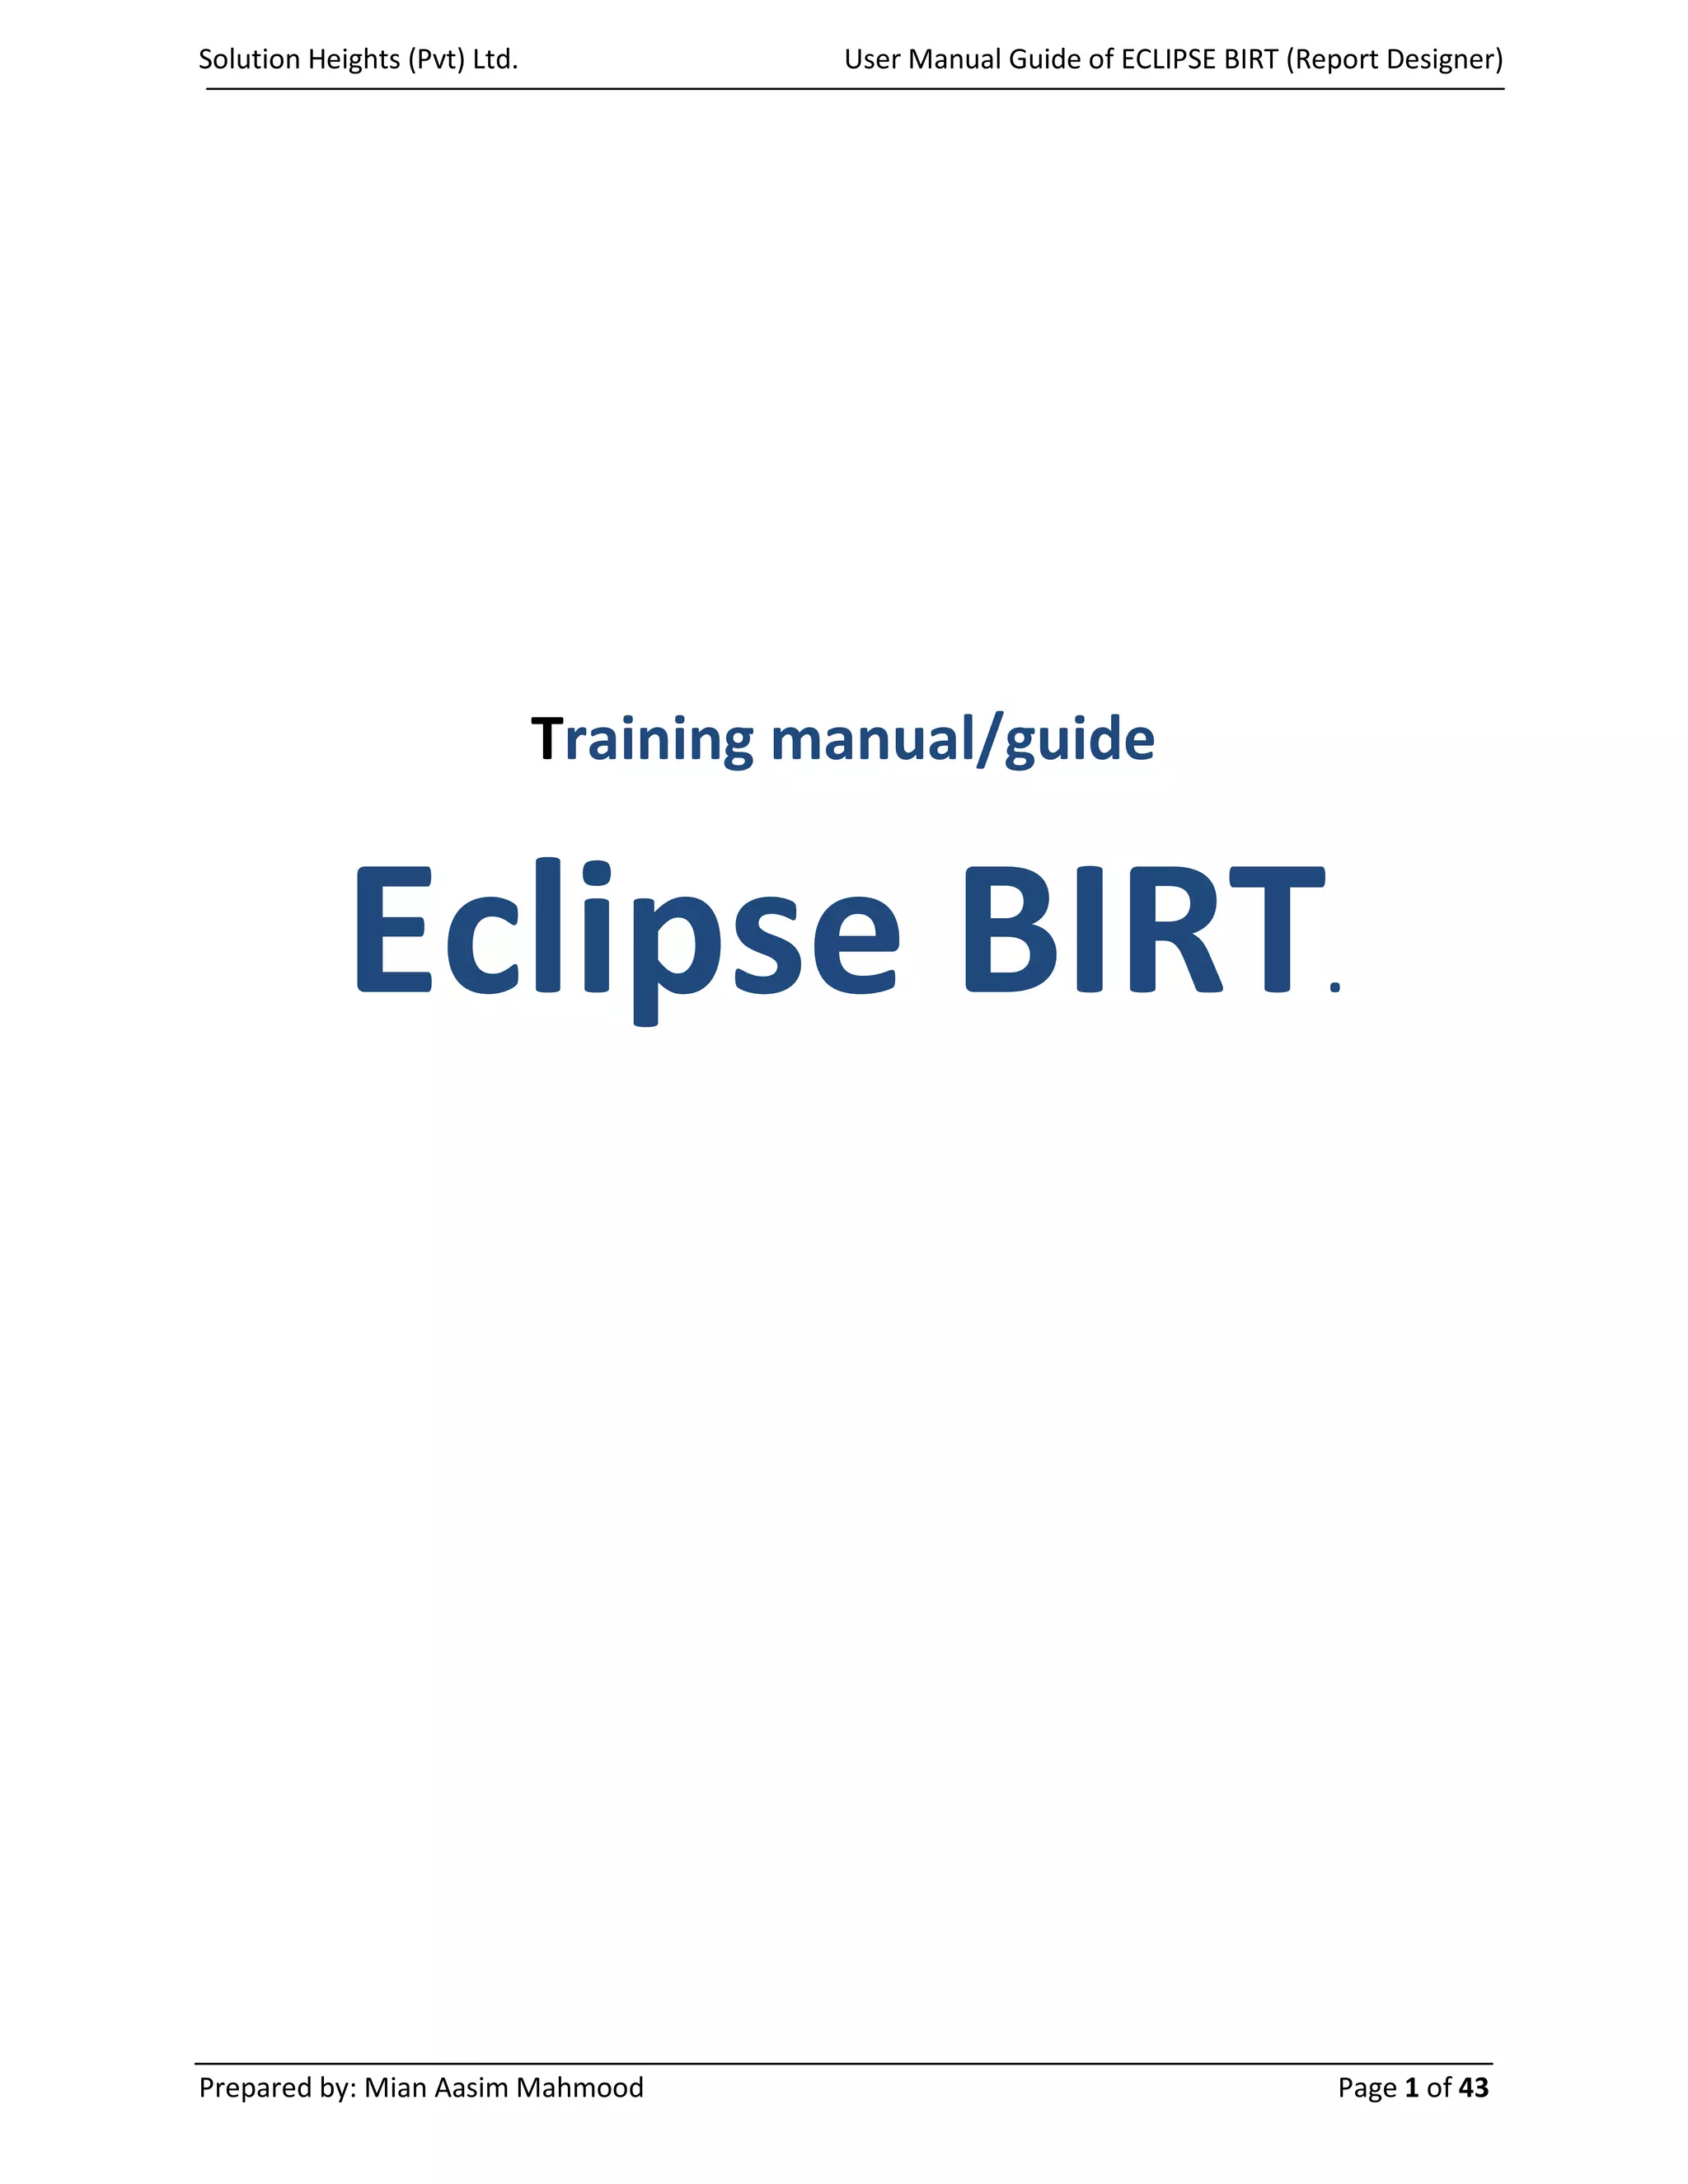
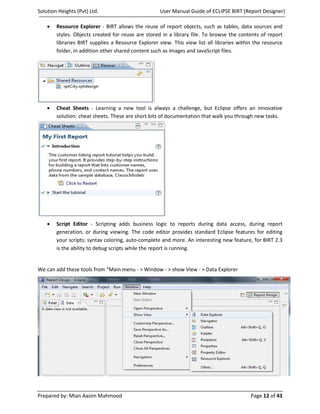
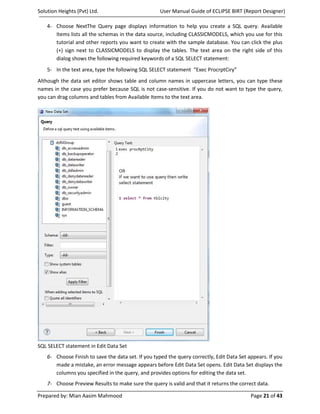
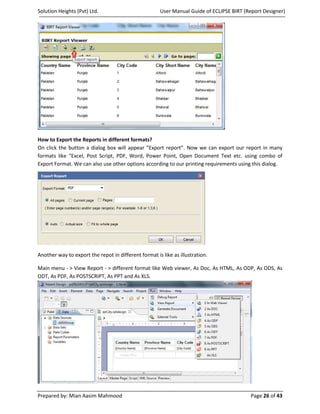
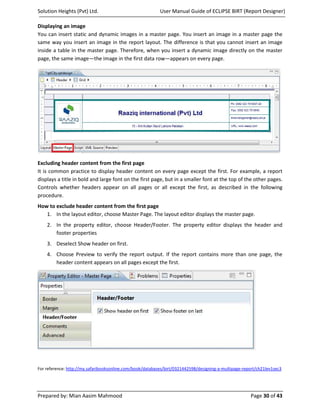
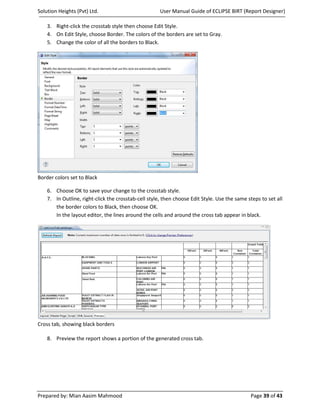
In the layout editor, the table cell in which you dropped the Country Name field contains a data element
that displays [Country Name]. Above this data element is a label element that the layout editor
automatically added to the header row. This label displays the field name as static text. It serves as the
column heading
7- Drag Province Name from Data Explorer, and drop it in the second cell in the detail row
8- Drag City Code, and drop it in the third cell in the detail row.
9- Drag City Short Name, and drop it in the third cell in the detail row.
10- Drag City Name; drop it in the third cell in the detail row,
11- Choose Preview, the tab at the bottom of the layout editor. BIRT Report Designer generates and
displays the report in HTML format, Scroll down to see the entire report
Report
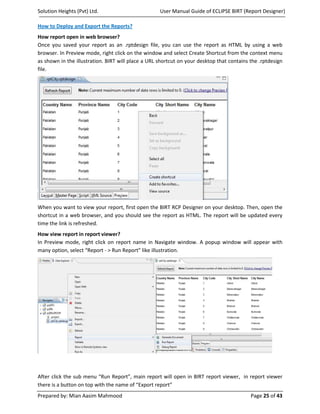
View the Report
Finally, our report is finished. Preview the results by clicking on the Preview tab, which is located along
the bottom of the view. Alternatively, you may select a preview option from the File menu.
Preview of report data
Saving the Report
To save the report, select Save from the File menu. This preserves all the work you've done up to this
point as a .rptdesign file and allows you to resume the report creation at a later time. The .rptdesign file
is also used to generate a report to the user dynamically as will be described in the next section.
Prepared by: Mian Aasim Mahmood Page 24 of 43](https://image.slidesharecdn.com/manualguideforbirteclipsereportdesigner-120307232523-phpapp02/85/Manual-guide_for_birt_eclipse_report-designer-24-320.jpg)
![Solution Heights (Pvt) Ltd. User Manual Guide of ECLIPSE BIRT (Report Designer)
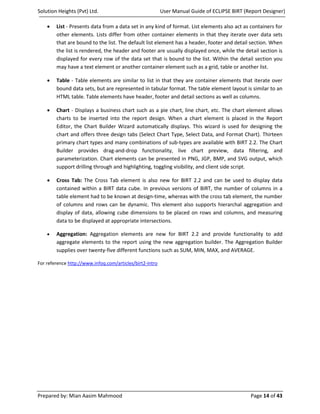
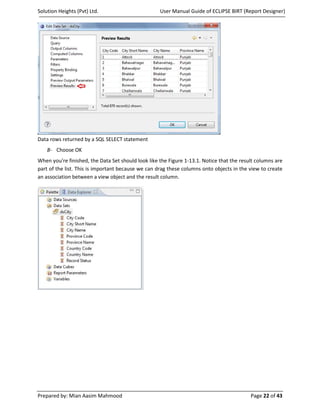
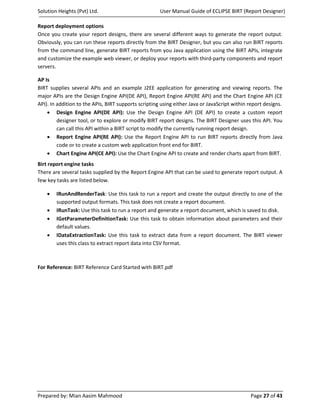
• Choose Finish to save the data set. Edit Data Set displays the columns specified in the query,
and provides options for editing the data set.
• Choose Computed Columns, and then choose New to create a computed field that calculates
required fields.
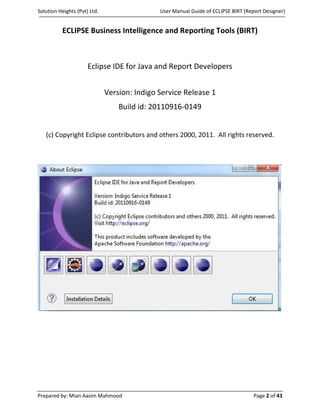
• On New Computed Column, specify the following values,
Dialog box name “New Computed Columns”
a) In Column Name type “Total Container”.
b) In Data Type, select “String”.
c) In Aggregation leave it blank.
d) In Expression type: row["Container Size Name"]
e) Choose OK to save the computed field.
Alternatively, We can open the expression builder to construct the expression by selecting the
appropriate data set fields. data set field names are case-sensitive. in Expression, you typed
row["Container Size Name"].
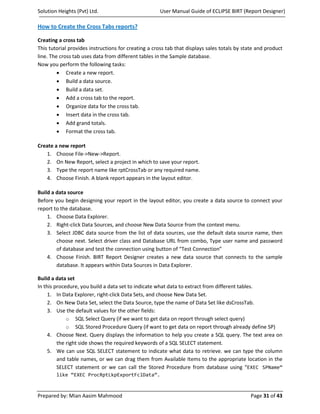
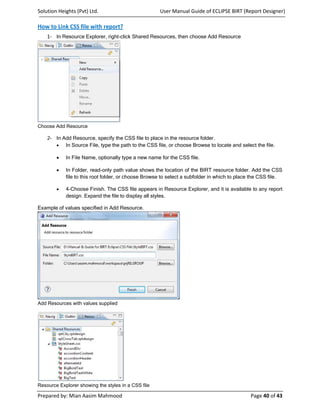
• Choose Preview Results to confirm that the query is valid and that it returns the correct data. If
you created the SELECT statement and computed field correctly, you should see the results in
Preview Result. These are the data rows that the query returns.
Prepared by: Mian Aasim Mahmood Page 32 of 43](https://image.slidesharecdn.com/manualguideforbirteclipsereportdesigner-120307232523-phpapp02/85/Manual-guide_for_birt_eclipse_report-designer-32-320.jpg)


![Eclipse Business Intelligence and Reporting Tools [BIRT] Project](https://cdn.slidesharecdn.com/ss_thumbnails/eclipse-birt-datasheet-120727110444-phpapp02-thumbnail.jpg?width=640&height=640&fit=bounds)


