
Recommended
More Related Content
What's hot
What's hot (14)
Similar to Makam raja 2
Similar to Makam raja 2 (20)
Makam raja 2
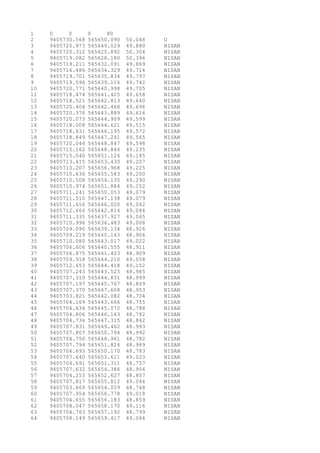
- 1. 1 0 0 0 P0 2 9405730.568 565650.090 50.048 U 3 9405725.973 565649.029 49.880 NISAN 4 9405720.312 565625.892 50.304 NISAN 5 9405719.082 565628.180 50.396 NISAN 6 9405719.211 565632.091 49.869 NISAN 7 9405716.486 565634.329 49.714 NISAN 8 9405719.701 565635.834 49.797 NISAN 9 9405719.596 565639.116 49.742 NISAN 10 9405720.771 565640.998 49.705 NISAN 11 9405718.474 565641.425 49.658 NISAN 12 9405718.521 565642.813 49.640 NISAN 13 9405720.404 565642.468 49.696 NISAN 14 9405720.376 565643.889 49.616 NISAN 15 9405720.073 565644.909 49.599 NISAN 16 9405718.008 565644.621 49.515 NISAN 17 9405718.631 565646.195 49.572 NISAN 18 9405718.849 565647.241 49.565 NISAN 19 9405720.046 565648.847 49.598 NISAN 20 9405715.162 565648.846 49.235 NISAN 21 9405715.040 565651.124 49.185 NISAN 22 9405713.415 565653.430 49.207 NISAN 23 9405710.207 565656.968 49.225 NISAN 24 9405710.636 565655.583 49.200 NISAN 25 9405710.508 565654.135 49.290 NISAN 26 9405710.974 565651.884 49.152 NISAN 27 9405711.241 565650.053 49.079 NISAN 28 9405711.510 565647.138 49.079 NISAN 29 9405711.656 565646.020 49.042 NISAN 30 9405712.666 565642.814 49.084 NISAN 31 9405711.335 565637.927 49.065 NISAN 32 9405710.996 565636.483 49.008 NISAN 33 9405709.090 565639.134 48.926 NISAN 34 9405709.219 565640.143 48.904 NISAN 35 9405710.080 565643.017 49.022 NISAN 36 9405706.606 565640.555 48.911 NISAN 37 9405706.875 565641.403 48.909 NISAN 38 9405709.918 565644.210 49.058 NISAN 39 9405712.653 565644.418 49.152 NISAN 40 9405707.243 565643.525 48.985 NISAN 41 9405707.310 565644.831 48.999 NISAN 42 9405707.197 565645.767 48.869 NISAN 43 9405707.370 565647.608 48.953 NISAN 44 9405703.821 565642.082 48.704 NISAN 45 9405704.169 565643.666 48.755 NISAN 46 9405704.634 565645.072 48.788 NISAN 47 9405704.806 565646.163 48.782 NISAN 48 9405704.736 565647.315 48.862 NISAN 49 9405707.831 565649.462 48.993 NISAN 50 9405707.807 565650.794 48.992 NISAN 51 9405704.750 565648.961 48.782 NISAN 52 9405707.794 565651.824 48.989 NISAN 53 9405704.693 565650.170 48.783 NISAN 54 9405707.640 565653.611 49.023 NISAN 55 9405704.691 565651.311 48.757 NISAN 56 9405707.632 565654.386 48.956 NISAN 57 9405704.253 565652.627 48.807 NISAN 58 9405707.817 565655.812 49.046 NISAN 59 9405703.869 565654.059 48.768 NISAN 60 9405707.954 565656.778 49.018 NISAN 61 9405704.655 565656.183 48.859 NISAN 62 9405708.047 565658.170 49.116 NISAN 63 9405704.763 565657.192 48.799 NISAN 64 9405708.149 565659.417 49.044 NISAN
- 2. 65 9405704.715 565657.999 48.658 NISAN 66 9405708.356 565660.701 49.055 NISAN 67 9405704.871 565658.903 48.636 NISAN 68 9405705.070 565661.892 48.687 NISAN 69 9405704.817 565659.643 48.633 NISAN 70 9405704.894 565661.053 48.626 NISAN 71 9405702.325 565659.431 48.460 NISAN 72 9405704.464 565662.916 48.495 NISAN 73 9405701.787 565658.270 48.644 NISAN 74 9405702.340 565663.905 48.323 NISAN 75 9405701.144 565657.127 48.670 NISAN 76 9405701.310 565662.333 48.283 NISAN 77 9405701.369 565655.884 48.813 NISAN 78 9405700.926 565661.216 48.382 NISAN 79 9405699.665 565653.872 48.530 NISAN 80 9405700.181 565660.293 48.341 NISAN 81 9405701.645 565651.672 48.582 NISAN 82 9405699.468 565658.920 48.438 NISAN 83 9405701.893 565649.794 48.655 NISAN 84 9405697.977 565657.742 48.408 NISAN 85 9405701.720 565648.516 48.680 NISAN 86 9405701.193 565646.432 48.567 NISAN 87 9405701.082 565644.964 48.597 NISAN 88 9405698.584 565647.468 48.546 NISAN 89 9405697.488 565655.717 48.422 NISAN 90 9405697.105 565654.177 48.416 NISAN 91 9405696.498 565652.861 48.396 NISAN 92 9405696.421 565651.624 48.357 NISAN 93 9405695.895 565649.934 48.244 NISAN 94 9405703.744 565666.700 48.581 NISAN 95 9405703.917 565667.978 48.349 NISAN 96 9405706.859 565667.430 48.448 NISAN 97 9405706.484 565666.266 48.573 NISAN 98 9405710.557 565666.234 48.932 NISAN 99 9405710.567 565665.020 48.944 NISAN 100 9405710.632 565663.958 48.969 NISAN 101 9405710.926 565678.885 48.673 NISAN 102 9405712.920 565665.034 49.084 NISAN 103 9405711.001 565677.670 48.742 NISAN 104 9405715.514 565664.284 49.290 NISAN 105 9405715.374 565662.560 49.305 NISAN 106 9405710.917 565676.201 48.707 NISAN 107 9405716.295 565658.094 49.420 NISAN 108 9405711.839 565673.966 48.750 NISAN 109 9405717.980 565656.435 49.360 NISAN 110 9405711.624 565672.203 48.730 NISAN 111 9405711.537 565670.891 48.703 NISAN 112 9405719.494 565660.627 49.408 NISAN 113 9405720.621 565661.768 49.435 NISAN 114 9405711.329 565669.657 48.616 NISAN 115 9405718.338 565661.918 49.463 NISAN 116 9405716.510 565669.979 49.331 NISAN 117 9405716.430 565668.632 49.350 NISAN 118 9405718.376 565667.156 49.487 NISAN 119 9405726.409 565661.982 49.650 NISAN 120 9405725.995 565663.575 49.678 NISAN 121 9405728.930 565665.233 49.819 NISAN 122 9405729.127 565663.907 49.971 NISAN 123 9405729.365 565662.778 49.708 NISAN 124 9405729.476 565661.459 49.641 NISAN 125 9405732.149 565663.629 49.650 NISAN 126 9405732.262 565661.733 49.747 NISAN 127 9405733.632 565659.638 49.749 NISAN 128 9405730.951 565658.914 49.867 NISAN
- 3. 129 9405730.422 565657.118 49.990 NISAN 130 9405730.877 565655.427 49.923 NISAN 131 9405733.920 565658.161 49.787 NISAN 132 9405731.470 565653.520 49.973 NISAN 133 9405735.694 565656.900 49.871 NISAN 134 9405736.209 565654.968 50.018 NISAN 135 9405729.350 565654.287 49.978 NISAN 136 9405736.313 565654.072 49.989 NISAN 137 9405729.763 565651.742 50.052 NISAN 138 9405736.462 565653.562 50.020 NISAN 139 9405727.572 565651.982 50.025 NISAN 140 9405736.352 565652.637 50.112 NISAN 141 9405736.406 565651.628 50.110 NISAN 142 9405733.632 565657.840 49.786 NISAN 143 9405733.496 565656.794 49.814 NISAN 144 9405733.597 565655.937 49.918 NISAN 145 9405733.553 565654.992 49.902 NISAN 146 9405733.792 565653.511 49.990 NISAN 147 9405733.957 565652.032 50.125 NISAN 148 9405734.200 565650.633 50.124 NISAN 149 9405736.001 565649.222 50.206 NISAN 150 9405735.842 565647.176 50.229 NISAN 151 9405734.668 565645.208 50.379 NISAN 152 9405733.365 565643.027 50.338 NISAN 153 9405733.658 565639.532 50.639 NISAN 154 9405734.959 565638.214 50.909 NISAN 155 9405735.208 565637.563 50.873 NISAN 156 9405735.627 565636.677 50.886 NISAN 157 9405734.640 565627.972 51.557 NISAN 158 9405734.801 565629.496 51.309 NISAN 159 9405735.021 565630.760 51.321 NISAN 160 9405735.237 565632.193 51.224 NISAN 161 9405735.189 565633.986 50.949 NISAN 162 9405734.709 565672.512 49.416 P1 163 9405731.087 565676.649 49.477 BSP1BSP1 164 9405732.030 565667.211 49.508 NISAN 165 9405735.640 565667.774 49.282 NISAN 166 9405735.568 565668.919 49.243 NISAN 167 9405732.204 565670.035 49.348 NISAN 168 9405732.317 565671.969 49.394 NISAN 169 9405729.346 565670.866 49.659 NISAN 170 9405729.364 565671.967 49.687 NISAN 171 9405729.550 565673.576 49.545 NISAN 172 9405726.434 565672.027 49.675 NISAN 173 9405726.592 565670.857 49.674 NISAN 174 9405720.834 565666.717 49.604 NISAN 175 9405734.544 565671.283 49.366 NISAN 176 9405735.734 565674.642 49.236 NISAN 177 9405736.625 565676.511 49.349 NISAN 178 9405737.298 565678.265 49.290 NISAN 179 9405737.022 565679.533 49.268 NISAN 180 9405736.809 565680.288 49.278 NISAN 181 9405738.705 565680.360 49.473 NISAN 182 9405738.587 565681.634 49.482 NISAN 183 9405735.918 565681.889 49.408 NISAN 184 9405735.753 565683.892 49.531 NISAN 185 9405738.407 565684.336 49.531 NISAN 186 9405735.668 565685.590 49.611 NISAN 187 9405738.534 565685.355 49.592 NISAN 188 9405738.129 565686.491 49.719 NISAN 189 9405739.755 565687.967 49.792 NISAN 190 9405742.848 565687.878 49.866 NISAN 191 9405742.018 565688.917 49.736 NISAN 192 9405740.980 565690.321 49.833 NISAN
- 4. 193 9405740.755 565691.433 49.869 NISAN 194 9405739.704 565693.198 49.975 NISAN 195 9405737.227 565691.142 49.705 NISAN 196 9405737.307 565689.631 49.897 NISAN 197 9405737.154 565688.257 49.839 NISAN 198 9405735.658 565687.917 49.603 NISAN 199 9405731.915 565679.830 49.441 NISAN 200 9405731.749 565681.308 49.385 NISAN 201 9405732.664 565682.909 49.418 NISAN 202 9405732.102 565685.008 49.540 NISAN 203 9405728.730 565683.377 49.502 NISAN 204 9405732.109 565686.240 49.546 NISAN 205 9405731.948 565687.398 49.476 NISAN 206 9405729.093 565687.033 49.861 NISAN 207 9405728.775 565688.503 49.600 NISAN 208 9405725.891 565687.861 49.525 NISAN 209 9405727.092 565689.561 49.615 NISAN 210 9405729.451 565690.459 49.705 NISAN 211 9405732.297 565690.175 49.732 NISAN 212 9405732.250 565688.742 49.706 NISAN 213 9405732.379 565691.506 49.756 NISAN 214 9405732.171 565692.285 49.701 NISAN 215 9405729.385 565690.734 49.727 NISAN 216 9405726.545 565690.624 49.670 NISAN 217 9405726.685 565691.916 49.660 NISAN 218 9405723.998 565690.153 49.470 NISAN 219 9405723.617 565691.412 49.492 NISAN 220 9405723.737 565692.964 49.695 NISAN 221 9405723.676 565694.140 49.640 NISAN 222 9405721.300 565695.291 49.185 NISAN 223 9405720.834 565694.305 49.298 NISAN 224 9405725.703 565697.370 49.341 NISAN 225 9405725.524 565695.541 49.524 NISAN 226 9405726.326 565693.684 49.950 NISAN 227 9405728.981 565692.662 49.832 NISAN 228 9405729.072 565694.058 49.613 NISAN 229 9405728.432 565695.406 49.526 NISAN 230 9405731.805 565694.748 49.682 NISAN 231 9405731.880 565693.601 49.792 NISAN 232 9405732.189 565692.077 49.736 NISAN 233 9405734.604 565694.629 49.491 NISAN 234 9405737.233 565695.636 49.588 NISAN 235 9405739.702 565693.327 49.962 NISAN 236 9405740.670 565695.156 49.887 NISAN 237 9405742.227 565696.839 49.929 NISAN 238 9405740.705 565698.320 49.741 NISAN 239 9405737.930 565697.756 49.514 NISAN 240 9405737.951 565698.738 49.518 NISAN 241 9405737.253 565695.712 49.576 NISAN 242 9405734.981 565697.852 49.542 NISAN 243 9405735.163 565699.689 49.505 NISAN 244 9405735.499 565700.724 49.379 NISAN 245 9405735.970 565702.384 49.378 NISAN 246 9405736.757 565704.643 49.483 NISAN 247 9405737.084 565707.101 48.905 NISAN 248 9405739.314 565708.631 48.838 NISAN 249 9405739.929 565704.763 49.314 NISAN 250 9405742.799 565706.427 49.308 NISAN 251 9405742.942 565705.154 49.471 NISAN 252 9405743.628 565703.835 49.484 NISAN 253 9405743.150 565702.526 49.531 NISAN 254 9405742.398 565701.095 49.614 NISAN 255 9405740.209 565701.894 49.513 NISAN 256 9405740.316 565699.999 49.594 NISAN
- 5. 257 9405740.692 565698.261 49.736 NISAN 258 9405742.215 565696.771 49.911 NISAN 259 9405740.078 565696.810 49.783 NISAN 260 9405737.771 565699.577 49.468 NISAN 261 9405733.572 565708.976 48.919 NISAN 262 9405730.518 565710.025 48.794 NISAN 263 9405731.597 565707.073 48.971 NISAN 264 9405728.533 565707.728 49.206 NISAN 265 9405728.512 565706.456 49.214 NISAN 266 9405731.493 565705.797 49.056 NISAN 267 9405730.631 565704.908 49.152 NISAN 268 9405731.135 565703.712 49.340 NISAN 269 9405733.971 565704.238 49.219 NISAN 270 9405733.802 565705.545 49.168 NISAN 271 9405735.482 565706.409 49.078 NISAN 272 9405733.178 565702.375 49.578 NISAN 273 9405732.977 565701.092 49.610 NISAN 274 9405729.491 565699.747 49.439 NISAN 275 9405728.614 565698.168 49.423 NISAN 276 9405726.763 565699.506 49.402 NISAN 277 9405726.397 565700.645 49.492 NISAN 278 9405725.409 565701.976 49.534 NISAN 279 9405725.139 565702.694 49.517 NISAN 280 9405725.969 565704.040 49.520 NISAN 281 9405726.755 565702.842 49.384 NISAN 282 9405728.040 565702.086 49.385 NISAN 283 9405730.875 565703.895 49.261 NISAN 284 9405731.086 565705.264 49.108 NISAN 285 9405726.248 565705.282 49.544 NISAN 286 9405740.793 565719.591 48.830 NISAN 287 9405740.268 565717.416 48.873 NISAN 288 9405740.415 565715.661 48.763 NISAN 289 9405743.085 565718.642 48.836 NISAN 290 9405744.412 565716.701 48.847 NISAN 291 9405747.224 565716.959 48.986 NISAN 292 9405747.098 565715.648 48.949 NISAN 293 9405744.679 565715.145 48.725 NISAN 294 9405744.234 565714.078 48.809 NISAN 295 9405742.365 565714.548 48.708 NISAN 296 9405743.437 565713.387 48.839 NISAN 297 9405743.663 565711.986 48.744 NISAN 298 9405740.957 565711.438 48.825 NISAN 299 9405740.469 565712.694 48.913 NISAN 300 9405740.323 565713.779 48.735 NISAN 301 9405740.635 565715.437 48.802 NISAN 302 9405739.178 565710.599 48.911 NISAN 303 9405734.892 565722.797 48.835 NISAN 304 9405735.549 565718.539 49.208 NISAN 305 9405733.005 565719.262 49.063 NISAN 306 9405733.362 565717.377 49.264 NISAN 307 9405732.663 565716.548 49.269 NISAN 308 9405735.486 565715.811 49.186 NISAN 309 9405735.129 565714.388 49.282 NISAN 310 9405730.815 565715.395 49.358 NISAN 311 9405730.653 565714.313 49.318 NISAN 312 9405730.219 565713.176 49.131 NISAN 313 9405734.560 565712.297 48.747 NISAN 314 9405685.554 565651.150 47.631 P2 315 9405681.709 565650.388 47.549 BSP2BSP2 316 9405653.734 565667.201 44.679 P3 317 9405659.219 565664.410 44.965 BSP3BSP3 318 9405667.606 565659.565 46.403 SRBAGUNA 319 9405661.501 565663.019 45.397 SRBAGUNA 320 9405659.728 565660.119 45.001 SRBAGUNA
- 6. 321 9405649.865 565666.151 44.537 SRBAGUNA 322 9405637.020 565674.593 43.617 SRBAGUNA 323 9405638.588 565677.232 43.614 SRBAGUNA 324 9405644.775 565673.363 44.081 SRBAGUNA 325 9405649.037 565678.743 44.481 SRBAGUNA 326 9405652.083 565671.158 44.702 SRBAGUNA 327 9405661.259 565670.758 44.879 SRBAGUNA 328 9405658.179 565664.870 44.826 SRBAGUNA 329 9405665.140 565668.563 45.426 SRBAGUNA 330 9405671.342 565664.841 46.547 SRBAGUNA 331 9405669.477 565661.407 46.604 SRBAGUNA
- 7. 321 9405649.865 565666.151 44.537 SRBAGUNA 322 9405637.020 565674.593 43.617 SRBAGUNA 323 9405638.588 565677.232 43.614 SRBAGUNA 324 9405644.775 565673.363 44.081 SRBAGUNA 325 9405649.037 565678.743 44.481 SRBAGUNA 326 9405652.083 565671.158 44.702 SRBAGUNA 327 9405661.259 565670.758 44.879 SRBAGUNA 328 9405658.179 565664.870 44.826 SRBAGUNA 329 9405665.140 565668.563 45.426 SRBAGUNA 330 9405671.342 565664.841 46.547 SRBAGUNA 331 9405669.477 565661.407 46.604 SRBAGUNA