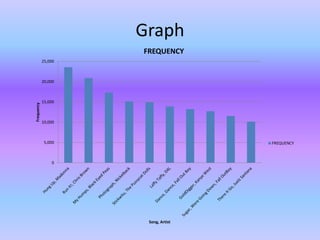
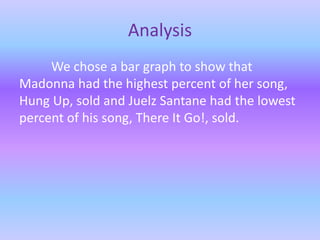
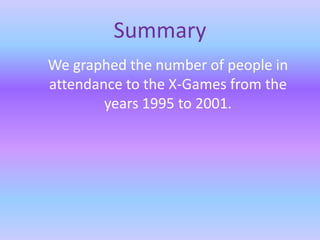
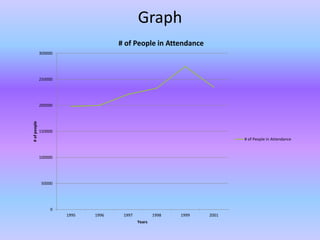
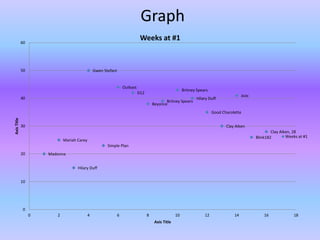
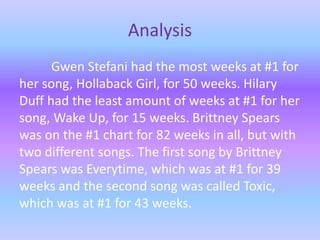
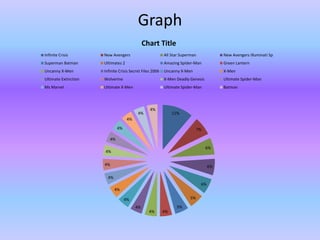
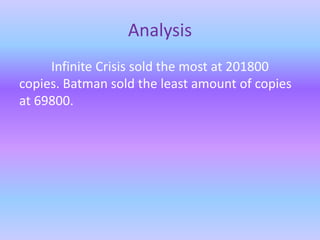
The document contains summaries and graphs analyzing data from various sources including iTunes songs, X Games attendance, MTV artists, and comic books. Graphs included a bar graph of iTunes song downloads, a line graph of X Games attendance by year, a scatter plot of artists' time at #1 on MTV, and a pie chart showing percentages of comic book sales. The graphs visually compared metrics like song downloads, attendance numbers, weeks at #1, and copies sold across items being analyzed.