Download to read offline


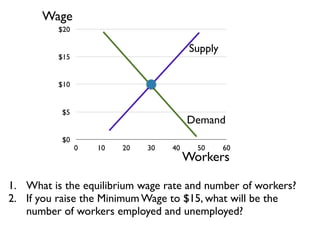
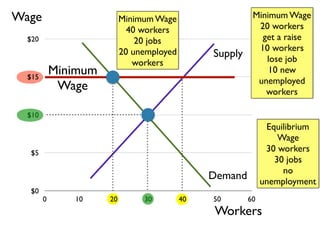


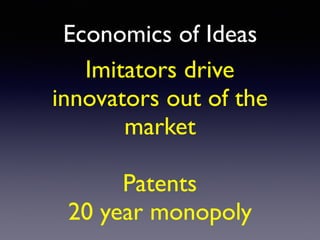


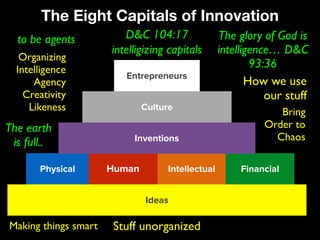


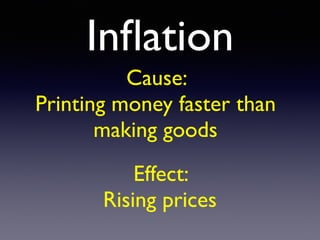


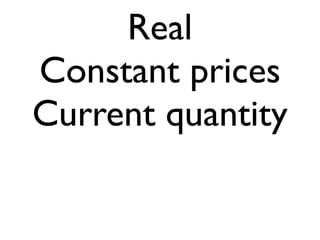
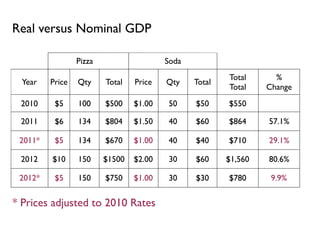
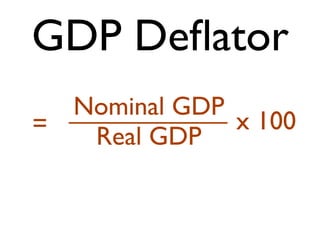
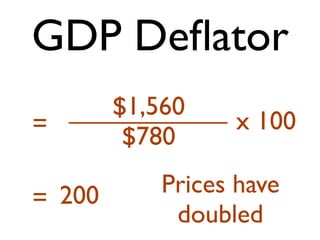

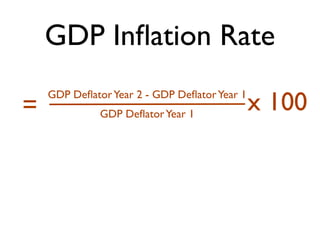
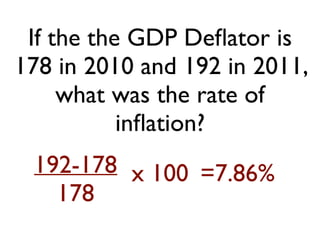

The document summarizes key concepts in macroeconomics including: - Equilibrium models of supply, demand, and minimum wage rates and their impact on employment levels. - The rule of 70s for calculating doubling time of values growing at a compound rate. - Factors that influence innovation including incentives, creativity, and intellectual/physical/financial capital. - Definitions and calculations for GDP, GDP per capita, nominal vs real GDP, GDP deflator, inflation rates, and using base years to adjust for inflation.


