SlideShare a Scribd company logo
1 of 11
Descriptive StatisticsNMinimumMaximumMeanStd. Deviationsixtypercent5130.00150.00142.00008.36660fiftypercent5120.00130.00126.00005.47723Valid N (listwise)5<br />Descriptive StatisticsNMinimumMaximumMeanStd. Deviationsixtypercent5130.00150.00142.00008.36660fiftypercent595.00140.00121.000018.16590Valid N (listwise)5<br />Descriptive StatisticsNMinimumMaximumMeanStd. Deviationsixtypercent5120.00150.00136.000011.40175fiftypercent590.00110.0099.00007.41620Valid N (listwise)5<br />Descriptive StatisticsNMinimumMaximumMeanStd. Deviationsixtypercent5100.00140.00126.000016.73320fiftypercent590.00120.00101.000011.40175Valid N (listwise)5<br />Descriptive StatisticsNMinimumMaximumMeanStd. Deviationsixtypercent5140.00150.00145.00005.00000fiftypercent5100.00130.00120.000012.24745Valid N (listwise)5<br />Descriptive StatisticsNMinimumMaximumMeanStd. Deviationsixtypercent5130.00150.00142.00008.36660fiftypercent5110.00130.00122.00008.36660Valid N (listwise)5<br />Descriptive StatisticsNMinimumMaximumMeanStd. Deviationsixtypercent5140.00150.00145.00005.00000fiftypercent5100.00140.00118.000014.83240Valid N (listwise)5<br />Descriptive StatisticsNMinimumMaximumMeanStd. Deviationsixtypercent5135.00150.00142.00005.70088fiftypercent5110.00130.00120.00007.07107Valid N (listwise)5<br />Descriptive StatisticsNMinimumMaximumMeanStd. Deviationsixtypercent5120.00150.00139.000011.40175fiftypercent5120.00140.00130.00007.90569Valid N (listwise)5<br />Descriptive StatisticsNMinimumMaximumMeanStd. Deviationsixtypercent595.00150.00114.000024.84955fiftypercent585.00120.0099.000015.16575Valid N (listwise)5<br />Descriptive StatisticsNMinimumMaximumMeanStd. Deviationsixtypercent5130.00150.00143.00008.36660fiftypercent595.00140.00120.000017.67767Valid N (listwise)5<br />Descriptive StatisticsNMinimumMaximumMeanStd. Deviationsixtypercent5135.00150.00143.00006.70820fiftypercent5120.00130.00127.00004.47214Valid N (listwise)5<br />One-Sample StatisticsNMeanStd. DeviationStd. Error Meansixtypercent5143.00006.708203.00000fiftypercent5127.00004.472142.00000<br />One-Sample TestTest Value = 0                                       95% Confidence Interval of the DifferencetdfSig. (2-tailed)Mean DifferenceLowerUppersixtypercent47.6674.000143.00000134.6707151.3293fiftypercent63.5004.000127.00000121.4471132.5529<br />One-Sample StatisticsNMeanStd. DeviationStd. Error Meansixtypercent5142.00008.366603.74166fiftypercent5121.000018.165908.12404<br />One-Sample TestTest Value = 0                                       95% Confidence Interval of the DifferencetdfSig. (2-tailed)Mean DifferenceLowerUppersixtypercent37.9514.000142.00000131.6115152.3885fiftypercent14.8944.000121.0000098.4441143.5559<br />One-Sample StatisticsNMeanStd. DeviationStd. Error Meansixtypercent5136.000011.401755.09902fiftypercent599.00007.416203.31662<br />One-Sample TestTest Value = 0                                       95% Confidence Interval of the DifferencetdfSig. (2-tailed)Mean DifferenceLowerUppersixtypercent26.6724.000136.00000121.8429150.1571fiftypercent29.8504.00099.0000089.7916108.2084<br />One-Sample StatisticsNMeanStd. DeviationStd. Error Meansixtypercent5126.000016.733207.48331fiftypercent5101.000011.401755.09902<br />One-Sample TestTest Value = 0                                       95% Confidence Interval of the DifferencetdfSig. (2-tailed)Mean DifferenceLowerUppersixtypercent16.8374.000126.00000105.2230146.7770fiftypercent19.8084.000101.0000086.8429115.1571<br />Descriptive StatisticsNMinimumMaximumMeanStd. Deviationsixtypercent5130.00150.00142.00008.36660fiftypercent5120.00130.00126.00005.47723Valid N (listwise)5<br />One-Sample StatisticsNMeanStd. DeviationStd. Error Meansixtypercent5145.00005.000002.23607fiftypercent5120.000012.247455.47723<br />One-Sample TestTest Value = 0                                       95% Confidence Interval of the DifferencetdfSig. (2-tailed)Mean DifferenceLowerUppersixtypercent64.8464.000145.00000138.7917151.2083fiftypercent21.9094.000120.00000104.7928135.2072<br />One-Sample StatisticsNMeanStd. DeviationStd. Error Meansixtypercent5142.00008.366603.74166fiftypercent5122.00008.366603.74166<br />One-Sample TestTest Value = 0                                       95% Confidence Interval of the DifferencetdfSig. (2-tailed)Mean DifferenceLowerUppersixtypercent37.9514.000142.00000131.6115152.3885fiftypercent32.6064.000122.00000111.6115132.3885<br />One-Sample StatisticsNMeanStd. DeviationStd. Error Meansixtypercent5145.00005.000002.23607fiftypercent5118.000014.832406.63325<br />One-Sample TestTest Value = 0                                       95% Confidence Interval of the DifferencetdfSig. (2-tailed)Mean DifferenceLowerUppersixtypercent64.8464.000145.00000138.7917151.2083fiftypercent17.7894.000118.0000099.5831136.4169<br />One-Sample StatisticsNMeanStd. DeviationStd. Error Meansixtypercent5142.00005.700882.54951fiftypercent5120.00007.071073.16228<br />One-Sample TestTest Value = 0                                       95% Confidence Interval of the DifferencetdfSig. (2-tailed)Mean DifferenceLowerUppersixtypercent55.6974.000142.00000134.9214149.0786fiftypercent37.9474.000120.00000111.2201128.7799<br />One-Sample StatisticsNMeanStd. DeviationStd. Error Meansixtypercent5139.000011.401755.09902fiftypercent5130.00007.905693.53553<br />One-Sample TestTest Value = 0                                       95% Confidence Interval of the DifferencetdfSig. (2-tailed)Mean DifferenceLowerUppersixtypercent27.2604.000139.00000124.8429153.1571fiftypercent36.7704.000130.00000120.1838139.8162<br />One-Sample StatisticsNMeanStd. DeviationStd. Error Meansixtypercent5114.000024.8495511.11306fiftypercent599.000015.165756.78233<br />One-Sample TestTest Value = 0                                       95% Confidence Interval of the DifferencetdfSig. (2-tailed)Mean DifferenceLowerUppersixtypercent10.2584.001114.0000083.1452144.8548fiftypercent14.5974.00099.0000080.1692117.8308<br />One-Sample StatisticsNMeanStd. DeviationStd. Error Meansixtypercent5143.00008.366603.74166fiftypercent5120.000017.677677.90569<br />One-Sample TestTest Value = 0                                       95% Confidence Interval of the DifferencetdfSig. (2-tailed)Mean DifferenceLowerUppersixtypercent38.2184.000143.00000132.6115153.3885fiftypercent15.1794.000120.0000098.0503141.9497<br />One-Sample TestTest Value = 0                                       95% Confidence Interval of the DifferencetdfSig. (2-tailed)Mean DifferenceLowerUppersixtypercent37.9514.000142.00000131.6115152.3885fiftypercent14.8944.000121.0000098.4441143.5559<br />One-Sample StatisticsNMeanStd. DeviationStd. Error Meansixtypercent5136.000011.401755.09902fiftypercent599.00007.416203.31662<br />One-Sample TestTest Value = 0                                       95% Confidence Interval of the DifferencetdfSig. (2-tailed)Mean DifferenceLowerUppersixtypercent26.6724.000136.00000121.8429150.1571fiftypercent29.8504.00099.0000089.7916108.2084<br />One-Sample StatisticsNMeanStd. DeviationStd. Error Meansixtypercent5126.000016.733207.48331fiftypercent5101.000011.401755.09902<br />One-Sample StatisticsNMeanStd. DeviationStd. Error Meansixtypercent5143.00006.708203.00000fiftypercent5127.00004.472142.00000<br />One-Sample TestTest Value = 0                                       95% Confidence Interval of the DifferencetdfSig. (2-tailed)Mean DifferenceLowerUppersixtypercent47.6674.000143.00000134.6707151.3293fiftypercent63.5004.000127.00000121.4471132.5529<br />
Lyn
Lyn
Lyn
Lyn
Lyn
Lyn
Lyn
Lyn
Lyn
Lyn

More Related Content

Similar to Lyn

LVTS Advanced matching matching concept for CDSEM
LVTS Advanced matching matching concept for CDSEMLVTS Advanced matching matching concept for CDSEM
LVTS Advanced matching matching concept for CDSEM
Vladislav Kaplan
 
presentation in 1000 Genomes Phase2 meeting
presentation in 1000 Genomes Phase2 meetingpresentation in 1000 Genomes Phase2 meeting
presentation in 1000 Genomes Phase2 meeting
Jin Yu
 
InstructionsView CAAE Stormwater video Too Big for Our Ditches.docx
InstructionsView CAAE Stormwater video Too Big for Our Ditches.docxInstructionsView CAAE Stormwater video Too Big for Our Ditches.docx
InstructionsView CAAE Stormwater video Too Big for Our Ditches.docx
dirkrplav
 
Project Week 71. Both graphs shows a.docx
Project Week 71. Both graphs shows a.docxProject Week 71. Both graphs shows a.docx
Project Week 71. Both graphs shows a.docx
wkyra78
 

Similar to Lyn (20)

Interprertation of statistics
Interprertation of statisticsInterprertation of statistics
Interprertation of statistics
 
Assement1
Assement1Assement1
Assement1
 
Melda Elmas-Project1-ppt.pptx
Melda Elmas-Project1-ppt.pptxMelda Elmas-Project1-ppt.pptx
Melda Elmas-Project1-ppt.pptx
 
The Data of an Observational Study Designed to Compare the Effectiveness of a...
The Data of an Observational Study Designed to Compare the Effectiveness of a...The Data of an Observational Study Designed to Compare the Effectiveness of a...
The Data of an Observational Study Designed to Compare the Effectiveness of a...
 
Fandamental Statistics and Data Science Stock_price_analysis_OESON_P1.pptx
Fandamental Statistics and Data Science Stock_price_analysis_OESON_P1.pptxFandamental Statistics and Data Science Stock_price_analysis_OESON_P1.pptx
Fandamental Statistics and Data Science Stock_price_analysis_OESON_P1.pptx
 
MKT 798 (Zheng, Mandi, Mei)
MKT 798 (Zheng, Mandi, Mei)MKT 798 (Zheng, Mandi, Mei)
MKT 798 (Zheng, Mandi, Mei)
 
Aug2014 use cases combined
Aug2014 use cases combinedAug2014 use cases combined
Aug2014 use cases combined
 
SAS Day Poster 2016
SAS Day Poster 2016SAS Day Poster 2016
SAS Day Poster 2016
 
LVTS Advanced matching matching concept for CDSEM
LVTS Advanced matching matching concept for CDSEMLVTS Advanced matching matching concept for CDSEM
LVTS Advanced matching matching concept for CDSEM
 
2. intro. to six sigma
2. intro. to six sigma2. intro. to six sigma
2. intro. to six sigma
 
Assignment
AssignmentAssignment
Assignment
 
Cross validation
Cross validationCross validation
Cross validation
 
4. Update on non-invasive prenatal testing
4. Update on non-invasive prenatal testing4. Update on non-invasive prenatal testing
4. Update on non-invasive prenatal testing
 
Uji bivariate variabel spearman
Uji bivariate variabel spearmanUji bivariate variabel spearman
Uji bivariate variabel spearman
 
presentation in 1000 Genomes Phase2 meeting
presentation in 1000 Genomes Phase2 meetingpresentation in 1000 Genomes Phase2 meeting
presentation in 1000 Genomes Phase2 meeting
 
InstructionsView CAAE Stormwater video Too Big for Our Ditches.docx
InstructionsView CAAE Stormwater video Too Big for Our Ditches.docxInstructionsView CAAE Stormwater video Too Big for Our Ditches.docx
InstructionsView CAAE Stormwater video Too Big for Our Ditches.docx
 
Tugas Regresi 2
Tugas Regresi 2Tugas Regresi 2
Tugas Regresi 2
 
Friedman-SPSS.docx
Friedman-SPSS.docxFriedman-SPSS.docx
Friedman-SPSS.docx
 
Normalitas.docx
Normalitas.docxNormalitas.docx
Normalitas.docx
 
Project Week 71. Both graphs shows a.docx
Project Week 71. Both graphs shows a.docxProject Week 71. Both graphs shows a.docx
Project Week 71. Both graphs shows a.docx
 

Lyn

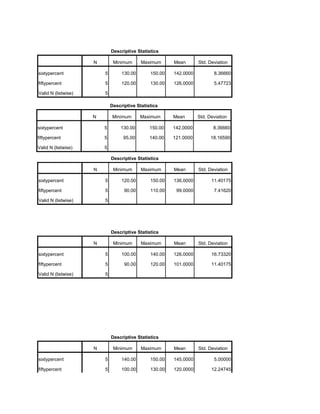
  • 1. Descriptive StatisticsNMinimumMaximumMeanStd. Deviationsixtypercent5130.00150.00142.00008.36660fiftypercent5120.00130.00126.00005.47723Valid N (listwise)5<br />Descriptive StatisticsNMinimumMaximumMeanStd. Deviationsixtypercent5130.00150.00142.00008.36660fiftypercent595.00140.00121.000018.16590Valid N (listwise)5<br />Descriptive StatisticsNMinimumMaximumMeanStd. Deviationsixtypercent5120.00150.00136.000011.40175fiftypercent590.00110.0099.00007.41620Valid N (listwise)5<br />Descriptive StatisticsNMinimumMaximumMeanStd. Deviationsixtypercent5100.00140.00126.000016.73320fiftypercent590.00120.00101.000011.40175Valid N (listwise)5<br />Descriptive StatisticsNMinimumMaximumMeanStd. Deviationsixtypercent5140.00150.00145.00005.00000fiftypercent5100.00130.00120.000012.24745Valid N (listwise)5<br />Descriptive StatisticsNMinimumMaximumMeanStd. Deviationsixtypercent5130.00150.00142.00008.36660fiftypercent5110.00130.00122.00008.36660Valid N (listwise)5<br />Descriptive StatisticsNMinimumMaximumMeanStd. Deviationsixtypercent5140.00150.00145.00005.00000fiftypercent5100.00140.00118.000014.83240Valid N (listwise)5<br />Descriptive StatisticsNMinimumMaximumMeanStd. Deviationsixtypercent5135.00150.00142.00005.70088fiftypercent5110.00130.00120.00007.07107Valid N (listwise)5<br />Descriptive StatisticsNMinimumMaximumMeanStd. Deviationsixtypercent5120.00150.00139.000011.40175fiftypercent5120.00140.00130.00007.90569Valid N (listwise)5<br />Descriptive StatisticsNMinimumMaximumMeanStd. Deviationsixtypercent595.00150.00114.000024.84955fiftypercent585.00120.0099.000015.16575Valid N (listwise)5<br />Descriptive StatisticsNMinimumMaximumMeanStd. Deviationsixtypercent5130.00150.00143.00008.36660fiftypercent595.00140.00120.000017.67767Valid N (listwise)5<br />Descriptive StatisticsNMinimumMaximumMeanStd. Deviationsixtypercent5135.00150.00143.00006.70820fiftypercent5120.00130.00127.00004.47214Valid N (listwise)5<br />One-Sample StatisticsNMeanStd. DeviationStd. Error Meansixtypercent5143.00006.708203.00000fiftypercent5127.00004.472142.00000<br />One-Sample TestTest Value = 0 95% Confidence Interval of the DifferencetdfSig. (2-tailed)Mean DifferenceLowerUppersixtypercent47.6674.000143.00000134.6707151.3293fiftypercent63.5004.000127.00000121.4471132.5529<br />One-Sample StatisticsNMeanStd. DeviationStd. Error Meansixtypercent5142.00008.366603.74166fiftypercent5121.000018.165908.12404<br />One-Sample TestTest Value = 0 95% Confidence Interval of the DifferencetdfSig. (2-tailed)Mean DifferenceLowerUppersixtypercent37.9514.000142.00000131.6115152.3885fiftypercent14.8944.000121.0000098.4441143.5559<br />One-Sample StatisticsNMeanStd. DeviationStd. Error Meansixtypercent5136.000011.401755.09902fiftypercent599.00007.416203.31662<br />One-Sample TestTest Value = 0 95% Confidence Interval of the DifferencetdfSig. (2-tailed)Mean DifferenceLowerUppersixtypercent26.6724.000136.00000121.8429150.1571fiftypercent29.8504.00099.0000089.7916108.2084<br />One-Sample StatisticsNMeanStd. DeviationStd. Error Meansixtypercent5126.000016.733207.48331fiftypercent5101.000011.401755.09902<br />One-Sample TestTest Value = 0 95% Confidence Interval of the DifferencetdfSig. (2-tailed)Mean DifferenceLowerUppersixtypercent16.8374.000126.00000105.2230146.7770fiftypercent19.8084.000101.0000086.8429115.1571<br />Descriptive StatisticsNMinimumMaximumMeanStd. Deviationsixtypercent5130.00150.00142.00008.36660fiftypercent5120.00130.00126.00005.47723Valid N (listwise)5<br />One-Sample StatisticsNMeanStd. DeviationStd. Error Meansixtypercent5145.00005.000002.23607fiftypercent5120.000012.247455.47723<br />One-Sample TestTest Value = 0 95% Confidence Interval of the DifferencetdfSig. (2-tailed)Mean DifferenceLowerUppersixtypercent64.8464.000145.00000138.7917151.2083fiftypercent21.9094.000120.00000104.7928135.2072<br />One-Sample StatisticsNMeanStd. DeviationStd. Error Meansixtypercent5142.00008.366603.74166fiftypercent5122.00008.366603.74166<br />One-Sample TestTest Value = 0 95% Confidence Interval of the DifferencetdfSig. (2-tailed)Mean DifferenceLowerUppersixtypercent37.9514.000142.00000131.6115152.3885fiftypercent32.6064.000122.00000111.6115132.3885<br />One-Sample StatisticsNMeanStd. DeviationStd. Error Meansixtypercent5145.00005.000002.23607fiftypercent5118.000014.832406.63325<br />One-Sample TestTest Value = 0 95% Confidence Interval of the DifferencetdfSig. (2-tailed)Mean DifferenceLowerUppersixtypercent64.8464.000145.00000138.7917151.2083fiftypercent17.7894.000118.0000099.5831136.4169<br />One-Sample StatisticsNMeanStd. DeviationStd. Error Meansixtypercent5142.00005.700882.54951fiftypercent5120.00007.071073.16228<br />One-Sample TestTest Value = 0 95% Confidence Interval of the DifferencetdfSig. (2-tailed)Mean DifferenceLowerUppersixtypercent55.6974.000142.00000134.9214149.0786fiftypercent37.9474.000120.00000111.2201128.7799<br />One-Sample StatisticsNMeanStd. DeviationStd. Error Meansixtypercent5139.000011.401755.09902fiftypercent5130.00007.905693.53553<br />One-Sample TestTest Value = 0 95% Confidence Interval of the DifferencetdfSig. (2-tailed)Mean DifferenceLowerUppersixtypercent27.2604.000139.00000124.8429153.1571fiftypercent36.7704.000130.00000120.1838139.8162<br />One-Sample StatisticsNMeanStd. DeviationStd. Error Meansixtypercent5114.000024.8495511.11306fiftypercent599.000015.165756.78233<br />One-Sample TestTest Value = 0 95% Confidence Interval of the DifferencetdfSig. (2-tailed)Mean DifferenceLowerUppersixtypercent10.2584.001114.0000083.1452144.8548fiftypercent14.5974.00099.0000080.1692117.8308<br />One-Sample StatisticsNMeanStd. DeviationStd. Error Meansixtypercent5143.00008.366603.74166fiftypercent5120.000017.677677.90569<br />One-Sample TestTest Value = 0 95% Confidence Interval of the DifferencetdfSig. (2-tailed)Mean DifferenceLowerUppersixtypercent38.2184.000143.00000132.6115153.3885fiftypercent15.1794.000120.0000098.0503141.9497<br />One-Sample TestTest Value = 0 95% Confidence Interval of the DifferencetdfSig. (2-tailed)Mean DifferenceLowerUppersixtypercent37.9514.000142.00000131.6115152.3885fiftypercent14.8944.000121.0000098.4441143.5559<br />One-Sample StatisticsNMeanStd. DeviationStd. Error Meansixtypercent5136.000011.401755.09902fiftypercent599.00007.416203.31662<br />One-Sample TestTest Value = 0 95% Confidence Interval of the DifferencetdfSig. (2-tailed)Mean DifferenceLowerUppersixtypercent26.6724.000136.00000121.8429150.1571fiftypercent29.8504.00099.0000089.7916108.2084<br />One-Sample StatisticsNMeanStd. DeviationStd. Error Meansixtypercent5126.000016.733207.48331fiftypercent5101.000011.401755.09902<br />One-Sample StatisticsNMeanStd. DeviationStd. Error Meansixtypercent5143.00006.708203.00000fiftypercent5127.00004.472142.00000<br />One-Sample TestTest Value = 0 95% Confidence Interval of the DifferencetdfSig. (2-tailed)Mean DifferenceLowerUppersixtypercent47.6674.000143.00000134.6707151.3293fiftypercent63.5004.000127.00000121.4471132.5529<br />