Acknowledgement
of Country
We acknowledgethat Country for Aboriginal peoples is an
interconnected set of ancient and sophisticated relationships.
The University of Wollongong spreads across many interrelated
Aboriginal Countries that are bound by this sacred landscape,
and intimate relationship with that landscape since creation.
From Sydney to the Southern Highlands, to the South Coast.
From fresh water to bitter water to salt. From City to Urban to Rural.
The University Acknowledges the devastating impact of colonisation
on our campuses’ footprint and commit ourselves to truth-telling,
healing and education.
3.
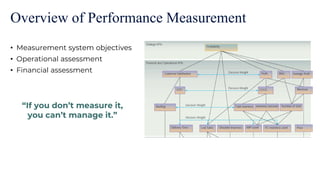
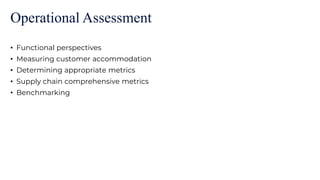
Overview of PerformanceMeasurement
• Measurement system objectives
• Operational assessment
• Financial assessment
4.
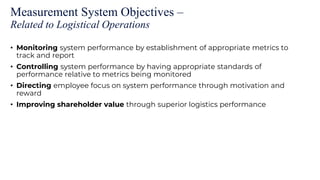
Measurement System Objectives–
Related to Logistical Operations
• Monitoring system performance by establishment of appropriate metrics to
track and report
• Controlling system performance by having appropriate standards of
performance relative to metrics being monitored
• Directing employee focus on system performance through motivation and
reward
• Improving shareholder value through superior logistics performance
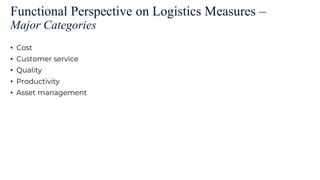
Functional Perspective onLogistics Measures –
Major Categories
• Cost
• Customer service
• Quality
• Productivity
• Asset management
8.
Cost
management
Customer
service Quality Productivity
Asset
management
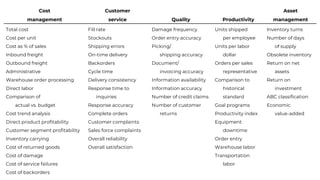
Totalcost
Cost per unit
Cost as % of sales
Inbound freight
Outbound freight
Administrative
Warehouse order processing
Direct labor
Comparison of
actual vs. budget
Cost trend analysis
Direct product profitability
Customer segment profitability
Inventory carrying
Cost of returned goods
Cost of damage
Cost of service failures
Cost of backorders
Fill rate
Stockouts
Shipping errors
On-time delivery
Backorders
Cycle time
Delivery consistency
Response time to
inquiries
Response accuracy
Complete orders
Customer complaints
Sales force complaints
Overall reliability
Overall satisfaction
Damage frequency
Order entry accuracy
Picking/
shipping accuracy
Document/
invoicing accuracy
Information availability
Information accuracy
Number of credit claims
Number of customer
returns
Units shipped
per employee
Units per labor
dollar
Orders per sales
representative
Comparison to
historical
standard
Goal programs
Productivity index
Equipment
downtime
Order entry
Warehouse labor
Transportation
labor
Inventory turns
Number of days
of supply
Obsolete inventory
Return on net
assets
Return on
investment
ABC classification
Economic
value-added
9.
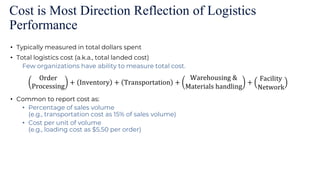
Cost is MostDirection Reflection of Logistics
Performance
• Typically measured in total dollars spent
• Total logistics cost (a.k.a., total landed cost)
Few organizations have ability to measure total cost.
• Common to report cost as:
• Percentage of sales volume
(e.g., transportation cost as 15% of sales volume)
• Cost per unit of volume
(e.g., loading cost as $5.50 per order)
Order
Processing
+ Inventory + Transportation +
Warehousing &
Materials handling
+
Facility
Network
10.
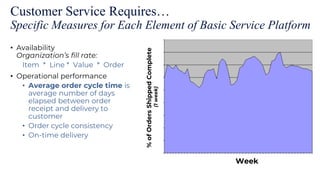
Customer Service Requires…
SpecificMeasures for Each Element of Basic Service Platform
• Availability
Organization’s fill rate:
Item * Line * Value * Order
• Operational performance
• Average order cycle time is
average number of days
elapsed between order
receipt and delivery to
customer
• Order cycle consistency
• On-time delivery
%
of
Orders
Shipped
Complete
(1
week)
Week
11.
Quality Measures –
OftenInclude Service Reliability Performance
• Accuracy of work activities performed
• Damage frequency is the ratio of number of damaged units to the total
number of units
• Number of customer returns of damaged or defective goods
• Number of instances when information is not available on request
• Number of instances when inaccurate information is discovered
12.
Productivity –
Measured asOutput of Goods Compared with Input Quantities
• Labor productivity
• Units shipped per employee
• Units received per employee
• Equipment downtime
13.
Asset management
• Inventoryare measure in terms of Inventory Turnover
Rate – Measured Differently by Different Types of Firms
• Vast majority of firms:
• Some retail firms:
• Used for products whose cost or selling price changes
significantly during relatively short periods of time
(e.g., petorl inventory)
• Include both facilities and equipment and Inventory
• Facilities and equipment are frequently measured in terms of capacity utilization, or the
percentage of total capacity used.
• It is measured in terms of the number or percentage of hours that equipment is not
utilized, which is measured as equipment downtime.
• The goal is to reduce the downtime.
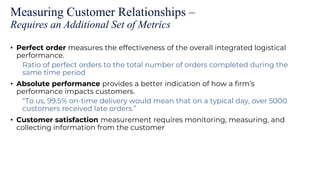
Measuring Customer Relationships–
Requires an Additional Set of Metrics
• Perfect order measures the effectiveness of the overall integrated logistical
performance.
Ratio of perfect orders to the total number of orders completed during the
same time period
• Absolute performance provides a better indication of how a firm’s
performance impacts customers.
“To us, 99.5% on-time delivery would mean that on a typical day, over 5000
customers received late orders.”
• Customer satisfaction measurement requires monitoring, measuring, and
collecting information from the customer
16.
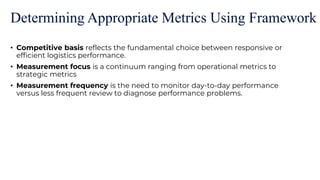
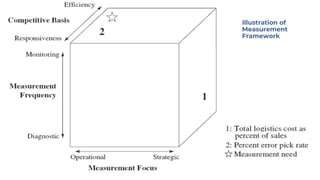
Determining Appropriate MetricsUsing Framework
• Competitive basis reflects the fundamental choice between responsive or
efficient logistics performance.
• Measurement focus is a continuum ranging from operational metrics to
strategic metrics
• Measurement frequency is the need to monitor day-to-day performance
versus less frequent review to diagnose performance problems.
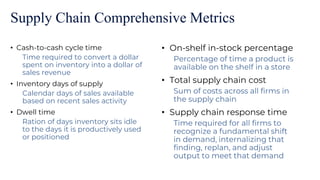
Supply Chain ComprehensiveMetrics
• Cash-to-cash cycle time
Time required to convert a dollar
spent on inventory into a dollar of
sales revenue
• Inventory days of supply
Calendar days of sales available
based on recent sales activity
• Dwell time
Ration of days inventory sits idle
to the days it is productively used
or positioned
• On-shelf in-stock percentage
Percentage of time a product is
available on the shelf in a store
• Total supply chain cost
Sum of costs across all firms in
the supply chain
• Supply chain response time
Time required for all firms to
recognize a fundamental shift
in demand, internalizing that
finding, replan, and adjust
output to meet that demand
19.
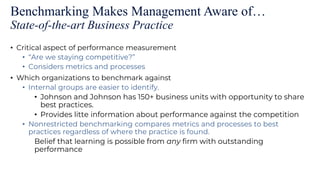
Benchmarking Makes ManagementAware of…
State-of-the-art Business Practice
• Critical aspect of performance measurement
• “Are we staying competitive?”
• Considers metrics and processes
• Which organizations to benchmark against
• Internal groups are easier to identify.
• Johnson and Johnson has 150+ business units with opportunity to share
best practices.
• Provides litte information about performance against the competition
• Nonrestricted benchmarking compares metrics and processes to best
practices regardless of where the practice is found.
Belief that learning is possible from any firm with outstanding
performance
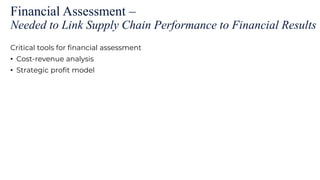
Financial Assessment –
Neededto Link Supply Chain Performance to Financial Results
Critical tools for financial assessment
• Cost-revenue analysis
• Strategic profit model
22.
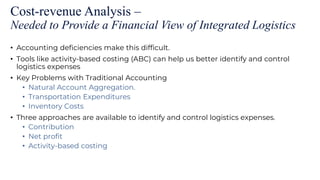
Cost-revenue Analysis –
Neededto Provide a Financial View of Integrated Logistics
• Accounting deficiencies make this difficult.
• Tools like activity-based costing (ABC) can help us better identify and control
logistics expenses
• Key Problems with Traditional Accounting
• Natural Account Aggregation.
• Transportation Expenditures
• Inventory Costs
• Three approaches are available to identify and control logistics expenses.
• Contribution
• Net profit
• Activity-based costing
23.
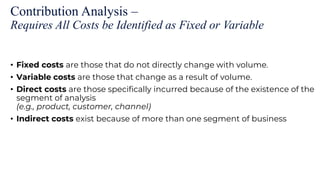
Contribution Analysis –
RequiresAll Costs be Identified as Fixed or Variable
• Fixed costs are those that do not directly change with volume.
• Variable costs are those that change as a result of volume.
• Direct costs are those specifically incurred because of the existence of the
segment of analysis
(e.g., product, customer, channel)
• Indirect costs exist because of more than one segment of business
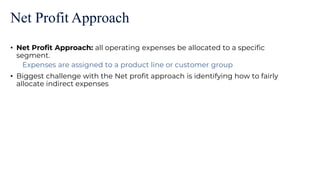
Net Profit Approach
•Net Profit Approach: all operating expenses be allocated to a specific
segment.
Expenses are assigned to a product line or customer group
• Biggest challenge with the Net profit approach is identifying how to fairly
allocate indirect expenses
26.
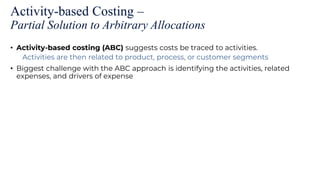
Activity-based Costing –
PartialSolution to Arbitrary Allocations
• Activity-based costing (ABC) suggests costs be traced to activities.
Activities are then related to product, process, or customer segments
• Biggest challenge with the ABC approach is identifying the activities, related
expenses, and drivers of expense
27.
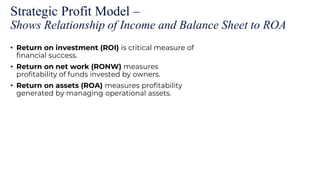
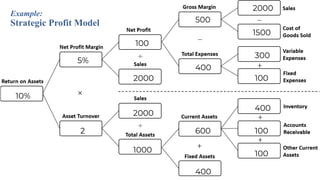
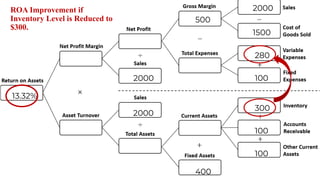
Strategic Profit Model–
Shows Relationship of Income and Balance Sheet to ROA
• Return on investment (ROI) is critical measure of
financial success.
• Return on net work (RONW) measures
profitability of funds invested by owners.
• Return on assets (ROA) measures profitability
generated by managing operational assets.
28.
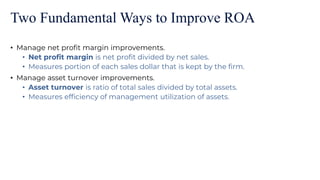
Two Fundamental Waysto Improve ROA
• Manage net profit margin improvements.
• Net profit margin is net profit divided by net sales.
• Measures portion of each sales dollar that is kept by the firm.
• Manage asset turnover improvements.
• Asset turnover is ratio of total sales divided by total assets.
• Measures efficiency of management utilization of assets.


![11. perf[1]. measrs (1)](https://cdn.slidesharecdn.com/ss_thumbnails/11-perf1-measrs1-110707064611-phpapp01-thumbnail.jpg?width=640&height=640&fit=bounds)


![Chapter 3 Performance Measures [Autosaved].ppt](https://cdn.slidesharecdn.com/ss_thumbnails/chapter3performancemeasuresautosaved-250911044211-e0023b94-thumbnail.jpg?width=640&height=640&fit=bounds)
![Chapter 3 Performance Measures [Autosaved].ppt](https://cdn.slidesharecdn.com/ss_thumbnails/chapter3performancemeasuresautosaved-250911045149-875c1566-thumbnail.jpg?width=640&height=640&fit=bounds)
![Chapter 3 Performance Measures [Autosaved].ppt](https://cdn.slidesharecdn.com/ss_thumbnails/chapter3performancemeasuresautosaved-250911043631-784e40fa-thumbnail.jpg?width=640&height=640&fit=bounds)


