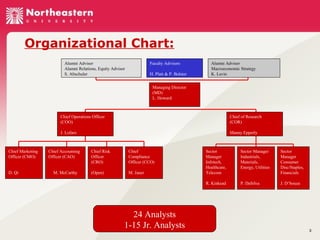
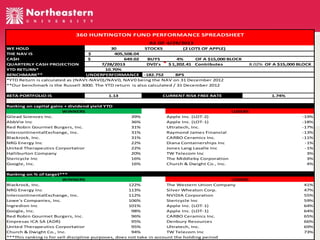
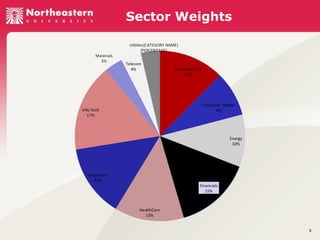
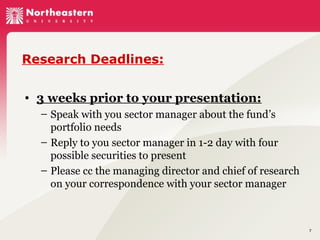
360 Huntington Fund
Session One – Summer 2013
Fund Management – FINA 6360 & 6361

The 360 Huntington Fund

1
The 360 Huntington Fund:
• A student run investment fund – created through
donations from the university, faculty, administrators,
and alumni.
• Course is designed to give students experience in equity
research and portfolio management.
• Expectation is for students to be proficient in asset
valuation, asset allocation and understand investment
concepts – become a mutual fund analyst

2
Organizational Chart:
Alumni Advisor
Alumni Relations, Equity Advisor
S. Altschuler

Faculty Advisors
H. Platt & P. Bolster

Alumni Advisor
Macroeconomic Strategy
K. Lavin

Managing Director
(MD)
L. Howard

Chief Operations Officer
(COO)
J. Lofaro

Chief Marketing
Officer (CMO)

D. Qi

Chief of Research
(COR)
Manny Epperly

Chief Accounting
Officer (CAO)

M. McCarthy

Chief Risk
Officer
(CRO)

Chief
Compliance
Officer (CCO)

(Open)

M. Janer

Sector Manager
Industrials,
Materials,
Energy, Utilities

Sector
Manager
Consumer
Disc/Staples,
Financials

R. Kinkead

24 Analysts
1-15 Jr. Analysts

Sector
Manager
Infotech,
Healthcare,
Telecom

P. DaSilva

J. D’Souza

3
360 HUNTINGTON FUND PERFORMANCE SPREADSHEET
AS OF 4/29/2013
WE HOLD
30
STOCKS
(2 LOTS OF APPLE)
THE NAV IS
$
405,508.04
CA$H
$
649.02
BUYS
4%
OF A $15,000 BLOCK
QUARTERLY CASH PROJECTION
7/28/2013
DVD's
$ 1,202.41 Contributes
YTD RETURN*
10.70%
BENCHMARK**
UNDERPERFORMANCE -182.752
BPS
*YTD Return is calculated as (NAVt-NAV0)/NAV0, NAV0 being the NAV on 31 December 2012
**Our benchmark is the Russell 3000. The YTD return is also calculated / 31 December 2012
BETA PORTFOLIO IS

1.13

Ranking on capital gains + dividend yield YTD
WINNERS
Gilead Sciences Inc.
AbbVie Inc
Red Robin Gourmet Burgers, Inc.
IntercontinentalExchange, Inc.
Blackrock, Inc.
NRG Energy Inc
United Therapeutics Corportation
Halliburton Company
Stericycle Inc
Google, Inc.
Ranking on % of target***
WINNERS
Blackrock, Inc.
NRG Energy Inc
IntercontinentalExchange, Inc.
Lowe's Companies, Inc.
Ingredion Inc
Google, Inc.
Red Robin Gourmet Burgers, Inc.
Empresas ICA SA (ADR)
United Therapeutics Corportation
Church & Dwight Co., Inc.
***This ranking is for sell discipline purposes, does

CURRENT RISK FREE RATE

8.02% OF A $15,000 BLOCK

1.74%

LOSERS
39%
36%
31%
31%
31%
22%
22%
20%
16%
16%

1
2
3
4
5
6
7
8
9
10

Apple Inc. (LOT-2)
Apple Inc. (LOT-1)
Ultratech, Inc.
Raymond James Financial
CARBO Ceramics Inc.
Diana Containerships Inc
Jones Lang Lasalle Inc
TW Telecom Inc
The Middleby Corporation
Church & Dwight Co., Inc.

LOSERS
122%
The Western Union Company
113%
Silver Wheaton Corp.
112%
NVIDIA Corporation
106%
Stericycle Inc
101%
Apple Inc. (LOT-1)
98%
Apple Inc. (LOT-1)
96%
CARBO Ceramics Inc.
95%
Denbury Resources
95%
Ultratech, Inc.
94%
TW Telecom Inc
not take in account the holding period

-19%
-18%
-17%
-13%
-11%
-1%
-1%
3%
3%
4%

41%
47%
55%
59%
64%
64%
65%
66%
69%
4
73%
Sector Weights

5
Sector Gaps vs. Russell 3000

6
Research Deadlines:
• 3 weeks prior to your presentation:
– Speak with you sector manager about the fund’s
portfolio needs
– Reply to you sector manager in 1-2 day with four
possible securities to present
– Please cc the managing director and chief of research
on your correspondence with your sector manager

7
Research Deadlines:
• 2 weeks prior to your presentation:
– Work with your sector manager to choose a stock to
present from the four choices
– Create a draft of your presentation
• Including a valuation and PowerPoint
presentation
– Please cc the managing director and chief of research
on your correspondence with your sector manager
8
Research Deadlines:
• 5 days prior to your presentation:
– Your sector manager will contact you by e-mail or by
phone and give you feedback on your draft.
– You will be responsible for implementing your sector
manager’s recommendations.
– Communicate any concerns regarding your progress
to your sector manager.
– Please cc the managing director and chief of research
on your correspondence with your sector manager
9
Research Deadlines:
• 3 days prior to your presentation:
– Send the final draft of your presentation to your
sector manager.
– Send an e-mail to the fund’s e-mail group: 360hfall@googlegroups.com
• In your message, identify the stock you will be
presenting and explain briefly why you choose it.

10
Research Deadlines:
• 2 days prior to your presentation:
– Your sector manager will give you the “go/no go” to
present.
– If you are cleared to present, post your research,
both the valuation and PowerPoint presentation, on
blackboard.
• Post your work in the Discussion Board in the
Regular Meeting and Research folder.
– Small changes to your presentation are still allowed
after this point.
11
Company Name (Ticker)
Recommendation (Buy, Initiate, Sell, etc.)
Analyst Names

Sector:
Sector:
Industry:
Industry:
Industry (VL):
Industry (VL):

The 360 Huntington Fund

12
Disclosure statement
• I own xxx shares of the stock recommended.
• I have no positions in any stocks mentioned, but plan to
initiate new positions within the next 72 hours.
• I have no positions in any stocks mentioned, and no
plans to initiate any positions within the next 72 hours.
• Or others

13
Business Description & Market Profile
• Market Profile
– Market cap (small/mid/large)
– Primary market (US/global/Europe/Asia/emerging/…)

• Business Description
– Describe the company’s business lines, market, share,
accolades, etc…

14
Industry Analysis
• SWOT/Porter’s Five Forces/ Relevant Macroeconomic
Factors/etc.

15
Catalysts
• Your company’s specific catalysts
• Discuss key research-supported factors that have
historically driven excess returns, possibly including
valuation ratios (versus industry, the market, and/or
firm history), insider activity, M&A activity, earnings
beats/misses, and earnings revisions.

16
Risks
• Market risks
• Industry risks
• Company specific risks

17
Comparables
• Important quantitative data for your company vs. the
peer group, industry, etc. (below is not exhaustive!)
Your
company

Competitor 1

Competitor 2

Competitor 3

52W Range
Market Cap
Beta
ROA
ROE
Operating Margin
P/S (TTM)
P/B (TTM)
P/E (TTM)
PEG
Dividend Yield
18
Price Graph
• (Your company vs. Russell 3000 (IWV) and peer group

19
Others – your discretion
• In-depth financial statement analysis
• Technical analysis
• Psychological factors
• Anything else

20
Valuation
• (copy your valuation summary as image)
Nordstrom

DCF
Historical Relative P/E
Multiples

Summary
Value
$57.88
$56.07
$63.67

Current Price

$54.28

Target

$58.88
8.5%
-0.8%

Weight
50%
25%
25%
100%

% Undervalued
Expected Alpha

21
Supplements
• Materials for Q&A

22
Q&A

23
Working with Your Sector Manager:
• Your sector manage will be your best resource for questions
regarding valuations, presentations, and coverage updates.
• Sector managers will report analysts’ progress to the managing
director and chief of research.

24
Jr. Analyst Responsibilities
• Coverage updates:
– Jr. Analysts will follow and document updates, earnings reports, press
releases, and other market factors that effect their assigned securities.
– Coverage updates are due before each class
– Use sites like Factiva, Morningstar, and Valueline through the NEU
website to find information on your stocks.
• Support Analyst research:
– Jr. Analysts will help analysts search for quality securities, and help
with the early research under the direction of the Sector Managers.
• Valuation Model Tutorial Session
– All Jr. Analysts must attend a tutorial session session, where Sector
Managers will teach the Fund’s valuation model in depth.
– The session will be held on an “off” Monday, during regular class
hours. Date to be determined.

25
Sample Coverage Update
Author: Sabrina Sabau Date: Monday, April 22, 2013 3:37:09 PM EDT Subject: RE: Coverage Update 4-20-13

Coverage Update April 22, 2013
Market Sentiment: The Russell 3000 will return > 3% in the next 3 months.
HAL
Hold at target of $50
Current price: $38.29
52 week range: $26.28-$43.83
MarketWatch Analyst Recommended Buys: 27; Overweight: 4; Hold: 5; Sells:0

On April 22, HAL announces diluted Q1 EPS of $0.67, down from $0.89 diluted EPS of Q1 2012, but in-line with consensus forecasts.
Chairman Dave Lesar explains the company achieved a quarterly revenue record of $7 billion with the help of international rig
operations. The Sperry Drilling, Baroid, and Multi-Chem products contributed to the highest product line revenues per quarter.
Operating income in North America increased 30% aided by favorable input costs and tolerance for higher priced technological
services to clients. Whereas North America focused on margins, the international top line grew 21% yoy. HAL’s quarterly dividend
increased from $.09 to $.125 per share as well. Further management expectations revolve around deepwater, unconventional, and
mature fields markets with revenue growth in the low teens.

26
Other ways to contribute to the Fund:
• Rise & Game Competitions:
• http://www.udayton.edu/business/rise/
• Take on a leadership position
– Risk Officer position currently available
– Many other officer/manager positions available for the spring
semester (including COO, Compliance Officer, Sector
Manager).
– If interested in an officer position, speak with COO Jordan
Lofaro after class.

27
What Has Worked in Investing:
• Research paper is located on blackboard,
offering investment strategies:
– Low P/E or P/B
– High dividend yields
– Insider trading
– A dramatic decline in trading price
– Small market capitalization stocks
– Momentum
• Please familiarize yourself with this reading, especially if you do
not have a finance background.
28
Investment Approaches:
• Catalyst:
• Macroeconomic events:
• Valuation driven:

29
How to find stocks using Value Line:
• Using a Value Line filter to find securities…

30
Closing:
• Class Participation:
– We expect discussion and debates to take place
during class, in order to uncover investment
opportunities and enhance the learning experience.

• Attendance:
– If you will miss class please e-mail Manny Epperly
and Lee Howard

31

Lofaro_360Fund

  • 1.
    360 Huntington Fund SessionOne – Summer 2013 Fund Management – FINA 6360 & 6361 The 360 Huntington Fund 1
  • 2.
    The 360 HuntingtonFund: • A student run investment fund – created through donations from the university, faculty, administrators, and alumni. • Course is designed to give students experience in equity research and portfolio management. • Expectation is for students to be proficient in asset valuation, asset allocation and understand investment concepts – become a mutual fund analyst 2
  • 3.
    Organizational Chart: Alumni Advisor AlumniRelations, Equity Advisor S. Altschuler Faculty Advisors H. Platt & P. Bolster Alumni Advisor Macroeconomic Strategy K. Lavin Managing Director (MD) L. Howard Chief Operations Officer (COO) J. Lofaro Chief Marketing Officer (CMO) D. Qi Chief of Research (COR) Manny Epperly Chief Accounting Officer (CAO) M. McCarthy Chief Risk Officer (CRO) Chief Compliance Officer (CCO) (Open) M. Janer Sector Manager Industrials, Materials, Energy, Utilities Sector Manager Consumer Disc/Staples, Financials R. Kinkead 24 Analysts 1-15 Jr. Analysts Sector Manager Infotech, Healthcare, Telecom P. DaSilva J. D’Souza 3
  • 4.
    360 HUNTINGTON FUNDPERFORMANCE SPREADSHEET AS OF 4/29/2013 WE HOLD 30 STOCKS (2 LOTS OF APPLE) THE NAV IS $ 405,508.04 CA$H $ 649.02 BUYS 4% OF A $15,000 BLOCK QUARTERLY CASH PROJECTION 7/28/2013 DVD's $ 1,202.41 Contributes YTD RETURN* 10.70% BENCHMARK** UNDERPERFORMANCE -182.752 BPS *YTD Return is calculated as (NAVt-NAV0)/NAV0, NAV0 being the NAV on 31 December 2012 **Our benchmark is the Russell 3000. The YTD return is also calculated / 31 December 2012 BETA PORTFOLIO IS 1.13 Ranking on capital gains + dividend yield YTD WINNERS Gilead Sciences Inc. AbbVie Inc Red Robin Gourmet Burgers, Inc. IntercontinentalExchange, Inc. Blackrock, Inc. NRG Energy Inc United Therapeutics Corportation Halliburton Company Stericycle Inc Google, Inc. Ranking on % of target*** WINNERS Blackrock, Inc. NRG Energy Inc IntercontinentalExchange, Inc. Lowe's Companies, Inc. Ingredion Inc Google, Inc. Red Robin Gourmet Burgers, Inc. Empresas ICA SA (ADR) United Therapeutics Corportation Church & Dwight Co., Inc. ***This ranking is for sell discipline purposes, does CURRENT RISK FREE RATE 8.02% OF A $15,000 BLOCK 1.74% LOSERS 39% 36% 31% 31% 31% 22% 22% 20% 16% 16% 1 2 3 4 5 6 7 8 9 10 Apple Inc. (LOT-2) Apple Inc. (LOT-1) Ultratech, Inc. Raymond James Financial CARBO Ceramics Inc. Diana Containerships Inc Jones Lang Lasalle Inc TW Telecom Inc The Middleby Corporation Church & Dwight Co., Inc. LOSERS 122% The Western Union Company 113% Silver Wheaton Corp. 112% NVIDIA Corporation 106% Stericycle Inc 101% Apple Inc. (LOT-1) 98% Apple Inc. (LOT-1) 96% CARBO Ceramics Inc. 95% Denbury Resources 95% Ultratech, Inc. 94% TW Telecom Inc not take in account the holding period -19% -18% -17% -13% -11% -1% -1% 3% 3% 4% 41% 47% 55% 59% 64% 64% 65% 66% 69% 4 73%
  • 5.
  • 6.
    Sector Gaps vs.Russell 3000 6
  • 7.
    Research Deadlines: • 3weeks prior to your presentation: – Speak with you sector manager about the fund’s portfolio needs – Reply to you sector manager in 1-2 day with four possible securities to present – Please cc the managing director and chief of research on your correspondence with your sector manager 7
  • 8.
    Research Deadlines: • 2weeks prior to your presentation: – Work with your sector manager to choose a stock to present from the four choices – Create a draft of your presentation • Including a valuation and PowerPoint presentation – Please cc the managing director and chief of research on your correspondence with your sector manager 8
  • 9.
    Research Deadlines: • 5days prior to your presentation: – Your sector manager will contact you by e-mail or by phone and give you feedback on your draft. – You will be responsible for implementing your sector manager’s recommendations. – Communicate any concerns regarding your progress to your sector manager. – Please cc the managing director and chief of research on your correspondence with your sector manager 9
  • 10.
    Research Deadlines: • 3days prior to your presentation: – Send the final draft of your presentation to your sector manager. – Send an e-mail to the fund’s e-mail group: 360hfall@googlegroups.com • In your message, identify the stock you will be presenting and explain briefly why you choose it. 10
  • 11.
    Research Deadlines: • 2days prior to your presentation: – Your sector manager will give you the “go/no go” to present. – If you are cleared to present, post your research, both the valuation and PowerPoint presentation, on blackboard. • Post your work in the Discussion Board in the Regular Meeting and Research folder. – Small changes to your presentation are still allowed after this point. 11
  • 12.
    Company Name (Ticker) Recommendation(Buy, Initiate, Sell, etc.) Analyst Names Sector: Sector: Industry: Industry: Industry (VL): Industry (VL): The 360 Huntington Fund 12
  • 13.
    Disclosure statement • Iown xxx shares of the stock recommended. • I have no positions in any stocks mentioned, but plan to initiate new positions within the next 72 hours. • I have no positions in any stocks mentioned, and no plans to initiate any positions within the next 72 hours. • Or others 13
  • 14.
    Business Description &Market Profile • Market Profile – Market cap (small/mid/large) – Primary market (US/global/Europe/Asia/emerging/…) • Business Description – Describe the company’s business lines, market, share, accolades, etc… 14
  • 15.
    Industry Analysis • SWOT/Porter’sFive Forces/ Relevant Macroeconomic Factors/etc. 15
  • 16.
    Catalysts • Your company’sspecific catalysts • Discuss key research-supported factors that have historically driven excess returns, possibly including valuation ratios (versus industry, the market, and/or firm history), insider activity, M&A activity, earnings beats/misses, and earnings revisions. 16
  • 17.
    Risks • Market risks •Industry risks • Company specific risks 17
  • 18.
    Comparables • Important quantitativedata for your company vs. the peer group, industry, etc. (below is not exhaustive!) Your company Competitor 1 Competitor 2 Competitor 3 52W Range Market Cap Beta ROA ROE Operating Margin P/S (TTM) P/B (TTM) P/E (TTM) PEG Dividend Yield 18
  • 19.
    Price Graph • (Yourcompany vs. Russell 3000 (IWV) and peer group 19
  • 20.
    Others – yourdiscretion • In-depth financial statement analysis • Technical analysis • Psychological factors • Anything else 20
  • 21.
    Valuation • (copy yourvaluation summary as image) Nordstrom DCF Historical Relative P/E Multiples Summary Value $57.88 $56.07 $63.67 Current Price $54.28 Target $58.88 8.5% -0.8% Weight 50% 25% 25% 100% % Undervalued Expected Alpha 21
  • 22.
  • 23.
  • 24.
    Working with YourSector Manager: • Your sector manage will be your best resource for questions regarding valuations, presentations, and coverage updates. • Sector managers will report analysts’ progress to the managing director and chief of research. 24
  • 25.
    Jr. Analyst Responsibilities •Coverage updates: – Jr. Analysts will follow and document updates, earnings reports, press releases, and other market factors that effect their assigned securities. – Coverage updates are due before each class – Use sites like Factiva, Morningstar, and Valueline through the NEU website to find information on your stocks. • Support Analyst research: – Jr. Analysts will help analysts search for quality securities, and help with the early research under the direction of the Sector Managers. • Valuation Model Tutorial Session – All Jr. Analysts must attend a tutorial session session, where Sector Managers will teach the Fund’s valuation model in depth. – The session will be held on an “off” Monday, during regular class hours. Date to be determined. 25
  • 26.
    Sample Coverage Update Author:Sabrina Sabau Date: Monday, April 22, 2013 3:37:09 PM EDT Subject: RE: Coverage Update 4-20-13 Coverage Update April 22, 2013 Market Sentiment: The Russell 3000 will return > 3% in the next 3 months. HAL Hold at target of $50 Current price: $38.29 52 week range: $26.28-$43.83 MarketWatch Analyst Recommended Buys: 27; Overweight: 4; Hold: 5; Sells:0 On April 22, HAL announces diluted Q1 EPS of $0.67, down from $0.89 diluted EPS of Q1 2012, but in-line with consensus forecasts. Chairman Dave Lesar explains the company achieved a quarterly revenue record of $7 billion with the help of international rig operations. The Sperry Drilling, Baroid, and Multi-Chem products contributed to the highest product line revenues per quarter. Operating income in North America increased 30% aided by favorable input costs and tolerance for higher priced technological services to clients. Whereas North America focused on margins, the international top line grew 21% yoy. HAL’s quarterly dividend increased from $.09 to $.125 per share as well. Further management expectations revolve around deepwater, unconventional, and mature fields markets with revenue growth in the low teens. 26
  • 27.
    Other ways tocontribute to the Fund: • Rise & Game Competitions: • http://www.udayton.edu/business/rise/ • Take on a leadership position – Risk Officer position currently available – Many other officer/manager positions available for the spring semester (including COO, Compliance Officer, Sector Manager). – If interested in an officer position, speak with COO Jordan Lofaro after class. 27
  • 28.
    What Has Workedin Investing: • Research paper is located on blackboard, offering investment strategies: – Low P/E or P/B – High dividend yields – Insider trading – A dramatic decline in trading price – Small market capitalization stocks – Momentum • Please familiarize yourself with this reading, especially if you do not have a finance background. 28
  • 29.
    Investment Approaches: • Catalyst: •Macroeconomic events: • Valuation driven: 29
  • 30.
    How to findstocks using Value Line: • Using a Value Line filter to find securities… 30
  • 31.
    Closing: • Class Participation: –We expect discussion and debates to take place during class, in order to uncover investment opportunities and enhance the learning experience. • Attendance: – If you will miss class please e-mail Manny Epperly and Lee Howard 31