Downloaded 32 times

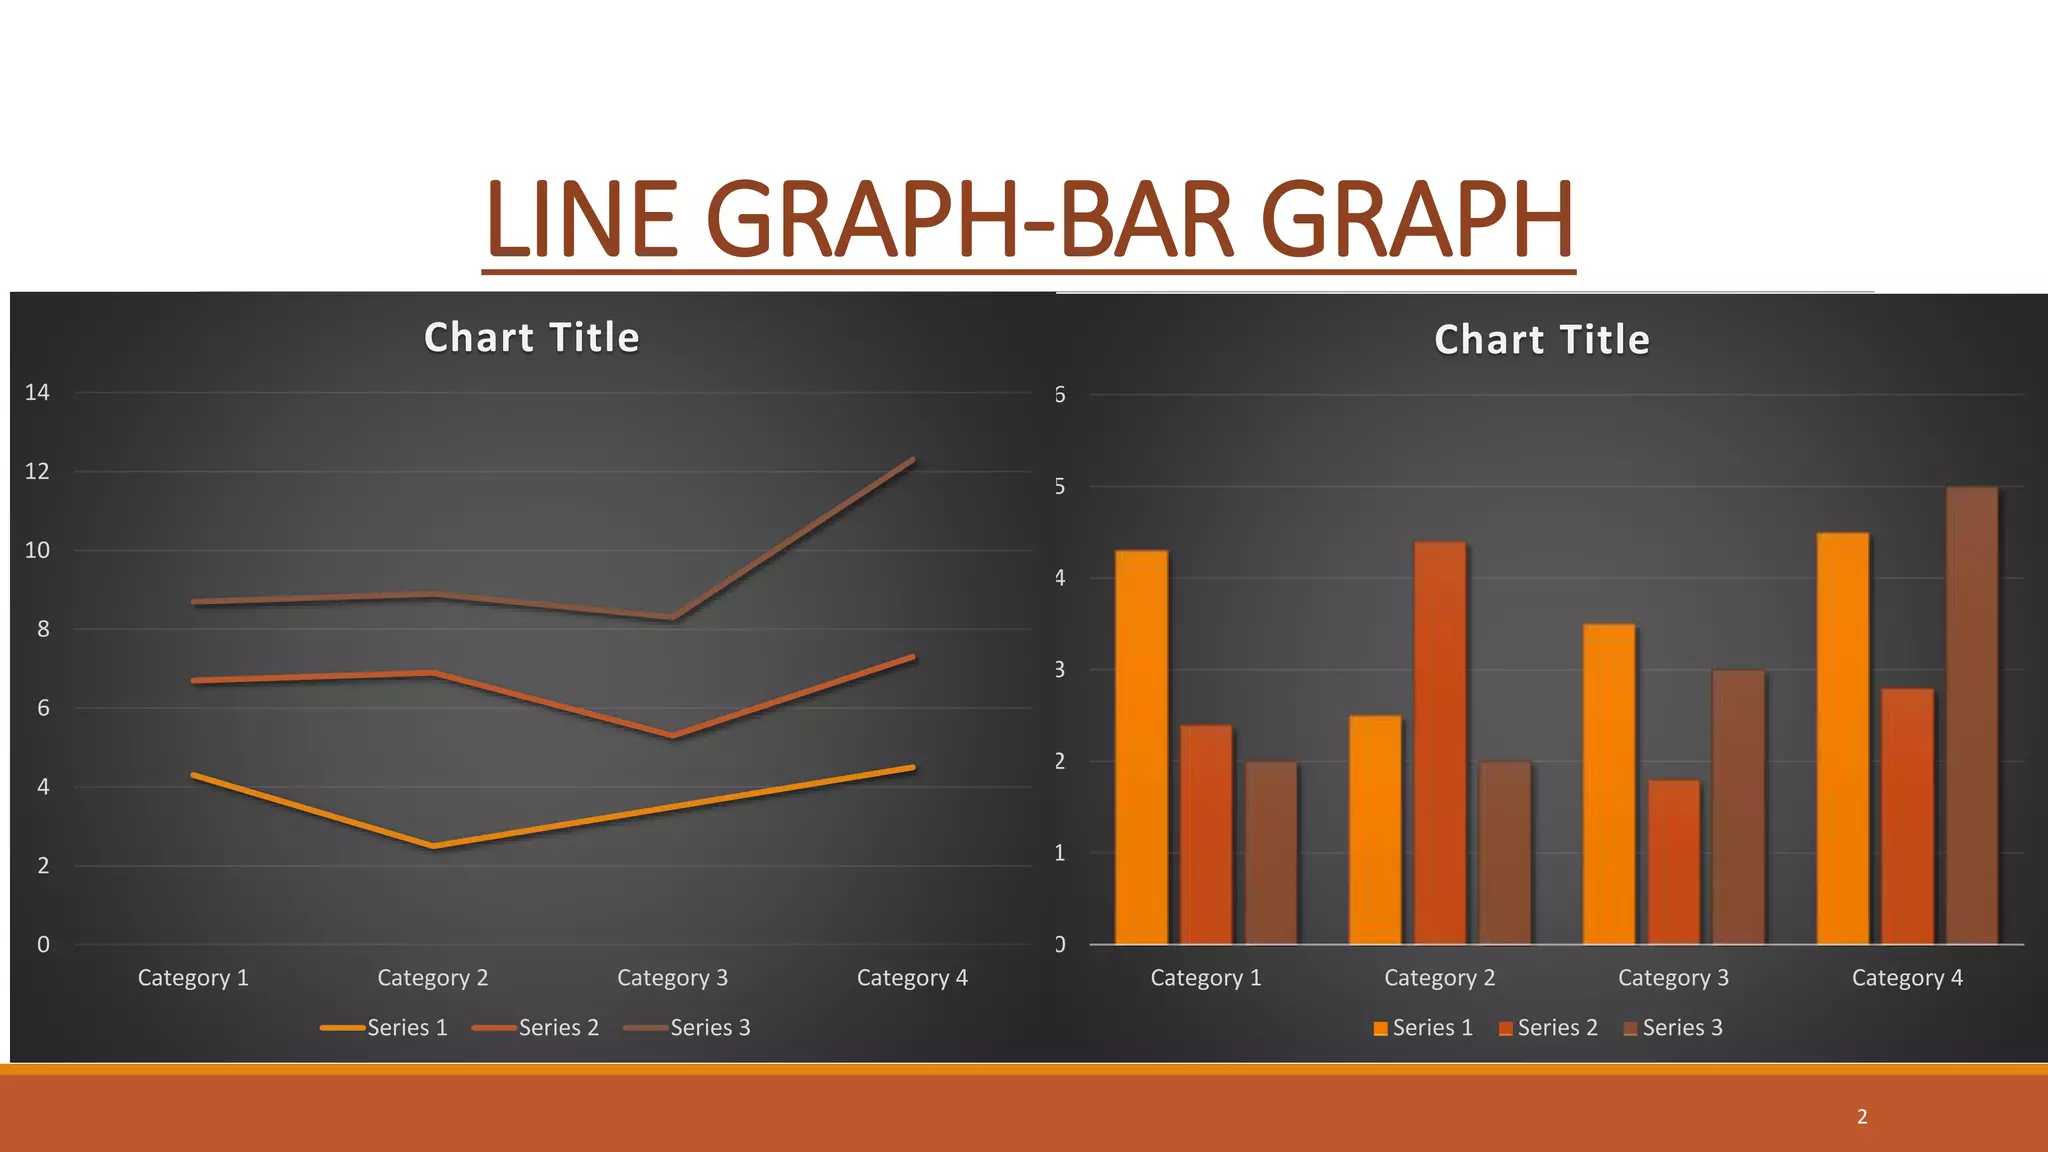
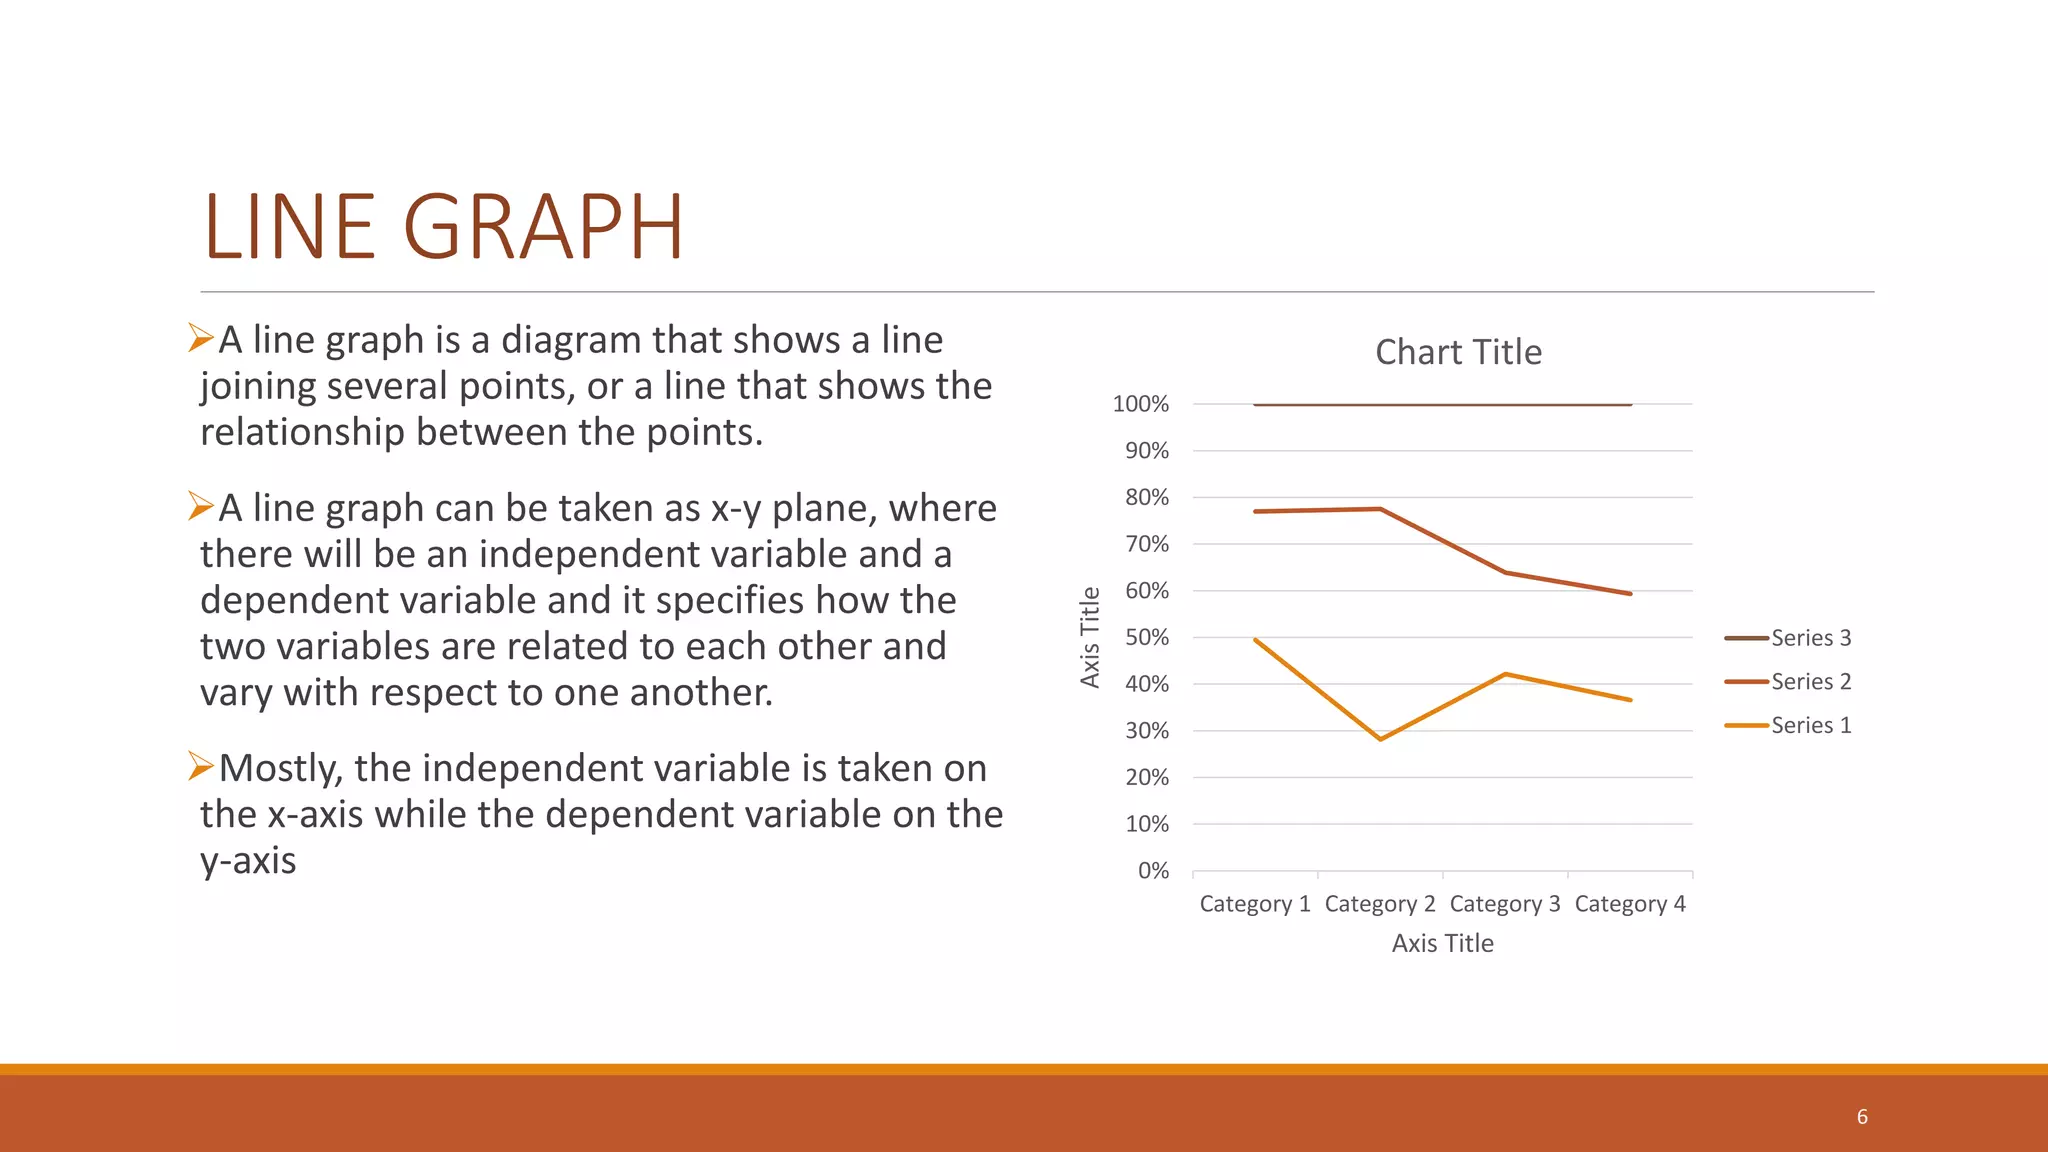
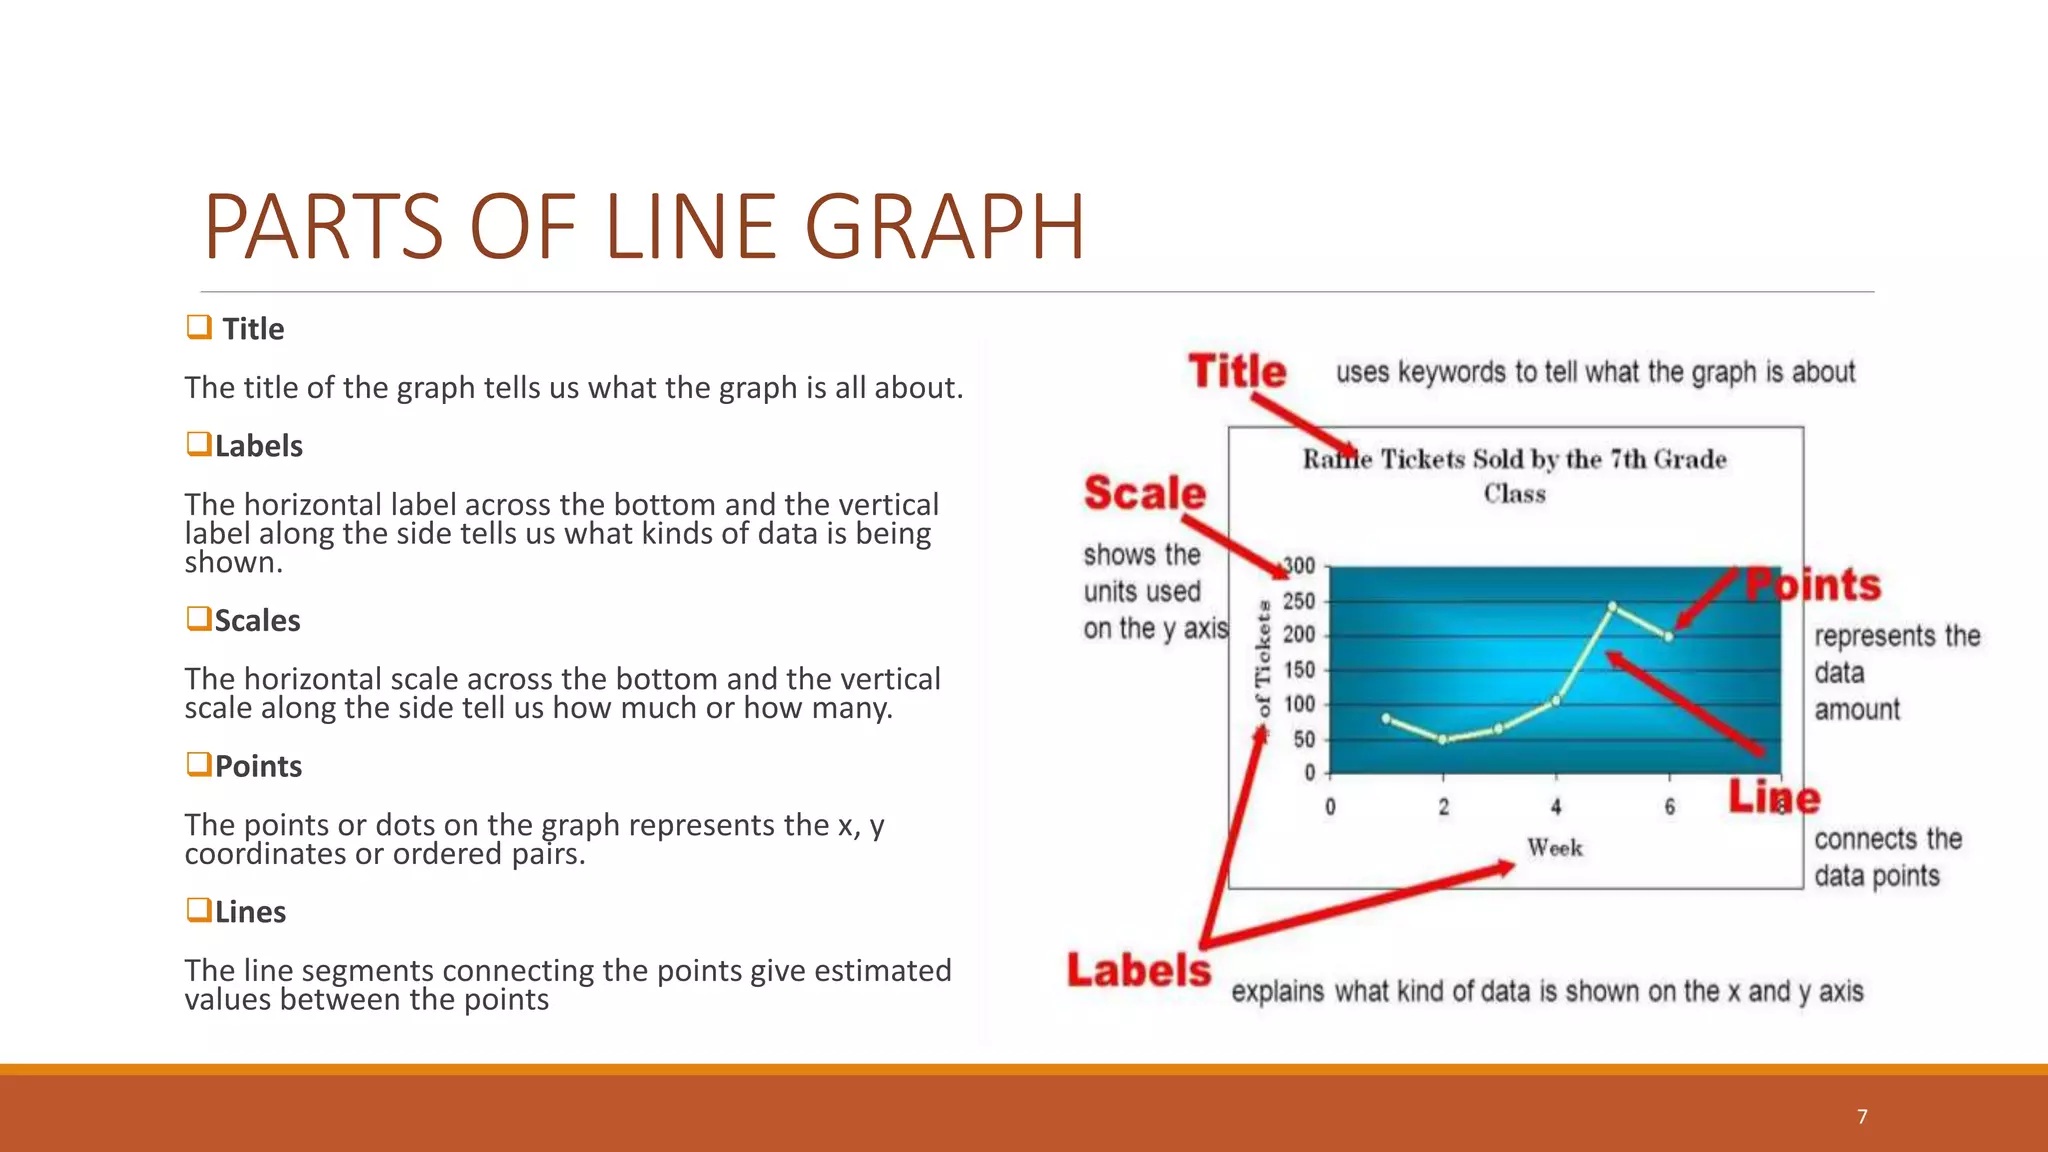
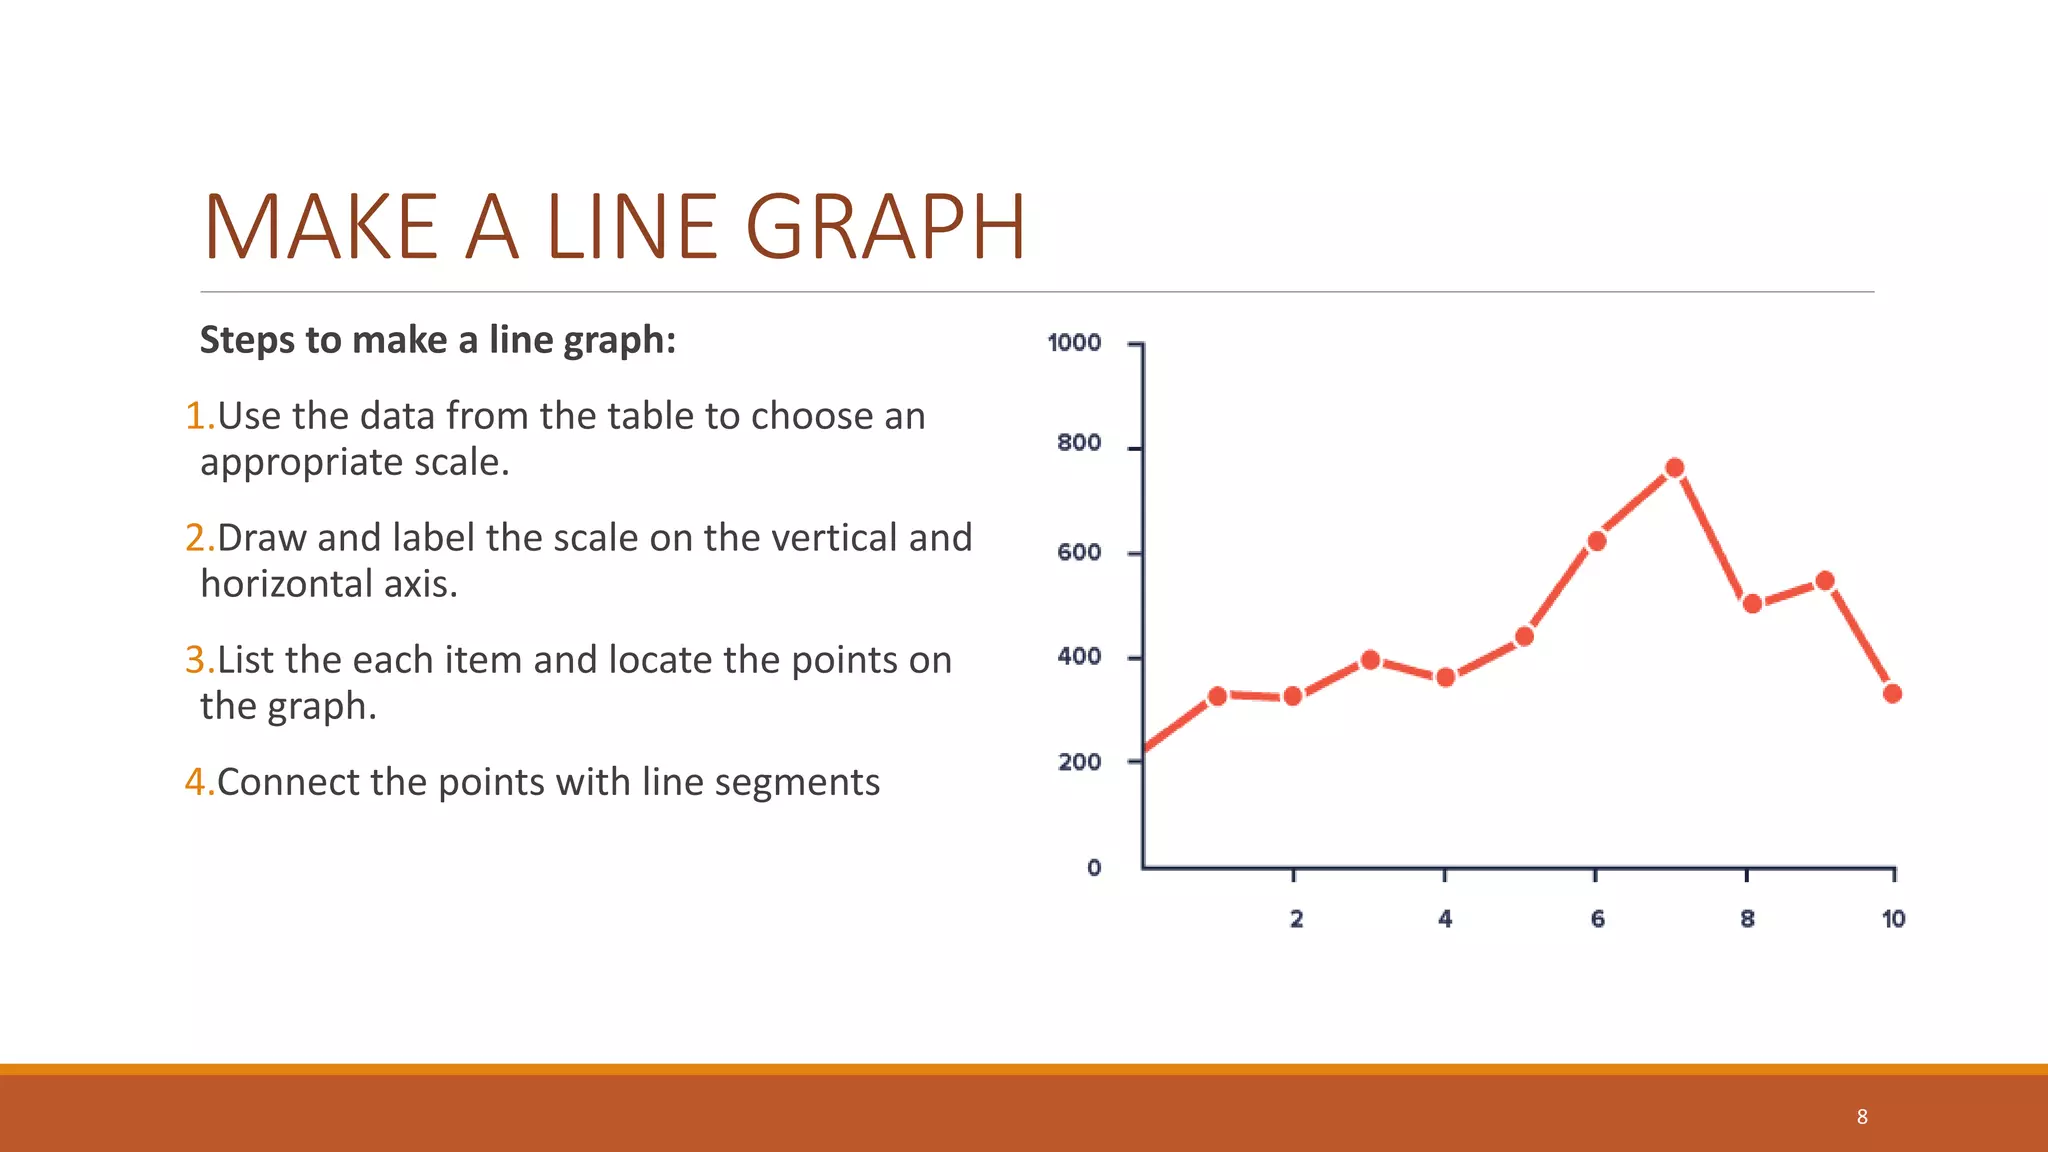
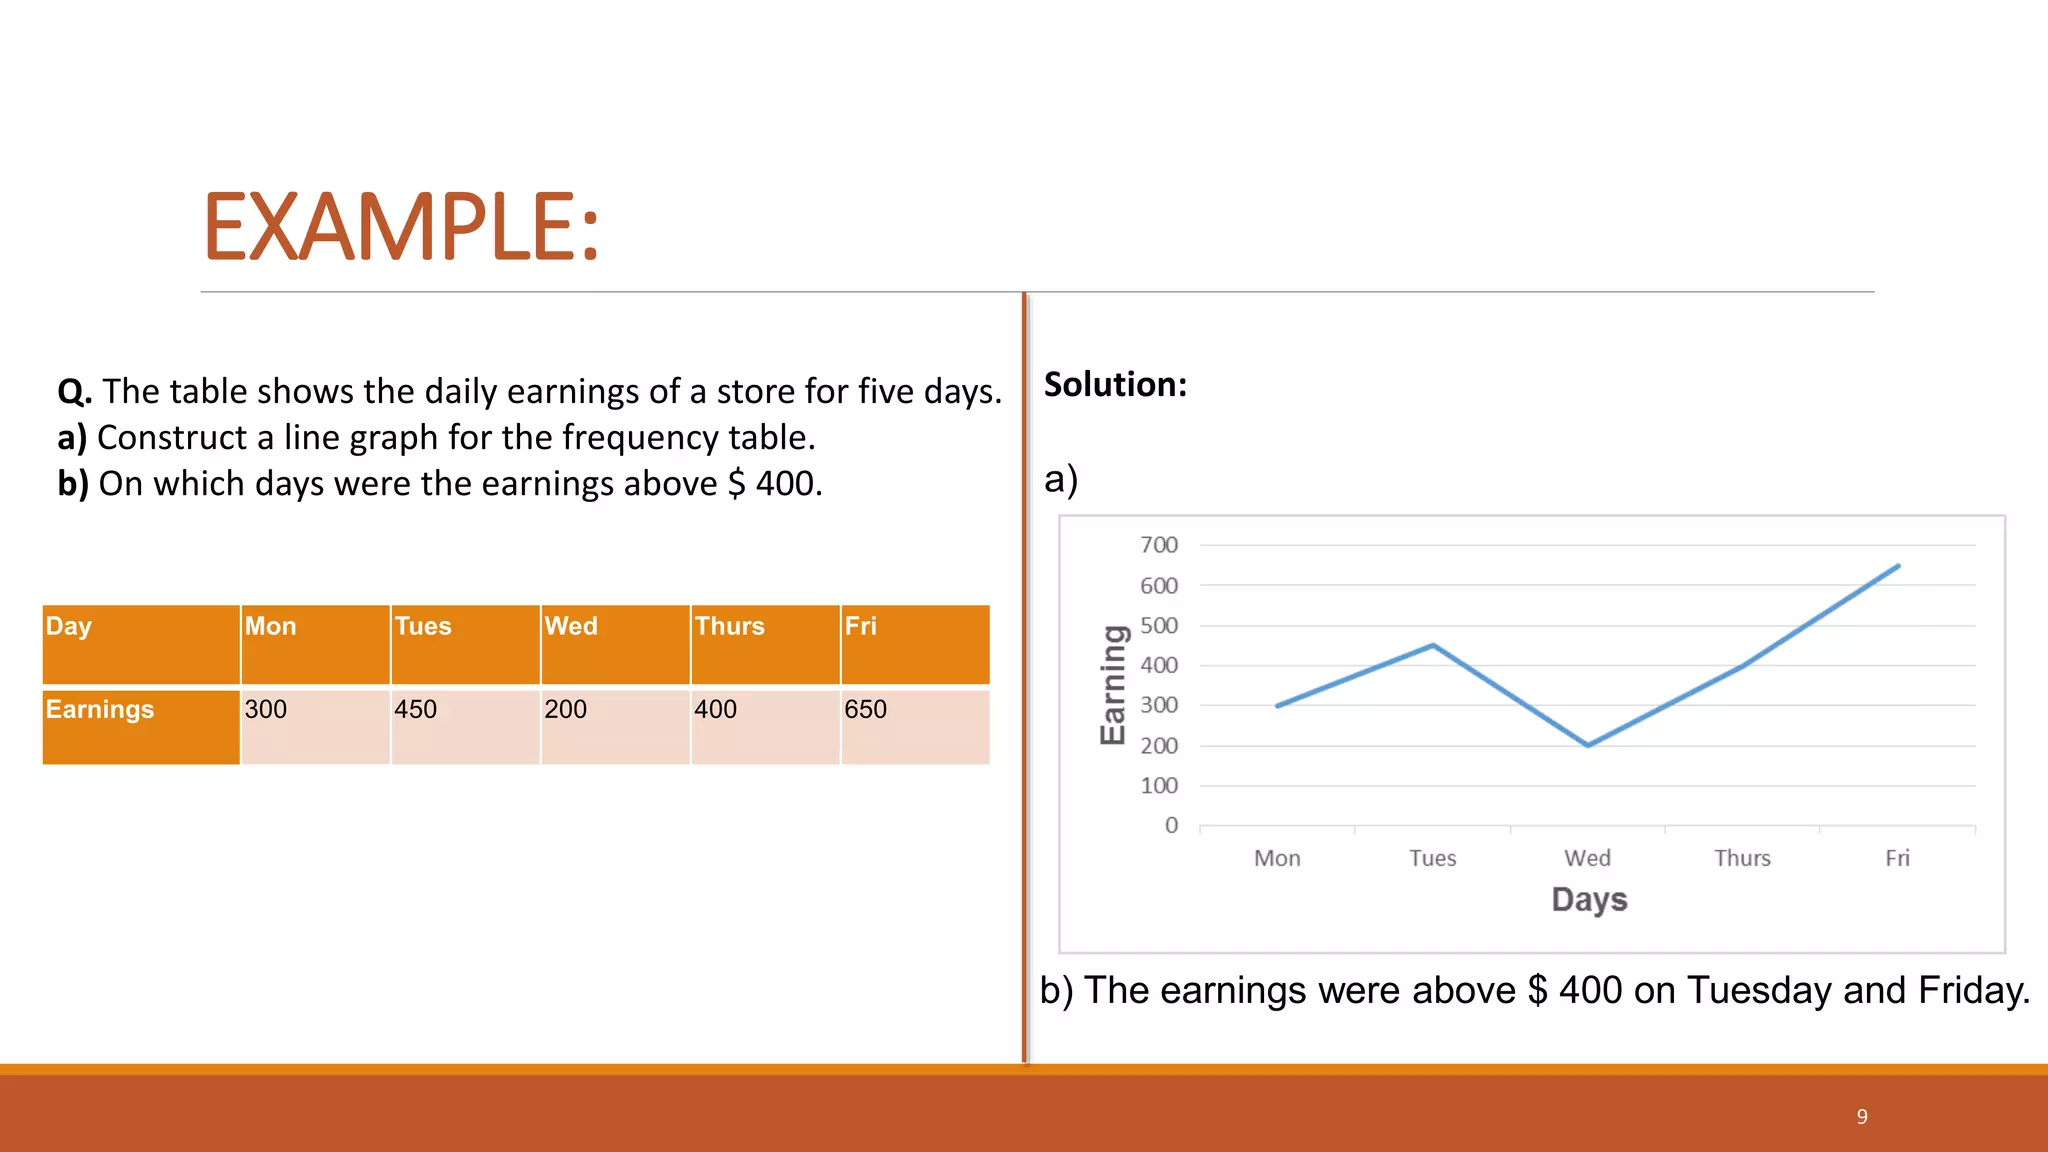
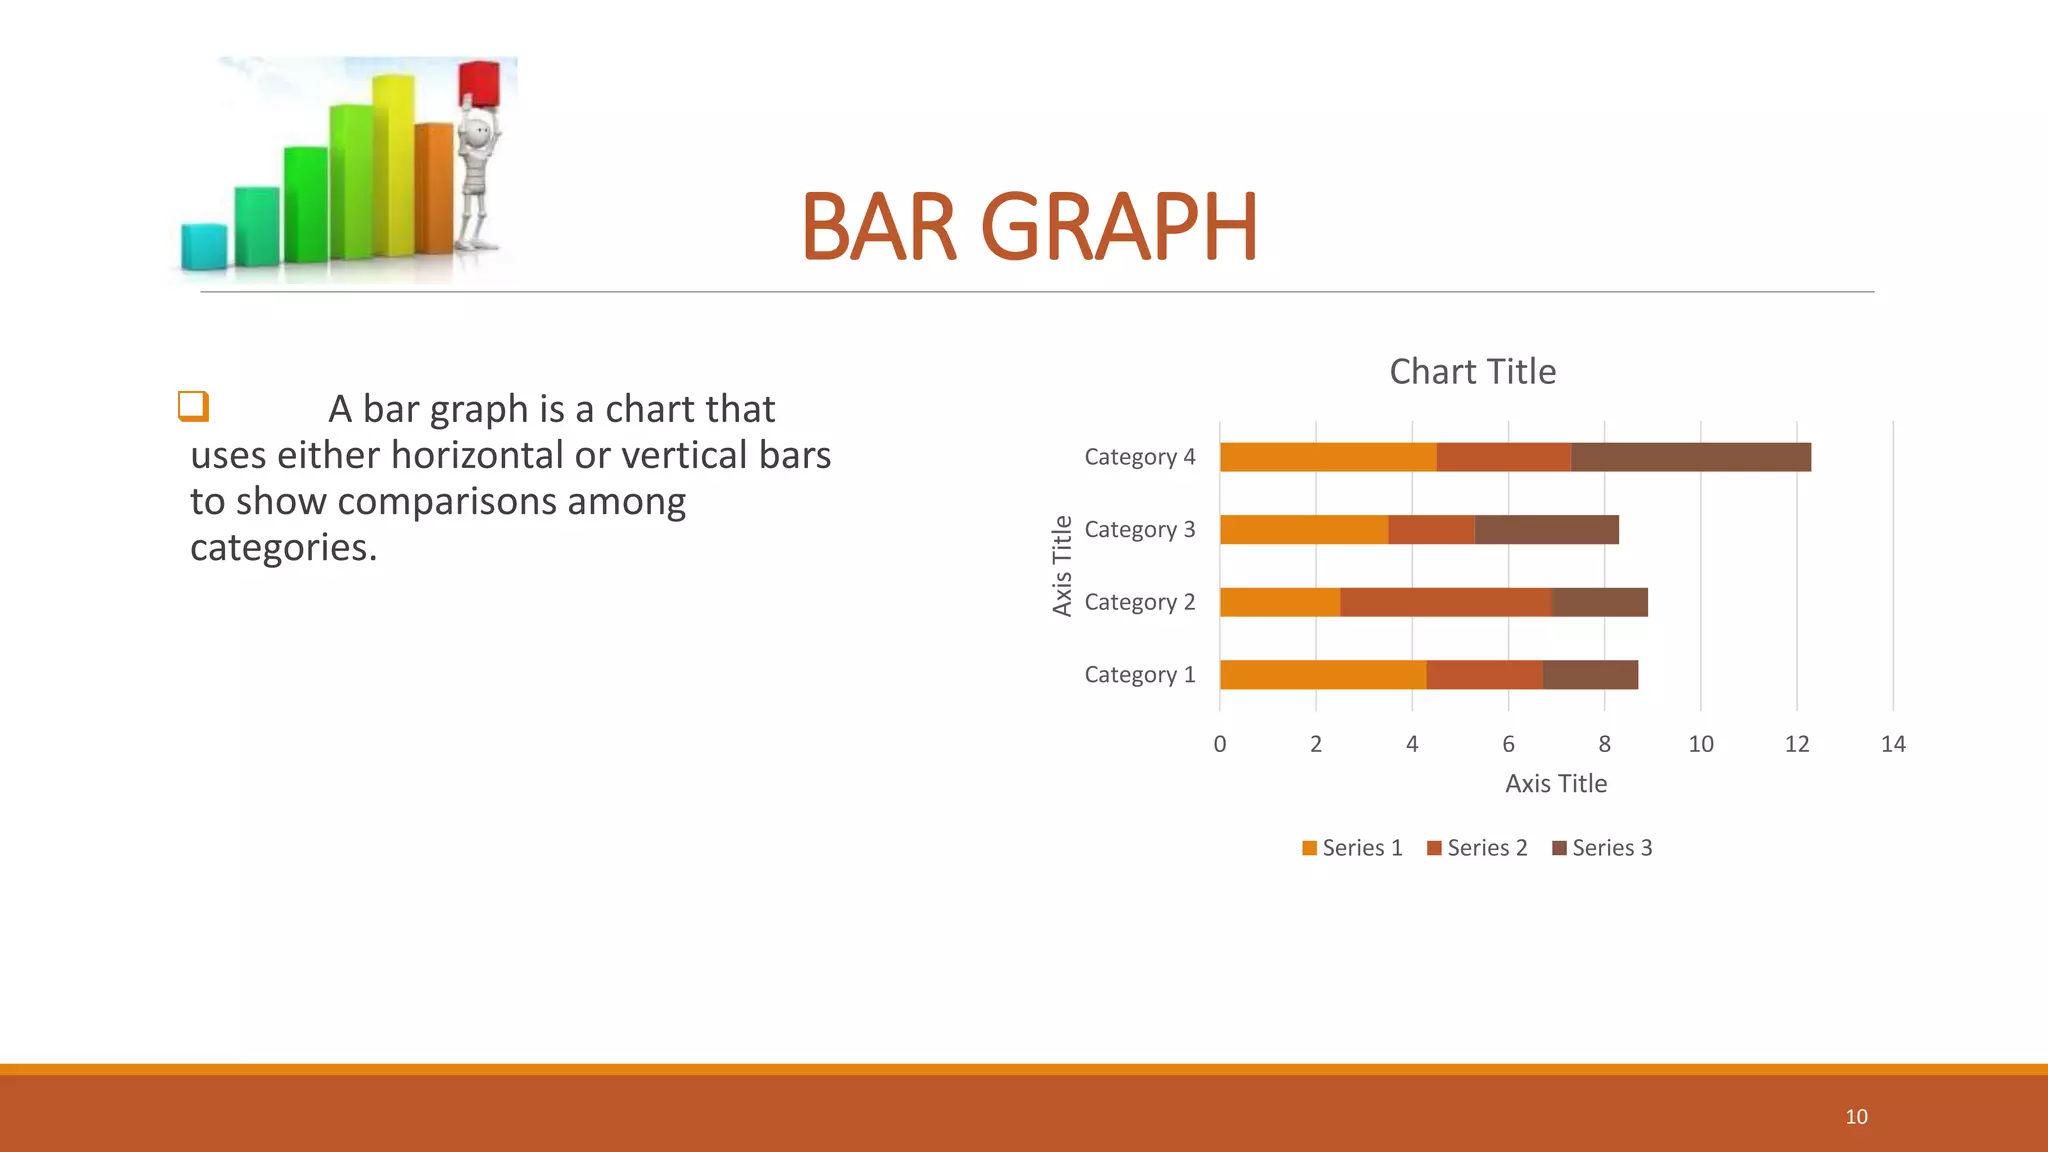
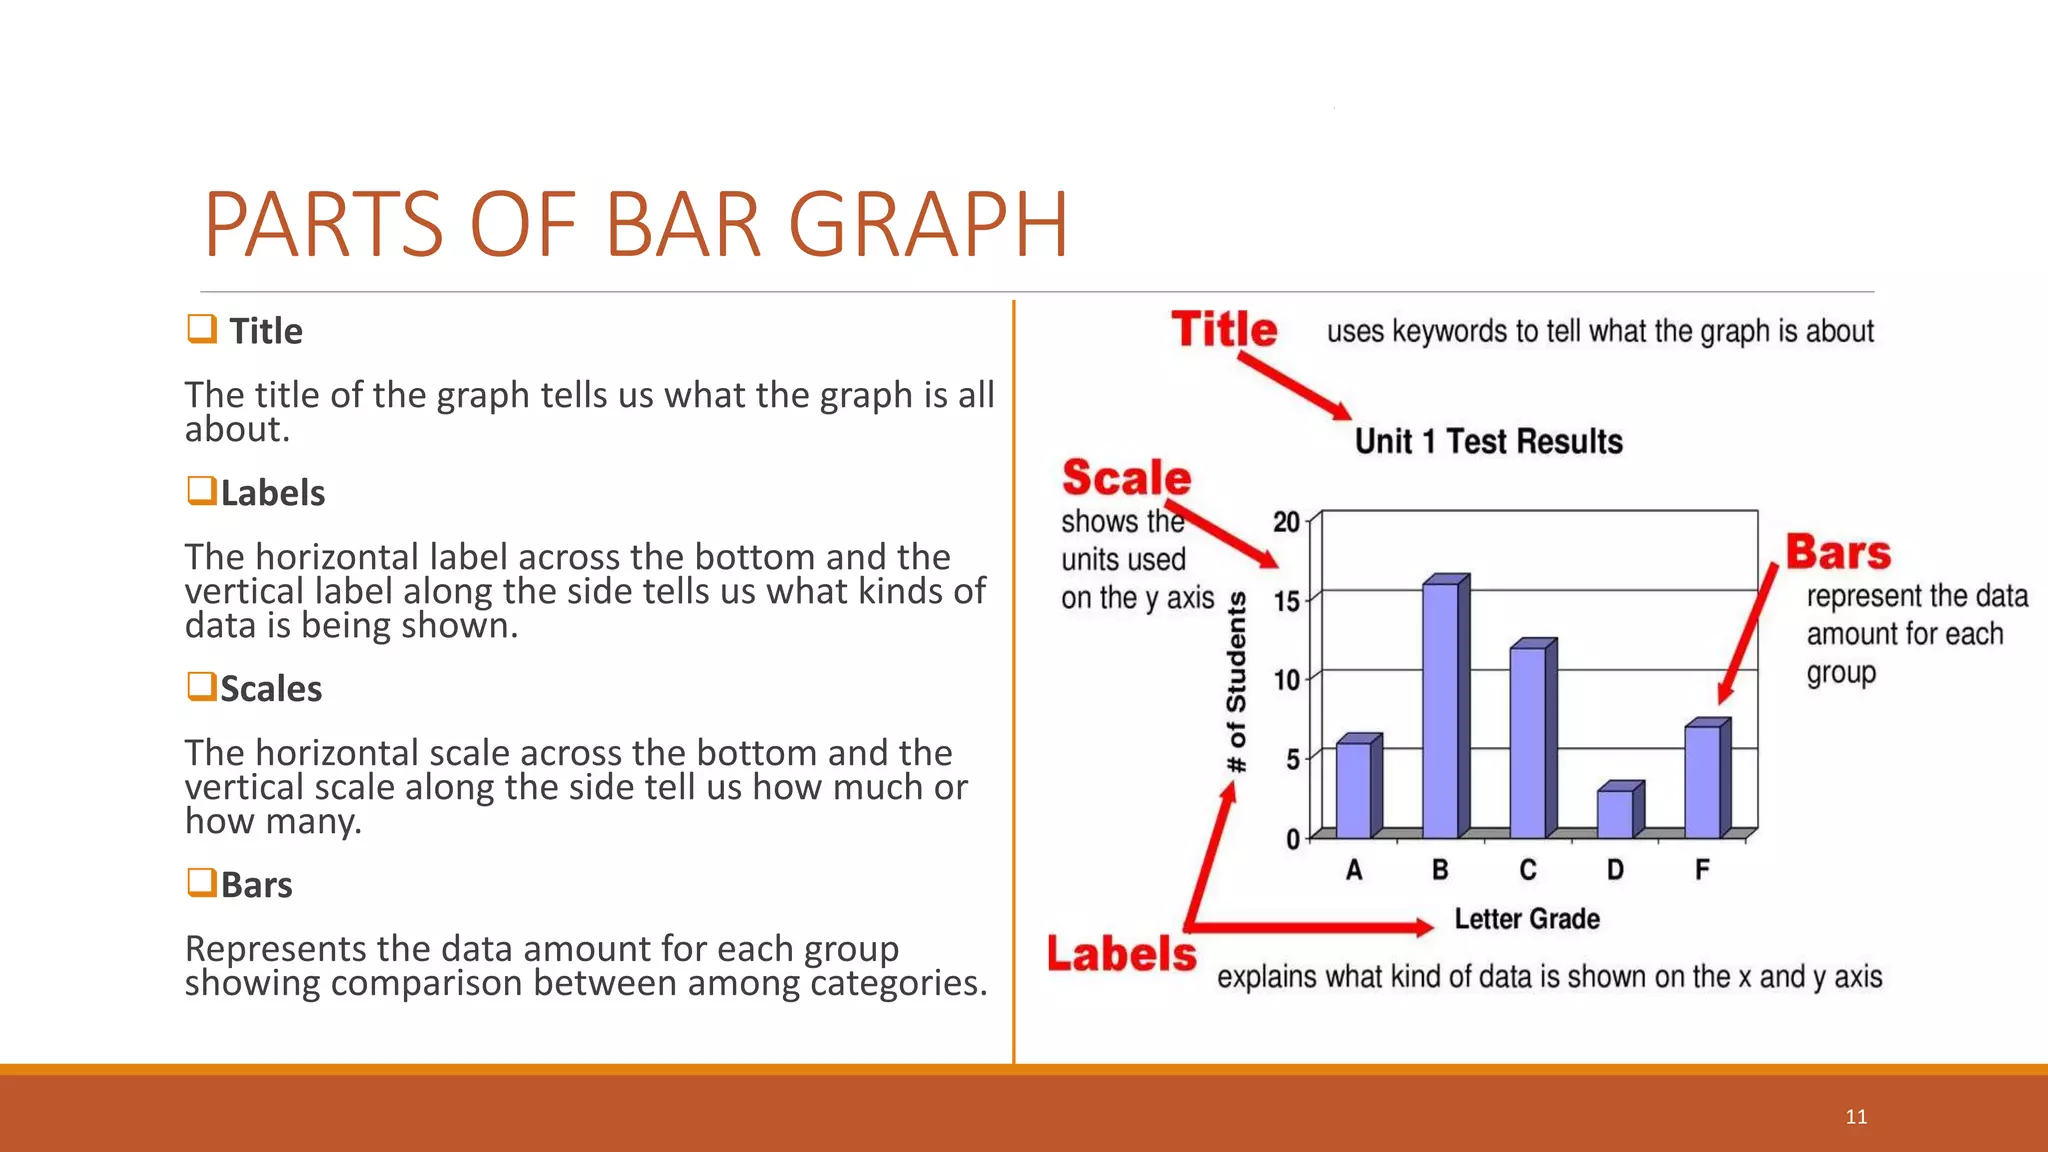
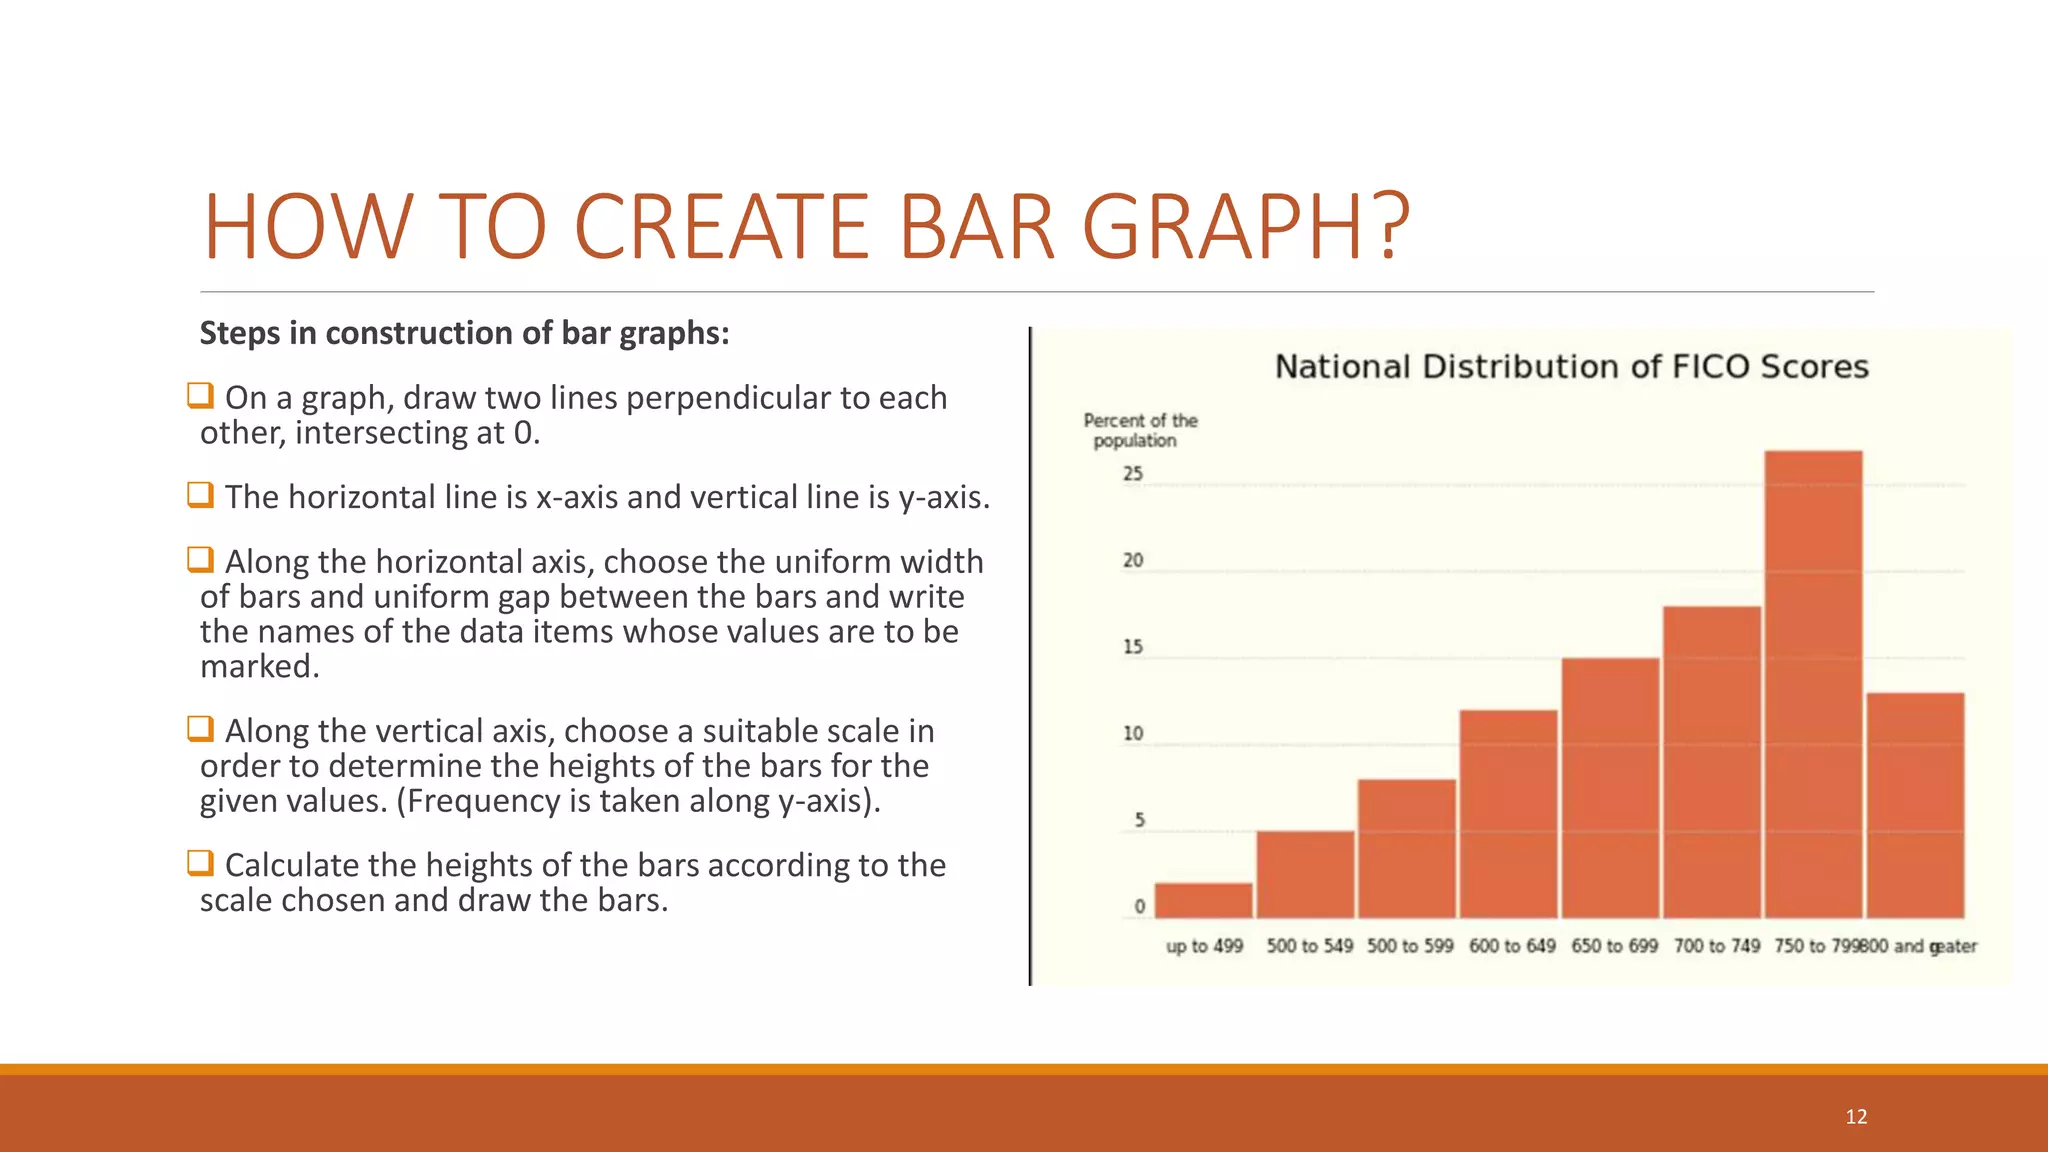
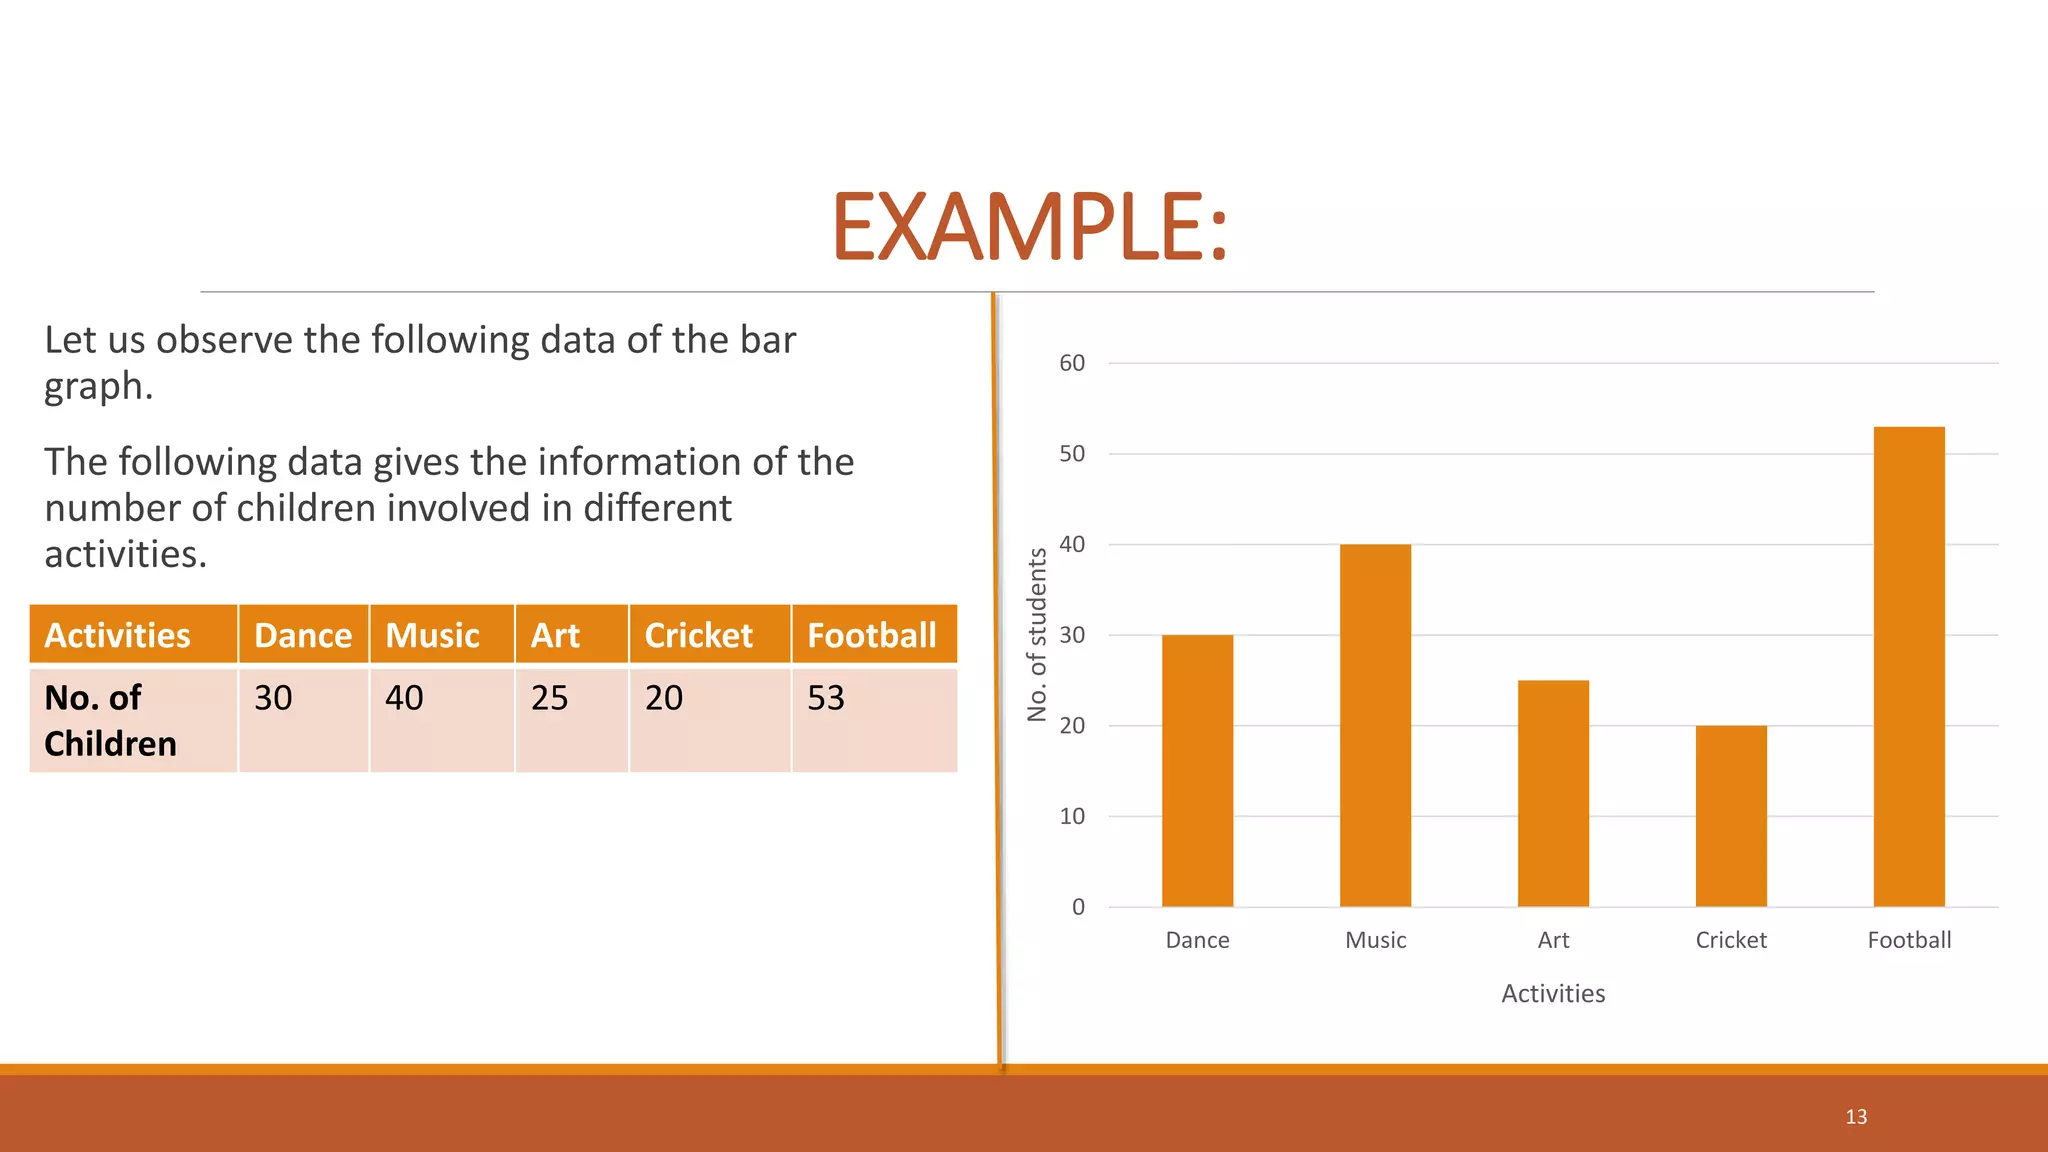


This document provides information about different types of graphs, including line graphs and bar graphs. It defines a line graph as a diagram that connects points on an x-y plane to show the relationship between two variables. Bar graphs use vertical or horizontal bars to show comparisons between categories. The document explains the key parts of line graphs and bar graphs, such as the title, labels, scales, points and bars. It also provides steps to construct a line graph using sample data on daily earnings. For bar graphs, it outlines how to create bars of uniform width and height according to a chosen scale. An example bar graph shows the number of children in different activities.


![[DSC Europe 25] Andy Cotgreave - Nothing is new in analytics.pptx](https://cdn.slidesharecdn.com/ss_thumbnails/mba4vzcurvoh5lfrd5zw-6-251205194645-341bbbbe-thumbnail.jpg?width=640&height=640&fit=bounds)


![[DSC Europe 25] Jim Sterne - Adopting Generative AI Capabilities Into the Ent...](https://cdn.slidesharecdn.com/ss_thumbnails/sxhpofuorcagxsaulkmt-3-251204082258-7e66bc48-thumbnail.jpg?width=640&height=640&fit=bounds)


![[DSC Europe 25] Petar Zivanov - AI meets documents From chatbots to AI-powere...](https://cdn.slidesharecdn.com/ss_thumbnails/xer2bb6nrdc8pdpev0pc-8-251204082258-7c2fa4a1-thumbnail.jpg?width=640&height=640&fit=bounds)

