Download to read offline

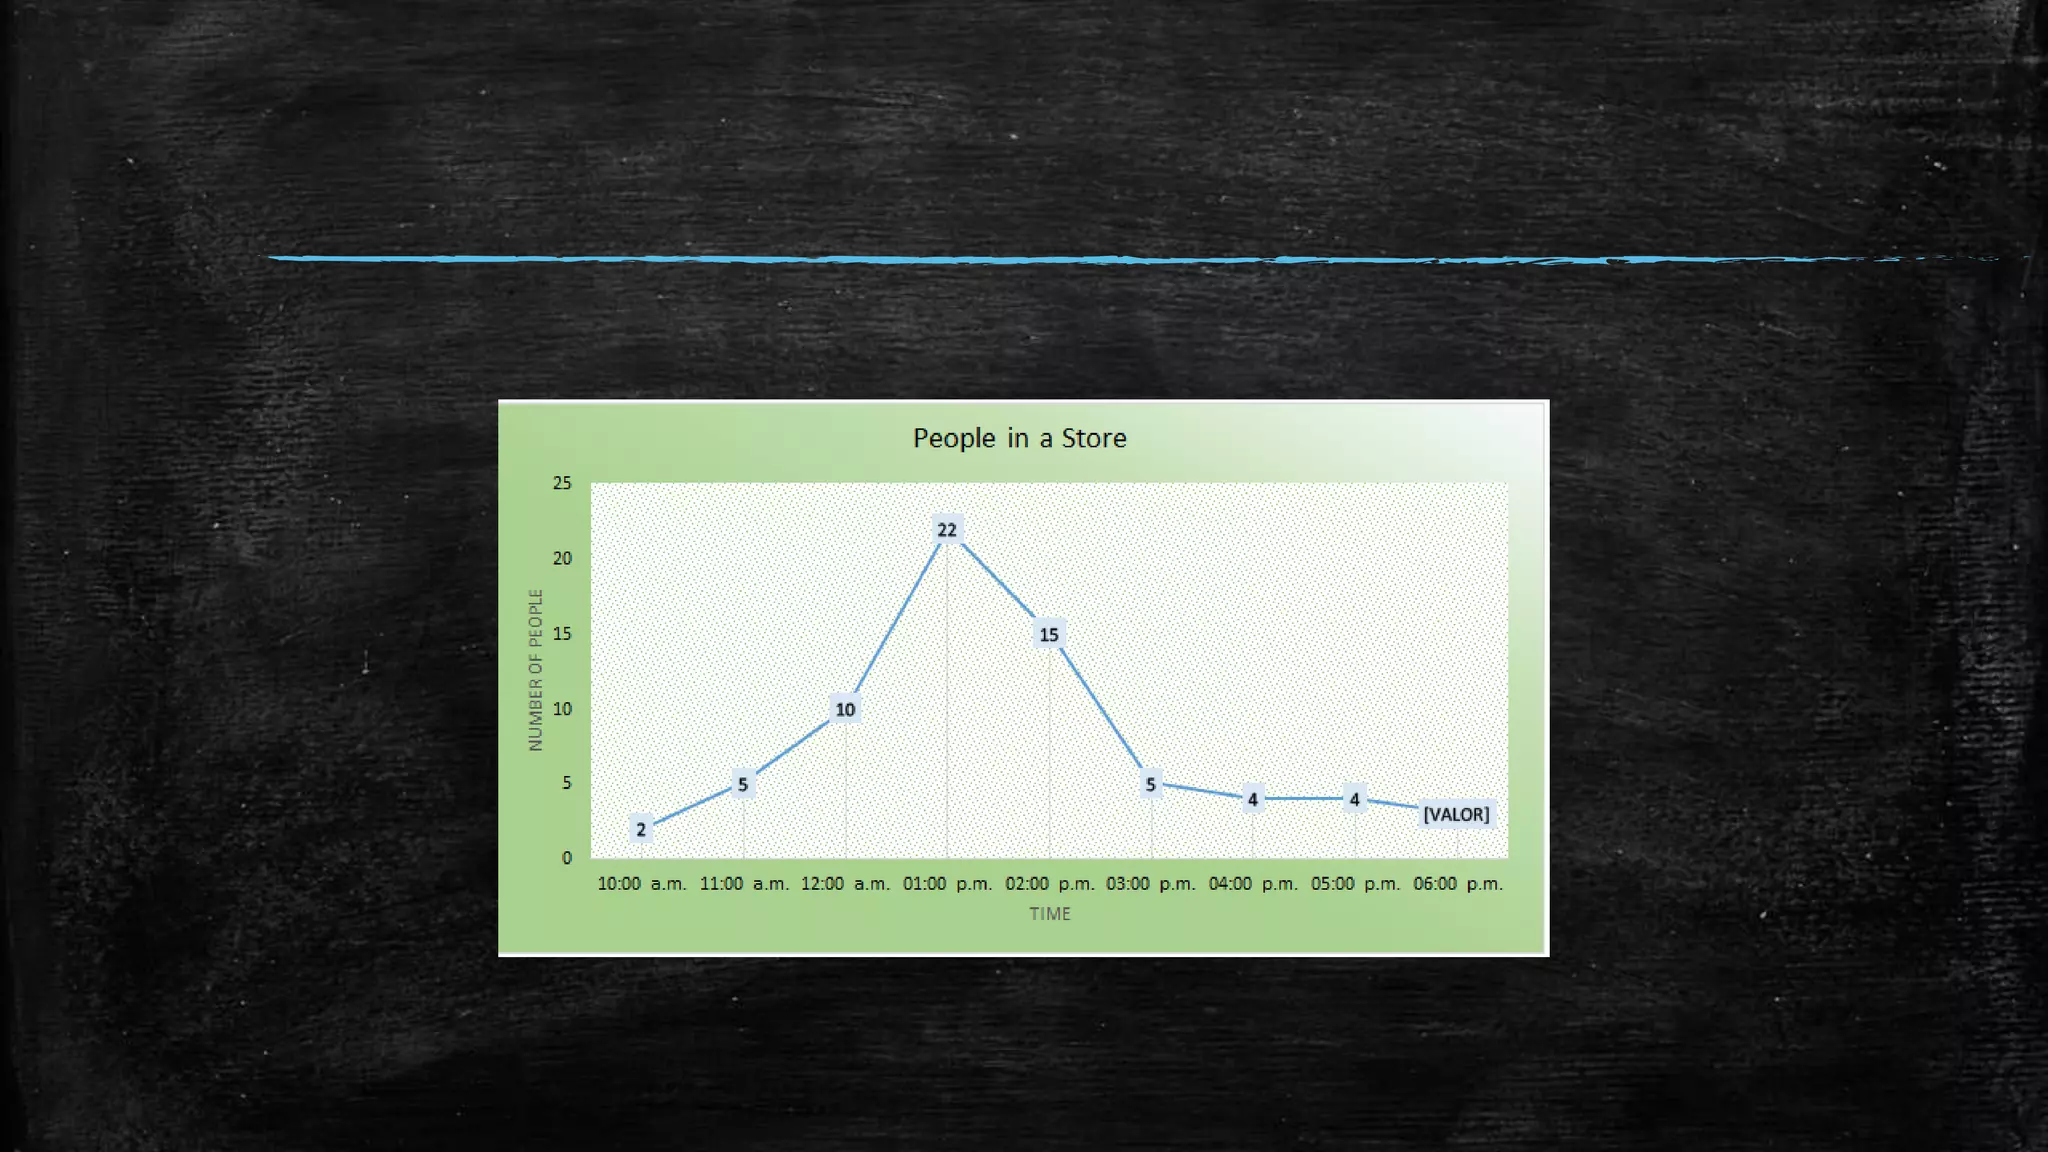
The line graph shows the number of people in a store over the course of a day. It peaked at 1 PM with 22 people, and was at its lowest when the store opened at 10 AM with 2 people. The busiest time was 1 PM, but then the number of customers gradually fell throughout the afternoon.


