Download to read offline


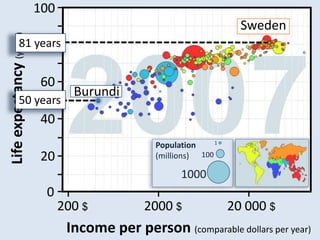


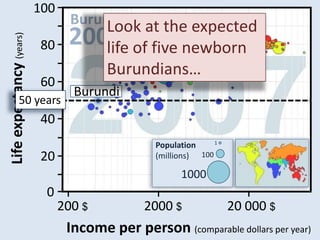

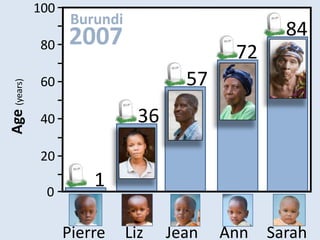

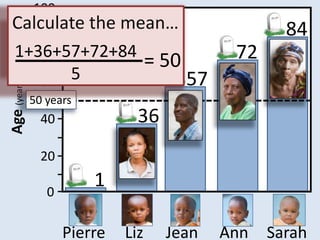
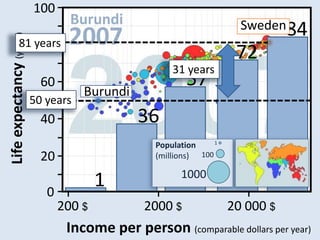


This document contains a powerpoint presentation about life expectancy. It aims to illustrate that (1) life expectancy is an average and (2) when life expectancy is low, it is often due to high child mortality rates. It does this by comparing the expected lifespans of 5 newborns in Burundi to 5 newborns in Sweden. The average life expectancy in Burundi is 50 years due to high child mortality, while in Sweden it is 81 years with lower child mortality.