12.4
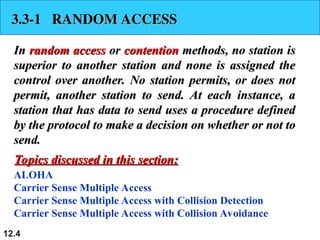
3.3-1 RANDOM ACCESS
3.3-1RANDOM ACCESS
In
In random access
random access or
or contention
contention methods, no station is
methods, no station is
superior to another station and none is assigned the
superior to another station and none is assigned the
control over another. No station permits, or does not
control over another. No station permits, or does not
permit, another station to send. At each instance, a
permit, another station to send. At each instance, a
station that has data to send uses a procedure defined
station that has data to send uses a procedure defined
by the protocol to make a decision on whether or not to
by the protocol to make a decision on whether or not to
send.
send.
ALOHA
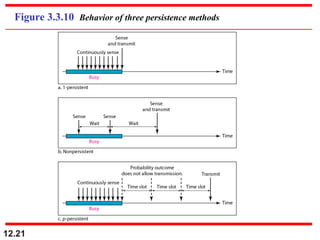
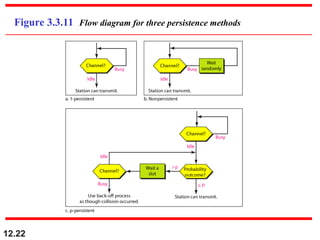
Carrier Sense Multiple Access
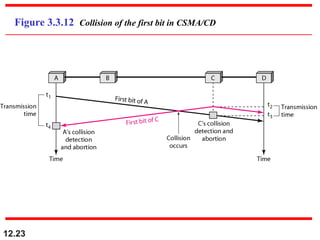
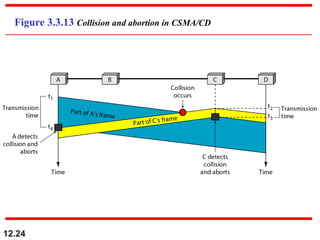
Carrier Sense Multiple Access with Collision Detection
Carrier Sense Multiple Access with Collision Avoidance
Topics discussed in this section:
Topics discussed in this section:
12.7
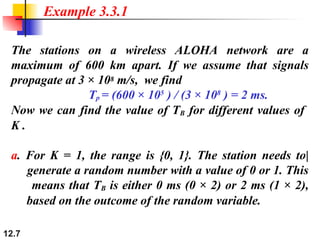
The stations ona wireless ALOHA network are a
maximum of 600 km apart. If we assume that signals
propagate at 3 × 10⁸ m/s, we find
Tp = (600 × 105
) / (3 × 10⁸
) = 2 ms.
Now we can find the value of TB for different values of
K .
a. For K = 1, the range is {0, 1}. The station needs to|
generate a random number with a value of 0 or 1. This
means that TB is either 0 ms (0 × 2) or 2 ms (1 × 2),
based on the outcome of the random variable.
Example 3.3.1
8.
12.8
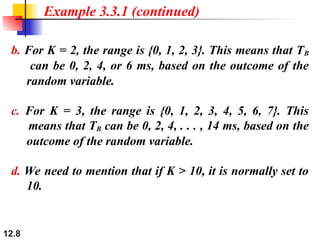
b. For K= 2, the range is {0, 1, 2, 3}. This means that TB
can be 0, 2, 4, or 6 ms, based on the outcome of the
random variable.
c. For K = 3, the range is {0, 1, 2, 3, 4, 5, 6, 7}. This
means that TB can be 0, 2, 4, . . . , 14 ms, based on the
outcome of the random variable.
d. We need to mention that if K > 10, it is normally set to
10.
Example 3.3.1 (continued)
12.10
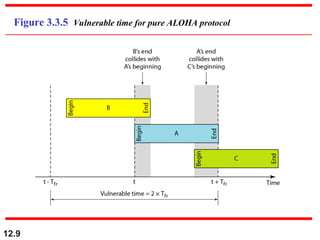
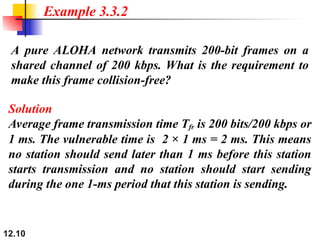
A pure ALOHAnetwork transmits 200-bit frames on a
shared channel of 200 kbps. What is the requirement to
make this frame collision-free?
Example 3.3.2
Solution
Average frame transmission time Tfr is 200 bits/200 kbps or
1 ms. The vulnerable time is 2 × 1 ms = 2 ms. This means
no station should send later than 1 ms before this station
starts transmission and no station should start sending
during the one 1-ms period that this station is sending.
11.
12.11
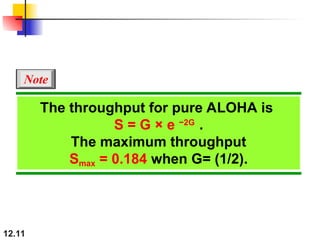
The throughput forpure ALOHA is
S = G × e −2G
.
The maximum throughput
Smax = 0.184 when G= (1/2).
Note
12.
12.12
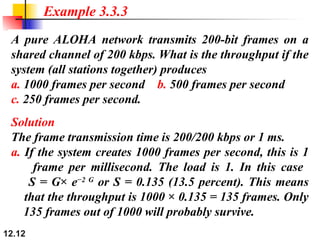
A pure ALOHAnetwork transmits 200-bit frames on a
shared channel of 200 kbps. What is the throughput if the
system (all stations together) produces
a. 1000 frames per second b. 500 frames per second
c. 250 frames per second.
Example 3.3.3
Solution
The frame transmission time is 200/200 kbps or 1 ms.
a. If the system creates 1000 frames per second, this is 1
frame per millisecond. The load is 1. In this case
S = G× e−2 G
or S = 0.135 (13.5 percent). This means
that the throughput is 1000 × 0.135 = 135 frames. Only
135 frames out of 1000 will probably survive.
13.
12.13
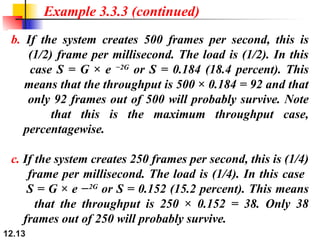
Example 3.3.3 (continued)
b.If the system creates 500 frames per second, this is
(1/2) frame per millisecond. The load is (1/2). In this
case S = G × e −2G
or S = 0.184 (18.4 percent). This
means that the throughput is 500 × 0.184 = 92 and that
only 92 frames out of 500 will probably survive. Note
that this is the maximum throughput case,
percentagewise.
c. If the system creates 250 frames per second, this is (1/4)
frame per millisecond. The load is (1/4). In this case
S = G × e −2G
or S = 0.152 (15.2 percent). This means
that the throughput is 250 × 0.152 = 38. Only 38
frames out of 250 will probably survive.
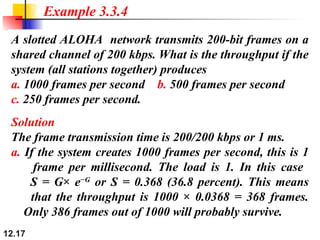
12.17
A slotted ALOHAnetwork transmits 200-bit frames on a
shared channel of 200 kbps. What is the throughput if the
system (all stations together) produces
a. 1000 frames per second b. 500 frames per second
c. 250 frames per second.
Example 3.3.4
Solution
The frame transmission time is 200/200 kbps or 1 ms.
a. If the system creates 1000 frames per second, this is 1
frame per millisecond. The load is 1. In this case
S = G× e−G
or S = 0.368 (36.8 percent). This means
that the throughput is 1000 × 0.0368 = 368 frames.
Only 386 frames out of 1000 will probably survive.
18.
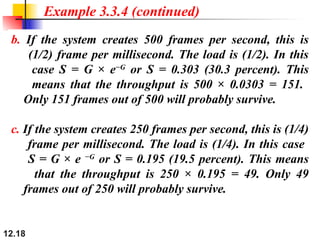
12.18
Example 3.3.4 (continued)
b.If the system creates 500 frames per second, this is
(1/2) frame per millisecond. The load is (1/2). In this
case S = G × e−G
or S = 0.303 (30.3 percent). This
means that the throughput is 500 × 0.0303 = 151.
Only 151 frames out of 500 will probably survive.
c. If the system creates 250 frames per second, this is (1/4)
frame per millisecond. The load is (1/4). In this case
S = G × e −G
or S = 0.195 (19.5 percent). This means
that the throughput is 250 × 0.195 = 49. Only 49
frames out of 250 will probably survive.
12.25
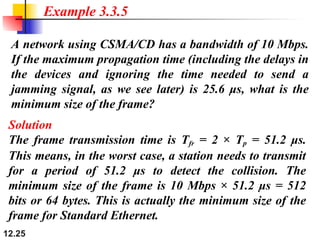
A network usingCSMA/CD has a bandwidth of 10 Mbps.
If the maximum propagation time (including the delays in
the devices and ignoring the time needed to send a
jamming signal, as we see later) is 25.6 μs, what is the
minimum size of the frame?
Example 3.3.5
Solution
The frame transmission time is Tfr = 2 × Tp = 51.2 μs.
This means, in the worst case, a station needs to transmit
for a period of 51.2 μs to detect the collision. The
minimum size of the frame is 10 Mbps × 51.2 μs = 512
bits or 64 bytes. This is actually the minimum size of the
frame for Standard Ethernet.
12.29
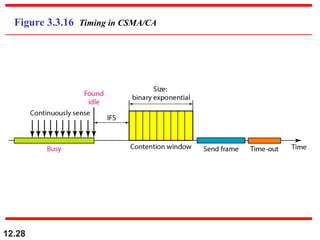
In CSMA/CA, theIFS can also be used to
define the priority of a station or a
frame.
Note
30.
12.30
In CSMA/CA, ifthe station finds the
channel busy, it does not restart the
timer of the contention window;
it stops the timer and restarts it when
the channel becomes idle.
Note
12.32
3.3-2 CONTROLLED ACCESS
3.3-2CONTROLLED ACCESS
In
In controlled access
controlled access, the stations consult one another
, the stations consult one another
to find which station has the right to send. A station
to find which station has the right to send. A station
cannot send unless it has been authorized by other
cannot send unless it has been authorized by other
stations. We discuss three popular controlled-access
stations. We discuss three popular controlled-access
methods.
methods.
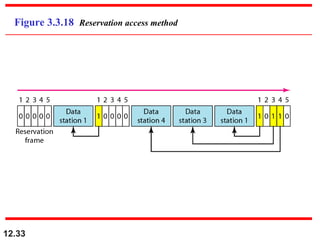
Reservation
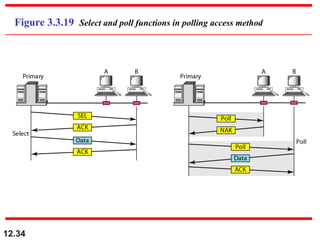
Polling
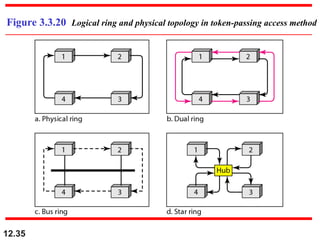
Token Passing
Topics discussed in this section:
Topics discussed in this section:
12.36
3.3-3 CHANNELIZATION
3.3-3 CHANNELIZATION
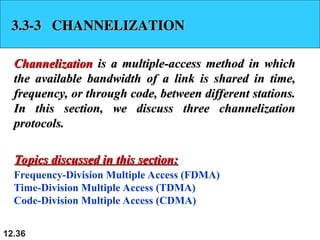
Channelization
Channelizationis a multiple-access method in which
is a multiple-access method in which
the available bandwidth of a link is shared in time,
the available bandwidth of a link is shared in time,
frequency, or through code, between different stations.
frequency, or through code, between different stations.
In this section, we discuss three channelization
In this section, we discuss three channelization
protocols.
protocols.
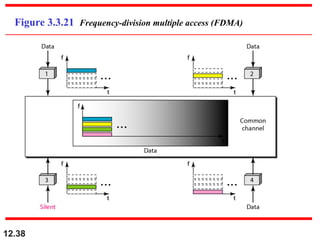
Frequency-Division Multiple Access (FDMA)
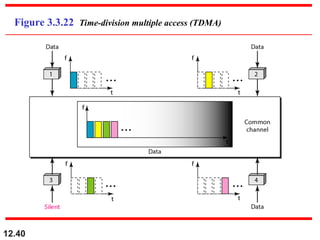
Time-Division Multiple Access (TDMA)
Code-Division Multiple Access (CDMA)
Topics discussed in this section:
Topics discussed in this section:
37.
12.37
We see theapplication of all these
methods in Chapter 16 when
we discuss cellular phone systems.
Note
12.51
Find the chipsfor a network with
a. Two stations b. Four stations
Example 3.3.6
Solution
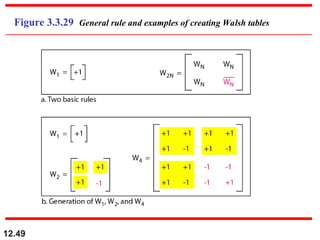
We can use the rows of W2 and W4 in Figure 12.29:
a. For a two-station network, we have
[+1 +1] and [+1 −1].
b. For a four-station network we have
[+1 +1 +1 +1], [+1 −1 +1 −1],
[+1 +1 −1 −1], and [+1 −1 −1 +1].
52.
12.52
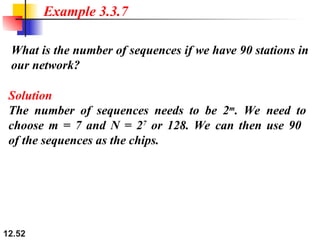
What is thenumber of sequences if we have 90 stations in
our network?
Example 3.3.7
Solution
The number of sequences needs to be 2m
. We need to
choose m = 7 and N = 27
or 128. We can then use 90
of the sequences as the chips.
53.
12.53
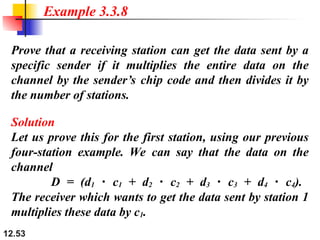
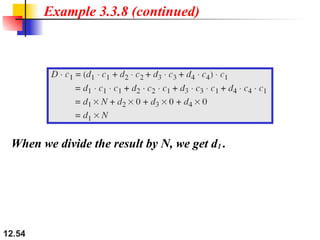
Prove that areceiving station can get the data sent by a
specific sender if it multiplies the entire data on the
channel by the sender’s chip code and then divides it by
the number of stations.
Example 3.3.8
Solution
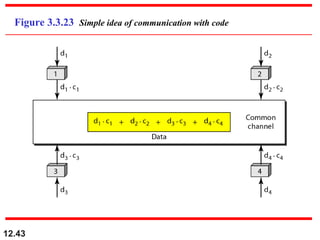
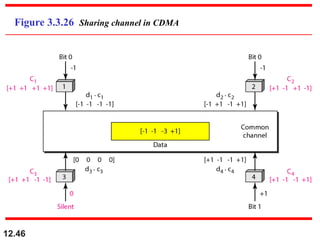
Let us prove this for the first station, using our previous
four-station example. We can say that the data on the
channel
D = (d1 c
⋅ 1 + d2 c
⋅ 2 + d3 c
⋅ 3 + d4 c
⋅ 4).
The receiver which wants to get the data sent by station 1
multiplies these data by c1.


![12.51
Find the chips for a network with
a. Two stations b. Four stations
Example 3.3.6
Solution
We can use the rows of W2 and W4 in Figure 12.29:
a. For a two-station network, we have
[+1 +1] and [+1 −1].
b. For a four-station network we have
[+1 +1 +1 +1], [+1 −1 +1 −1],
[+1 +1 −1 −1], and [+1 −1 −1 +1].](https://image.slidesharecdn.com/lesson3-250427145227-96a6a250/85/Lesson-3-3-Multiple-Access-pptLesson_3-2-Data-link-Control-ppt-51-320.jpg)