Download as PDF, PPTX


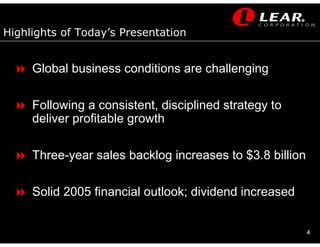

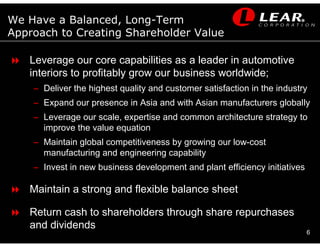


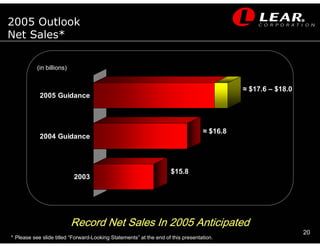


This document contains the agenda and presentation slides for Lear Corporation's 2005 Detroit Auto Conference. Some key points: 1) Lear provides an overview of its global business and strategy, noting challenging business conditions but a focus on profitable growth. 2) Financial highlights include a $3.8 billion three-year sales backlog and a solid 2005 financial outlook with an increased dividend. 3) The operating review discusses mitigating higher raw material costs, quality improvements, new investments, and major 2005 product launches. 4) Financial guidance for 2005 assumes slightly higher North American but stable European vehicle production volumes.


