Download to read offline
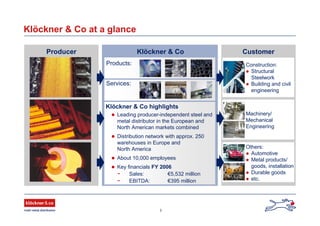


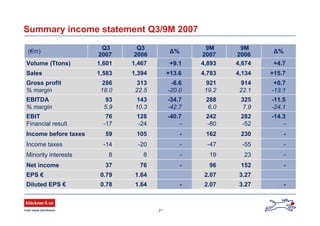
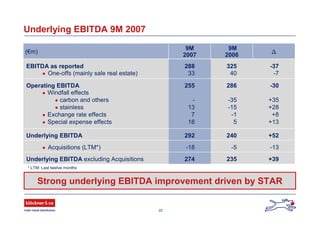
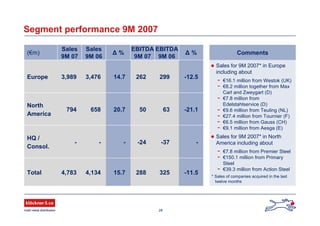
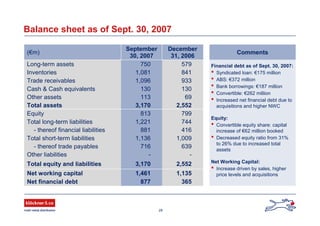
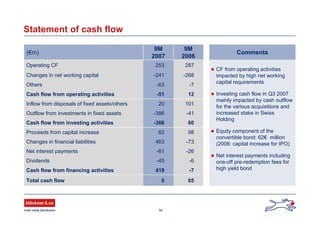
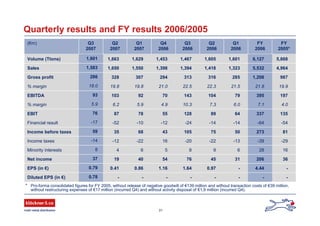

This document provides an overview of Klöckner & Co, a leading multi-metal distributor. It summarizes Klöckner & Co's Q3 2007 performance, market outlook, and growth initiatives. In Q3 2007, Klöckner & Co saw sales increase 15.7% to €1.394 billion, with EBITDA decreasing 34.7% to €76 million due to weaker margins, particularly for stainless steel. For 2007, guidance for reported EBITDA was revised to approximately 10% below 2006. The document outlines market expectations for a positive 2008, with rising steel prices in Europe and North America. Klöckner & Co is pursuing profitable growth through acquis


