Download to read offline

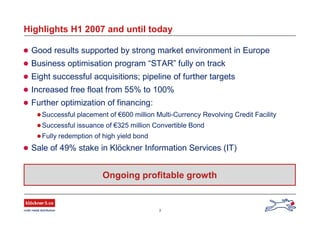
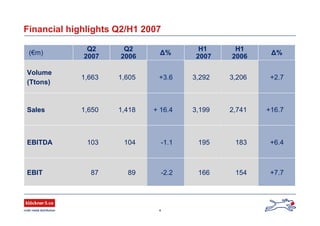
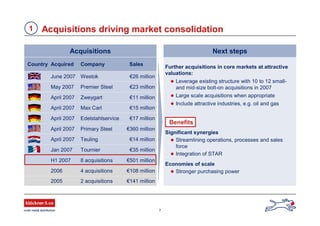
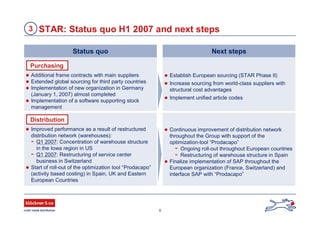
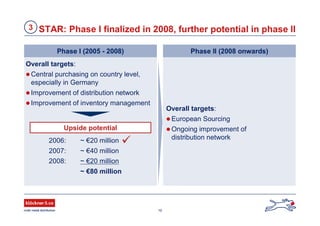
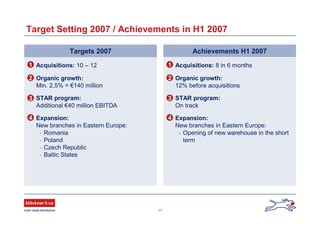
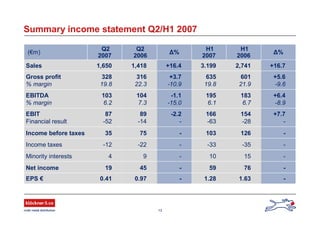
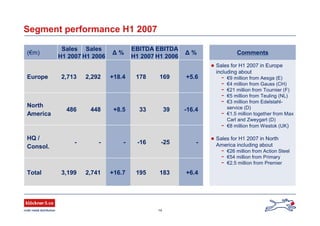
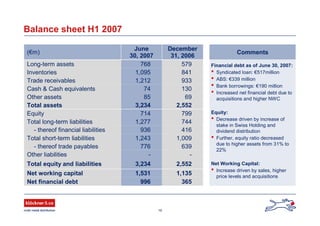
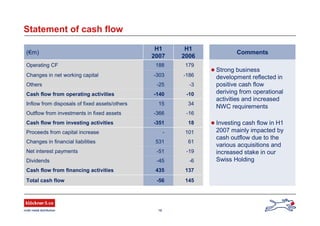
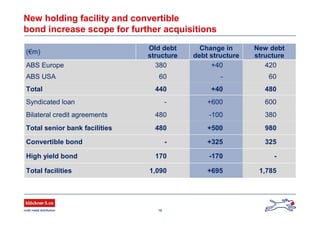
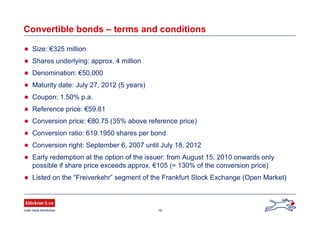
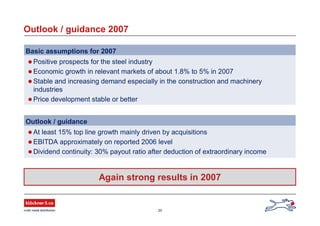
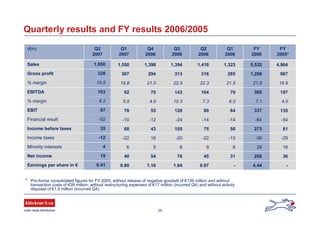

Klöckner & Co AG reported strong results for the first half of 2007, supported by robust demand in Europe. The company completed eight acquisitions during the period and its business optimization program "STAR" was on track. Klöckner also increased its free float to 100% and optimized its financing through a new revolving credit facility and a €325 million convertible bond issuance. Management outlined targets for continued growth both organically and through acquisitions in its core European and North American markets.


