Kingfisher airlines ratio_analysis_txt
•Download as DOCX, PDF•
0 likes•167 views

Kingfisher airlines ratio_analysis

Recommended
More Related Content
Viewers also liked
Viewers also liked (14)
Similar to Kingfisher airlines ratio_analysis_txt
Similar to Kingfisher airlines ratio_analysis_txt (20)
Recently uploaded
Recently uploaded (20)
Kingfisher airlines ratio_analysis_txt
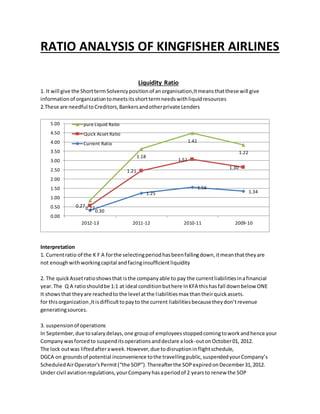
- 1. RATIO ANALYSIS OF KINGFISHER AIRLINES Liquidity Ratio 1. It will give the ShorttermSolvencypositionof anorganisation,Itmeansthatthese will give informationof organizationtomeetsitsshorttermneedswithliquidresources 2.These are needful toCreditors,Bankersandotherprivate Lenders Interpretation 1. Currentratio of the K F A forthe selectingperiodhasbeenfallingdown,itmeanthattheyare not enoughwithworkingcapital andfacinginsufficientliquidity 2. The quickAssetratioshowsthat isthe companyable to pay the currentliabilitiesinafinancial year.The Q A ratioshouldbe 1:1 at ideal conditionbuthere InKFA thishasfall downbelow ONE It showsthat theyare reachedto the level atthe liabilitiesmax thantheirquickassets. for thisorganization,Itisdifficulttopayto the current liabilitiesbecausetheydon’trevenue generatingsources. 3. suspensionof operations In September,due tosalarydelays,one groupof employeesstoppedcomingtoworkandhence your Companywasforcedto suspenditsoperationsanddeclare alock-outonOctober01, 2012. The lock outwas liftedafteraweek.However,due todisruptioninflightschedule, DGCA on groundsof potential inconvenience tothe travellingpublic,suspendedyourCompany’s ScheduledAirOperator'sPermit(“the SOP”).Thereafterthe SOPexpiredonDecember31,2012. Under civil aviationregulations,yourCompanyhasaperiodof 2 yearsto renew the SOP 0.30 1.25 1.56 1.34 0.27 1.21 1.51 1.30 0.27 1.18 1.41 1.22 0.00 0.50 1.00 1.50 2.00 2.50 3.00 3.50 4.00 4.50 5.00 2012-13 2011-12 2010-11 2009-10 pure Liquid Ratio Quick Asset Ratio Current Ratio
- 2. Solvency Ratio !. It will showthe abilityof anorganizationtomeetitsobligationinthe longterm 2. It useful forcreditor,Investorsandlongtermmoneylenders Interpretation 1. The DebtEquityRatiois increased,itshowsthe debtsismore thanthe share holdersfund i.e.In2010 is 21.83, in2010 the share capital wasonly362 cr rupees.After2010 theyincreased networth raisedfundsfrom preference sharesis480 cr rupeesandshare equity200 cr. 2. Here networthincrease from362 cr to 1050 cr rupeesie.Theyraisedfundsin 190% than earlierfundsbutthe saleswasincreasedbyonly 14% . Fromthis we can assume that the raisedcapital notproperlyutilized. 3. From there after everyare increasingequitysharesbutthe securedloanwere clearedalmostall fromthe avgof 5300 cr to 500 cr but theybarrowedunsecuredloans2500 cr to 8000 cr rupees. It showsthat theygotbarrowedfromunsecuredloansclearedsecure loans. 4. Even thoughtheyare increasinginvestmentsbuttheyalsogettinglosesyoy. Every theirlossesanddeferredtax alsoincreasing. 5. In 2013 the saleswere downby90% due to KFA suspendedfromIATA where the more bookings 6.36 7.10 6.58 21.83 110.00 5.00 10.00 15.00 20.00 25.00 2012-13 2011-12 2010-11 2009-10 Solvency Ratios Debt-Equity Ratio
- 3. goingto be done and the continueddisruptionfromthe insidethe organization,suspendedfrom the operationsdue expireof scheduledairoperatorspermit. 6. The saleswere downby90% but they didn’tcontrol the expensesinthe case salariesand Miscellaneous they controlled byonly50%. Turnover Ratios 1. It shows the operational efficiency of an organization, how they utilize their resources to generate Revenue. 2. It measures performance of an organization at different operation like no of times stokes rolled out, the frequency of debt collection , the frequency of creditors payment, cash turnover etc. Interpretation 1. The turnover ratios mainly based on net sales but in this case the sales of the company down by 90% in a year. It will affect the creditor’s purchase, cash turnovers, increasing liabilities. 2. The company STR is in the year 2011-12 is 26% and it is down to 3%. The STR is down by 800% in a year due to sales down by 90%. 3. The FATR, CATR are also not at satisfactory level due to sales down. 4. The CGR of the company decreased due to raised funds from equity and more than the interest bearing securities. 5. But when the CGR is more than one, it is shows that company highly geared , which poses threat to the fund raising. 1.19 13.33 12.13 26.41 0.70 3.81 4.05 3.26 0.24 0.72 0.95 0.96 11.39 14.86 14.99 30.16 0.00 5.00 10.00 15.00 20.00 25.00 30.00 35.00 2012-13 2011-12 2010-11 2009-10 STR FATR CATR CGR
- 4. Profitability Ratios 1.It indicatesthe operationalresultinagivenyear 2.It isimportantto manager,owner,share holder,creditors,bankers,govt.andgeneral public 1. Due to salesdownthe companygetsmore loses,the grossprofitdownby500%, The netprofit downby 800%, the operatingcostincreasedby500% , The returnon capital employedisdownby 100%,The EPS isdownby 10% on yoy 2. These all are affecteddue toonlysalesdown,if the companywantto continue here aftertheyhas to improve theirsales. 3. For the large companytheycan’t able to control expense more than50-40% due to maintainedof operations. -857.86 -42.38 -16.16 -35.04 -67.22 73.61 5.25 4.37 -1000.00 -800.00 -600.00 -400.00 -200.00 0.00 200.00 2012-13 2011-12 2010-11 2009-10 GPR NPR OPR ROCE Eps