Ladder Capital - Investor Presentation (November 2018)
ARES Analysis: Eat Cake and Have Too
1. RBC Capital Markets, LLC
Bulent Ozcan, CFA
(Associate Analyst)
(212) 863-4818
bulent.ozcan@rbccm.com
Outperform
NYSE: ARES; USD 18.17
Price Target USD 23.00
Scenario Analysis*
Downside
Scenario
16.00
12%
Current
Price
18.17
Price
Target
23.00
27%
Upside
Scenario
25.00
38%
*Implied Total Returns
Key Statistics
Shares O/S (MM): 80.4
Dividend: 0.00
Market Cap (MM): 1,461
Yield: 0.0%
RBC Estimates
FY Dec 2013A 2014E 2015E
Distributable 1.47 1.94
DPS 1.13 1.49
Div Yield NM 6.2% 8.2%
ENI 1.59 2.06
FEAUM 59,163.0 67,207.3 76,966.3
Distributable Q1 Q2 Q3 Q4
2014 0.29E 0.35E 0.41E 0.43E
2015 0.45E 0.47E 0.49E 0.52E
Public float: 5.38 %. Strategic Owners: Abu Dhabi Investment Authority
(16.3% of common units); Alleghany Corporation (5.9% of common units)
All values in USD unless otherwise noted.
RBC Capital Markets appreciates your consideration in the 2014 Institutional Investor All-America Research Team survey.
May 27, 2014
Ares Management, L.P.
Eat your cake and have it too
Our view: We believe that Ares Management L.P.'s differentiated business
model sets it apart from its peers and positions the company uniquely. We
think of ARES as the "missing link" between alternative asset managers
and traditional asset managers. Its business model combines the benefits
characteristic of traditional asset managers with the advantages enjoyed
only by alternative asset managers
Key points:
We are initiating coverage of Ares Management L.P. with an Outperform
rating and a $23 price target.We believe that the firm is uniquely
positioned, bridging the gap between alternative asset managers and
traditional asset managers.
• Higher contribution to earnings from management fees than
alternative asset managers, yet more attractive fee rates relative to
traditional asset managers:
• With 84% of its earnings generated by management fees, we would
expect the firm's earnings to be less volatile than that of its
alternative asset management peers.
• We estimate ARES' management fee rate to be around 94 basis
points. While this is in line with most of its alternative asset
management peers, it exceeds that of its closest traditional asset
management peer by 18 basis points and that of the average
traditional asset manager by about 45 basis points.
• We expect ARES' assets under management to continue to grow at
a strong rate: Over the past five years, ARES has been growing its
assets under management at a compound annual growth rate (CAGR)
of 24.2%. This would compare to a CAGR of 10.5% for the traditional
asset managers. Assuming that AUM growth drops by 50% over the next
5 years, assets would still be growing at a faster rate than that of the
traditional asset management sector. However, given increased demand
for alternative strategies, we would argue that a decline in growth would
be significantly less.
• ARES enjoys a "sticky" and diversified capital base: About 58% of the
company's assets under management have a contractual lock-up period
of seven years or more. About 15% of assets under management is
permanent capital. This is important as the firm derives a majority of its
revenues from management fees.
• Direct lending, one of the company's strongest businesses, could
experience accelerated growth: We believe that the disintermediation
in Europe could provide Ares with an unprecedented opportunity to
grow its direct lending franchise. We expect demand for funding by
small and medium sized firms to provide ample opportunity for growth.
Priced as of prior trading day's market close, EST (unless otherwise noted).
For Required Conflicts Disclosures, see Page 52.
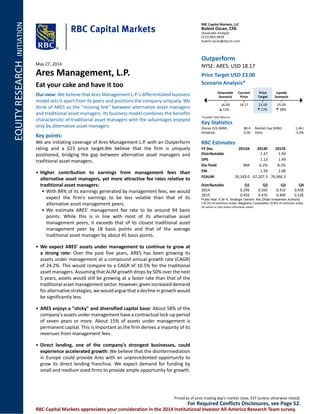
2. Target/Upside/Downside Scenarios
Exhibit 1: Ares Management, L.P.
8m
6m
4m
2m
5 12 19
M14
26
UPSIDE 25.00
TARGET 23.00
CURRENT 18.17
DOWNSIDE 16.00
May 2015
25
24
23
22
21
20
19
18
17
16
17 Days 02MAY14 - 26MAY14
ARES Rel. S&P 500 COMPOSITE MA 40 weeks
Source: Bloomberg and RBC Capital Markets estimates for Upside/Downside/Target
Target price/ base case
We arrive at our $23 price target using a price-to-earnings
multiple of 18.0x on next-twelve months (NTM) estimated fee-
based earnings of $0.87 per common unit. Moreover, we value
incentive income based on a price-to-earnings multiple of 9.0x
and NTM incentive income EPS of $0.76.
Our assumptions: Yield on incentive eligible assets of 4%
in Tradable Credit; multiple of invested capital of 1.5x in
private equity; yield on incentive eligible assets of 6% in Direct
Lending; yield on incentive eligible assets of 4% in Real Estate.
Upside scenario
Our upside scenario results in $0.87 in management fee
earnings per share and $0.90 in incentive income earnings per
share. We are applying a P/E multiple of 19x to management
fee earnings and 9.5x to incentive income earnings to arrive at
our $25 upside valuation.
Our assumptions: Yield on incentive eligible assets of 4.8% in
Tradable Credit; multiple of invested capital of 1.8x in private
equity; yield on incentive eligible assets of 7.2% in Direct
Lending; yield on incentive eligible assets of 4.8% in Real
Estate.
Downside scenario
Our downside scenario results in $0.87 in management fee
earnings per share and $0.49 in incentive income earnings per
share. We are applying a P/E multiple of 14x to management
fee earnings and 7x to incentive income earnings to arrive at
our $16 downside valuation.
Our assumptions: Yield on incentive eligible assets of 2.4% in
Tradable Credit; multiple of invested capital of 0.9x in private
equity; yield on incentive eligible assets of 3.6% in Direct
Lending; yield on incentive eligible assets of 2.4% in Real
Estate.
Investment summary
We think of ARES as the "missing link" between alternative
asset managers and traditional asset managers. We see upside
for the shares:
• Ares Management combines the best of two worlds: Large
contribution to earnings from management fees should
lead to steadier earnings emergence relative to other
alternative asset managers, more in line with traditional
asset managers. At the same time, effective fee rates are
twice that of the average traditional asset managers.
• With 84% of its earnings generated by management fees,
we would expect the firm's earnings to be less volatile than
that of its alternative asset management peers.
• We estimate ARES' management fee rate to be around 94
basis points. While this is in line with most of its alternative
asset management peers, it exceeds that of its closest
traditional asset management peer by 18 basis points and
that of the average traditional asset manager by about 45
basis points.
• ARES enjoys a "sticky" and diversified capital base: About
58% of the company's assets under management have a
contractual lock-up period of seven years or more. About
15% of assets under management is permanent capital.
• Direct lending, one of the company's strongest businesses,
could experience accelerated growth: We believe that
the disintermediation in Europe could provide Ares with
an unprecedented opportunity to grow its direct lending
franchise. We expect demand for funding by small and
medium sized firms to provide ample opportunity for
growth.
Risks:
• A decline in Ares Capital Corporation’s (ARCC) management
fees could adversely impact ARES' earnings. These make up
42% of ARES' total management fees as of 2013.
• Changes in interest rates could lead to an earnings shortfall.
The Tradable Credit Business seems most sensitive to
interest rate changes.
• Low liquidity and small float. We expect the average daily
volume to settle in the 300,000 to 400,000 range, on
average. Public float is only about 5.4%.
• Overhang due to ownership by strategic investors. While
we do not know whether Abu Dhabi Investment Authority
(ADIA) and Alleghany Corporation will sell their common
units, investors could be concerned as these entities own
22.25% of the common units.
• Poor performance by ARES’ funds and adverse capital
market & economic conditions could lead to a shortfall in
distributable earnings and impact the firm’s ability to raise
capital for future funds.
Ares Management, L.P.
May 27, 2014 Bulent Ozcan (212) 863-4818; bulent.ozcan@rbccm.com 2
3. Key questions
Our view
1. Can ARES deploy capital in private
equity given current valuations?
This is a legitimate concern, as EV/EBITDA deal multiples have been increasing since
2009. We believe that ARES will be able to deploy capital, but at a disciplined, slow
pace. Certainly, ARES is not facing the same headwinds as its publicly traded peers
that have a larger presence in the private equity sector. Its flagship fund (ACOF IV)
has about $4.7 billion of assets under management and about $0.95 billion of this
has been invested. It targets smaller deal sizes, committing equity in the $100
million to $400 million range. According to PitchBook, 4Q13 EV/EBITDA multiples for
deal sizes below $250 million have been around 6.5x, versus 9.8x for deal values
exceeding $250 million. We would expect ARES to deploy capital without lowering
its target return objectives. This means we do not expect ARES to raise a new
flagship fund until late 2016, at the earliest.
2. Given the company’s exposure to
credit, could increasing interest
rates impact the firm’s earnings?
We believe that there is a degree of interest rate sensitivity. About $19 billion of
assets under management is dedicated to long only credit strategies. These assets
include leveraged loan and high yield funds. Leveraged loans are priced off floating
rates, while high yield products tend to bear fixed interest rates.
However, we would expect potential outflows from high yield to be more than
offset by allocations to leveraged loan funds and alternative credit strategies. As
interest rates continue to rise, ARES could be a net beneficiary. This is because
higher interest rates could lead to higher earnings at Ares Capital Corporation
(ARCC), the firm’s business development company. About 42% of management fee
revenues are derived from ARCC.
3. ADIA and Alleghany are key
stakeholders owning over 22% of
common units. Could this be
viewed as an overhang?
We would expect Alleghany Corporation to continue to hold its investment in ARES
as the relationship is strategic in nature. As for the Abu Dhabi Investment Authority
(ADIA), we see the risk that it could sell down its holdings as ARES’ share prices
appreciates. We would characterize ADIA as a financial investor that could look for
other opportunities once it has achieved a targeted return on its investment in
ARES.
4. Could ARES’ shares become less
attractive if Congress changes tax
treatment of carried interest?
While carried interest has been an issue since 2007, it seems more likely that
Congress could move forward and change the tax treatment of carried interest. The
Senate Finance Committee released its eighth tax reform discussion paper on June
6, 2013, focusing on tax treatment of carried interest. The committee stated that tax
code reforms are needed to reduce or eliminate differences in overall tax burdens
across different types of entities, owners, and income. Higher taxes could lead to
lower payouts and dividend yields. However, any change in the tax law would come
with a multi-year transition period that would allow the firm to optimize its
corporate structure. Changing the corporate structure and reorganizing as a
corporation could increase institutional demand for ARES’ shares, potentially
offsetting the negative impact associated with higher taxes.
Ares Management, L.P.
May 27, 2014 Bulent Ozcan (212) 863-4818; bulent.ozcan@rbccm.com 3
4. Table of contents
Quick background on Ares Management, L.P. ......................................................................4
Investment thesis – Key positives.........................................................................................6
Highest contribution to earnings from management fees compared to peers should lead
to steady earnings emergence................................................................................................... 6
While a large portion of earnings are derived from recurring management fees,
resembling traditional asset managers, ARES’ effective fee rate is more attractive than
those of traditional asset managers........................................................................................... 7
Strong AUM growth ................................................................................................................... 8
Sticky and diversified capital base ............................................................................................. 9
Direct lending business could benefit from middle-market demand ...................................... 11
One of the youngest investment teams................................................................................... 12
Investment thesis – Key negatives...................................................................................... 14
ARES will not likely benefit from the current realization cycle given its low exposure to
private equity........................................................................................................................... 14
Private equity has not deployed large sums of capital ............................................................ 15
ARES does not have the same global footprint as some of its peers ....................................... 17
Having investment teams with deep knowledge about the market can help in finding
idiosyncratic investment opportunities. .................................................................................. 18
Interest rate sensitivity could be an issue in the short-term, when interest rates start
increasing – but the company could benefit from higher rates over the long-term ............... 19
Liquidity and float expected to be among the lowest in the alternative asset
management sector ................................................................................................................. 21
Overhang due to ownership by strategic investors ................................................................. 22
Potential tax rate changes could lower distributable earnings................................................ 23
Requirement to file K-1 is holding back investors.................................................................... 23
Analyzing companies within the sector is difficult given inconsistent accounting &
utilization of non-GAAP measures across the sector and the difficulty of projecting
realizations............................................................................................................................... 24
Valuation framework ......................................................................................................... 26
Risks and price target impediments ................................................................................... 27
Company description ......................................................................................................... 28
Milestones................................................................................................................................ 29
Business segments ................................................................................................................... 30
ARES publicly traded funds ...................................................................................................... 41
Management team............................................................................................................. 49
Ares Management, L.P.
May 27, 2014 Bulent Ozcan (212) 863-4818; bulent.ozcan@rbccm.com 4
5. Quick background on Ares Management, L.P.
Founded in 1997, Ares Management, L.P. (ARES) focuses mainly on alternative credit-based
strategies, which include direct lending, tradable credit, and real estate activities. The
company also operates a private equity franchise. Based out of Los Angeles, ARES has more
than 15 offices in the United States, Europe and Asia. ARES provides its services to sovereign
wealth funds, endowments, foundations, government and private pension funds, investment
companies, family offices, banks, insurance companies, private corporations and a limited
number of high net-worth clients. The company manages separate client-focused fixed
income portfolios and mutual funds. ARES provides a wide array of investment strategies,
serving over 500 institutional clients directly and utilizing its publicly traded and sub-advised
funds to offer its products to a retail investor base. As of December 31, 2013, ARES had
around 700 employees including approximately 315 investment professionals, 280
operations management professionals and with the balance in administrative support. ARES’
AUM stood at US$74 billion as of December 31, 2013.
Exhibit 2: Overview of Ares Management, L.P.
Source: Company reports
On May 1, 2013, the company announced that it had completed its initial public offering of
11,363,636 common units at a public offering price of $19. The following day, common units
started trading on the New York Stock Exchange under the ticker symbol “ARES”.
Underwriters have a 30 day option to purchase an additional 1.7 million shares.
Tradable Credit Direct Lending Private Equity Real Estate
A leading participant in the
tradable, non-investment
grade corporate credit markets
One of the largest self-
originating direct lenders to
the US and European middle
markets
One of the most consistent
performing PE managers in the
US with a growing
international presence
One of the largest real estate
private equity fund managers
and a growing direct lender
Assets Under Management $28 billion $27 billion $10 billion $9 billion
Long-only credit US direct lending US/European flexible capital Real estate debt
Alternative credit European direct lending China growth capital Real estate equity
Local Market Presence US & Europe US & Europe US, Europe & China US & Europe
Investment Funds 75+ active funds 25+ active funds 5 active funds 35+ active funds
Investment Personnel ~60 professionals ~125 professionals ~45 professionals ~80 professionals
Current Portfolio 600+ companies 400+ companies 25+ companies ~300 properties
15+ year investment track
records in both bank loans and
high yield bonds
Fund offering includes the
largest business development
company (Nasdaq: ARCC)
Aggregate gross IRR of 24% on
$7 billion invested since 2003
15+ year investment track
records in US and European
real estate private equity
Top quartile rankings in several
funds across long-only and
alternative credit strategies
ARCC generated a 14%
annualized total return for its
shareholders since 2004
Top quartile rankings in 2006
and 2008 funds
In 2013, PERE ranked AREA as a
top 15 real estate manager
based on equity raised from
January 2008 to April 2013
Proprietary research on over
1,000 companies in over 30
industries
Euro team named 2010, 2011
and 2012 Specialist Lender of
the Year
Preqin voted 2008 vintage fund
a Top 10 Best Performing
Buyout Fund among 2006 -
2010 vintages
Approved as a Fannie Mae
Delegated Underwriting and
Servicing Lender
Investment Strategies
Selected Distinctions
Ares Management, L.P.
May 27, 2014 Bulent Ozcan (212) 863-4818; bulent.ozcan@rbccm.com 5
6. Investment thesis – Key positives
Highest contribution to earnings from management fees
compared to peers should lead to steady earnings emergence
One of the challenges investors and analysts following the alternative asset management
sector are facing is the difficulty forecasting earnings and dividend distributions.
Distributable earnings can move around significantly, depending on the source of earnings.
While management fee revenues provide a good source of distributable earnings for ARES’
peers, net performance fees tend to contribute a sizeable amount to total revenues and
ultimately to earnings. Alternative asset managers tend to distinguish their dividends by the
source of earnings. The term “base dividends” is used to describe dividends that can be paid
out of earnings generated from management fees, i.e., from a stable source of earnings.
These are viewed as a minimum a company can pay out. These are then paired with top up
dividends, i.e., dividends that are a function of performance fees and usually determined in
the final quarter of the fiscal year. Performance fee related earnings tend to move around
significantly.
Exhibit 3 below depicts the relationship between management fees revenue and net
performance fees. Clearly, ARES stands out as having the highest contribution of
management fee revenues to the sum of management fee revenues and net performance
fees.
Exhibit 3: A large portion of ARES revenue is from management fees
84%
69%
56% 52% 47% 47%
36%
16%
31%
44% 48% 53% 53%
64%
ARES FIG OAK BX KKR CG APO
Management Fees Performance Fees
Source: Company reports; RBC Capital Markets
The implications are important. We believe that this could reduce future earnings volatility
and provide investors with more certainty around dividend payments. Put differently, we
would describe the variable component of earnings to be the least important contributor to
ARES’ earnings. This could command a higher multiple on distributable earnings as the risk of
an earnings shortfall could be the lowest relative to its alternative asset management peers.
We believe that the lower earnings volatility should appeal to investors who have avoided
this sector due to uncertainty around dividend distributions.
Ares Management, L.P.
May 27, 2014 Bulent Ozcan (212) 863-4818; bulent.ozcan@rbccm.com 6
7. While a large portion of earnings are derived from recurring
management fees, resembling traditional asset managers, ARES’
effective fee rate is more attractive than those of traditional
asset managers
One of the appeals of ARES is that while earnings volatility could be lower than that of its
alternative asset management peers, more in line with traditional asset managers, the
effective fee rates generated are significantly higher than those of any traditional asset
managers under our coverage. Exhibit 4 below depicts this.
Exhibit 4: ARES’ management fee rate exceeds that of traditional asset managers by a wide
margin
0.94%
1.08%
0.96%0.95%0.94%
0.80%
0.69%
0.76%
0.63%
0.58%
0.51%0.48%
0.44%
0.35%
0.22%
0.15%
0.1%
0.3%
0.5%
0.7%
0.9%
1.1%
1.3%
ARES
OAK
KKR
BX
FIG
CG
APO
APAM
BEN
WDR
IVZ
TROW
EV
LM
BLK
FII
Management Fee-Rates
Source: Company reports; RBC Capital Markets
We view this as an important point. While fee rates seem to have come under pressure for
some alternative asset managers, as institutional clients negotiate for better terms in
exchange for larger allocations, fee rates have not declined to the same degree as for
traditional asset managers. This makes sense. We believe clients are still willing to pay for
good performance and won’t switch to a second tier provider to save a few basis points on
management fees.
As demand for passive strategies among retail and institutional clients increased, the need to
reduce fees became necessary in order to attract capital from investors. After all, most
traditional asset managers have not been able to beat their benchmark after considering
fund expenses. Thus, investors are increasingly reluctant to pay high fees for active
management. Exhibit 5 below shows the percentage of funds outperforming their
benchmark.
Exhibit 5: Only in 2005 and 2009 did a majority of active managers beat their benchmark
2001 2002 2003 2004 2005 2006 2007 2008 2009 2010 2011 2012 2013
# of funds beating benchmark 1449 1518 1404 1572 2022 1363 2040 1838 2917 2332 1720 2736 2457
# of funds with data 2933 3089 3253 3434 3637 3921 4234 4523 4811 5031 5354 5731 5800
% of funds beating benchmark 49.4% 49.1% 43.2% 45.8% 55.6% 34.8% 48.2% 40.6% 60.6% 46.4% 32.1% 47.7% 42.4%
Source: Morningstar; RBC Capital Markets
Ares Management, L.P.
May 27, 2014 Bulent Ozcan (212) 863-4818; bulent.ozcan@rbccm.com 7
8. This trend seems to be continuing. As follows, Exhibit 6 shows more recent data and depicts
once more the percentage of funds beating their benchmark after management,
administrative and 12b-1 fees over the past 12 months.
Exhibit 6: Looking at more recent data, we are not seeing a meaningful improvement
Mar-13 Apr-13 May-13 Jun-13 Jul-13 Aug-13 Sep-13 Oct-13 Nov-13 Dec-13 Jan-14 Feb-14 Mar-14
# of funds beating benchmark 2348 2236 2379 2481 2572 2433 2590 2460 2467 2498 2430 2504 2432
# of funds with data 5699 5713 5723 5733 5737 5754 5768 5777 5784 5807 5810 5813 5816
% of funds beating benchmark 41.2% 39.1% 41.6% 43.3% 44.8% 42.3% 44.9% 42.6% 42.7% 43.0% 41.8% 43.1% 41.8%
Source: Morningstar; RBC Capital Markets
While it is not an easy undertaking to determine whether alternative asset managers do
indeed generate alpha, alternative products seem to meet an increasing demand for
absolute return. Allocations to alternative asset managers have increased. At the same time,
passive strategies pose little risk to alternative asset managers. Thus, we would expect fee
rates not only to continue to exceed those of traditional asset managers, but the discrepancy
in effective fee rates between traditional asset managers and alternative asset managers to
expand.
Thus, the alternative asset management business model seems to be more isolated from fee
pressure. ARES could provide an appealing opportunity to gain exposure to the space,
especially for investors who had avoided the alternative asset management companies due
to the aforementioned earnings volatility.
Strong AUM growth
Similar to other alternative asset managers, ARES has grown its assets under management at
a considerable pace since it was founded in 1997. We believe that the firm could continue to
expand its asset base at a considerable pace over the coming year.
Over the past decade, management has grown assets under management at a compound
annual growth rate (CAGR) of 30.9%. Certainly, one could argue that this is an easy
comparison as the asset base, at $5 billion, was very low to begin with. Nonetheless, the
growth generated remains impressive even over a more recent period. Were we to analyze
growth over the past five years, we would still arrive at a CAGR of 24.2%. We believe that
ARES as well as its peers have benefited from increased demand for alternative asset
strategies – and we would expect this trend to continue.
We would position ARES as the missing link between traditional asset managers and
alternative asset managers. Think of Ares Management, L.P. as a money manager that
pursues alternative strategies, yet has an earnings pattern that resembles that of a
traditional asset management company.
Exhibit 7 below shows the annual growth rate in AUM for ARES and the assets under
management of US domiciled mutual funds, closed end funds, exchange traded funds, and
unit investment trust.
Ares Management, L.P.
May 27, 2014 Bulent Ozcan (212) 863-4818; bulent.ozcan@rbccm.com 8
9. Exhibit 7: Since 2003, annual AUM growth at ARES has significantly exceeded that of
traditional asset managers
-30%
-20%
-10%
0%
10%
20%
30%
40%
50%
60%
2004 2005 2006 2007 2008 2009 2010 2011 2012 2013
ARES -CAGR (30.9%) US Traditional AM-CAGR (8.1%)
Source: Company reports; Investment Company Institute; RBC Capital Markets
While ARES grew its assets under management at a CAGR of 30.9% over the past decade, US
domiciled funds generated a CAGR of 8.1% during the same period. More importantly, assets
under management have grown every year since 2003.
As mentioned, the growth rate over the past five years has been slower than over the 10-
year period. Nonetheless, even assuming that ARES would be able to grow its AUM at half
the pace it has more recently, it could still generate an annual growth rate of over 12%. One
could even argue that going public could accelerate ARES’ growth rate due to brand
recognition. Institutional investors could also allocate more capital to ARES as complying
with strict SEC guidelines on internal control could provide these investors with additional
assurance.
Sticky and diversified capital base
Most alternative asset managers are in a fortunate position in that they do not have to worry
about losing assets and having to replenish these assets on a daily basis, but can manage
their business taking a longer-term perspective. Ares Management, L.P. is no exception to
this.
As of December 31, 2013, most of ARES’ funds have a contractual lock up period of seven
years or more. We view this as important as 84% of top line is derived from management fee
revenues. This means that there is more certainty around the sustainability of distributable
earnings and dividends.
Exhibit 8 below provides a break down of total assets under management by duration.
Ares Management, L.P.
May 27, 2014 Bulent Ozcan (212) 863-4818; bulent.ozcan@rbccm.com 9
10. Exhibit 8: Almost 58% of AUM have contractual lock-up periods of seven or more years
-
58%
15%
14%
29%
22%
5%
15%
42%
0%
20%
40%
60%
80%
100%
120%
Permanent
capital
10 years or
more
7 to 9 years 3 to 6 years Fewer than 3
years
Managed
accounts
Total
Source: Company reports; RBC Capital Markets
However, we would point out that the percentage of longer duration assets could increase as
ARES raises new funds. Assuming all funds were raised today, 56% of the new capital would
have a contractual lock-up period of 10 years or more and 11% of would have a contractual
lock-up period of 7 to 9 years. This would be on top of the 15% of assets under management
currently being deployed in permanent capital vehicles. Thus, about 82 percent of the capital
raised would be invested in with a duration of 7+ years under this scenario.
As for the limited partners (LPs), ie, investors allocating capital to ARES’ funds, we would
point out that there does not seem to be a concentration risk. According to management, no
single investor accounts for more than 4% of assets under management. The top 10 LPs
account for 19% of total assets under management.
About 52% of the $74 billion in assets under management was raised relying on over 500
direct institutional relationships. Pension funds represent the largest percentage of this,
making up 19% of total assets under management. ARES is currently working with
approximately 130 pension funds. Putting it differently, the average pension fund has about
$110 million of capital allocated to ARES’ funds.
ARES’ publicly traded entities contribute 31% to total assets under management. The
investor base seems diverse, as well. The publicly traded investment vehicles, including Ares
Capital Corporation (ARCC), Ares Commercial Real Estate Corporation (ACRE), Ares Dynamic
Credit Allocation Fund (ARDC), and Ares Multi-Strategy Credit Fund Inc. (ARMF), have over
350 institutional investors and over 200,000 retail investors as their investor base.
Ares Management, L.P.
May 27, 2014 Bulent Ozcan (212) 863-4818; bulent.ozcan@rbccm.com 10
11. Exhibit 9: ARES’ investor base seems diversified, with little concentration risk
Assets under management by channel Direct Institutional investor base
37%
19%
17%
8% 8%
5%
3% 3%
0%
5%
10%
15%
20%
25%
30%
35%
40%
Pension
Sovereign
WealthFund
Bank
Investment
Manager
Insurance
Other
Ares
Endowment/F
oundation
Source: Company reports; RBC Capital Markets
Direct lending business could benefit from middle-market
demand
One of the investment themes that we have been frequently hearing about in the alternative
asset management sector is that banks in Europe could sell distressed assets, providing
private equity investors with an opportunity to deploy large sums of capital. We have not
seen this happen so far, despite tighter regulatory regimes in Europe. Our view is that even if
some of the assets were to come to market, the opportunity might not be that attractive, as
the industry is continuing to sit on a record amount of dry powder. We would expect fierce
bidding for the assets. On top of that, there is increased competition by strategic buyers for
these assets. The bottom line is that deploying capital could be less attractive if the assets
were purchased in a competitive auction process.
However, there are very attractive opportunities to be captured as banks are retreating and
obtaining loans is a more difficult endeavor for small- and mid-sized firms. Instead of buying
assets, private equity firms could fill the void by offering services that were previously
provided by banks. The tightening of regulations and the resulting withdrawal of banks from
certain sectors or at least a reduction in lending activity could lead to a supply/demand
imbalance in credit. We believe that ARES could capitalize on this opportunity with its direct
lending business.
Small- to medium-sized companies have historically relied on their banks to provide capital
and financing. One of the consequences of Basel III and Dodd-Frank regulation has been that
banks find it increasingly expensive to extend financing due to higher capital charges. While
large companies can access capital markets by issuing debt and equity to obtain capital, small
and medium sized firms cannot do so. This is creating an imbalance between companies
seeking financing and banks willing to provide capital. Banks are less likely to extend loans as
the capital charges have increased.
Direct lending in Europe is somewhat new and an area of growth, unlike in the US. According
to Deloitte, most of the European non-bank financing deals were closed in the UK, followed
by France and Germany. We would expect this trend to accelerate and alternative lenders to
Direct Institutional
52%
Public Entities
31%
Intermediary
17%
Ares Management, L.P.
May 27, 2014 Bulent Ozcan (212) 863-4818; bulent.ozcan@rbccm.com 11
12. become a vital source of capital and financing. Likewise, South Europe could become more
attractive to alternative lenders as the economy starts to recover.
An interesting statistic provided by Deloitte shows that 34% of the deals that closed in Q4/13
was related to leveraged buy-out and only 29% related to refinancing. We would expect
refinancing transactions to increase as banks retreat and mergers and acquisitions volume
increases.
Exhibit 10: Deloitte is seeing an increase in closed direct lending transactions (number of
deals completed)
23
18
31
35
56
0
10
20
30
40
50
60
4Q12 1Q13 2Q13 3Q13 4Q13
Source: Deloitte; RBC Capital Markets
Exhibit 10 above is based on Deloitte’s alternative lender deal tracker data and shows that
the transactions with alternative lenders more than doubled since Q4/12.
ARES conducts corporate lending and asset management activities across Europe through
Ares Management Limited. The business was launched in 2007 to directly originate middle-
market credit in Western Europe. As of December 31, 2013, ARES had 29 investment
professionals managing about $5.5 billion of total assets under management. Management
disclosed that about €200 billion of un-invested private equity capital was seeking financing
in Europe. Thus, as private equity firms start deploying capital, they will need to find a source
of financing to lever-up the portfolio companies. This could provide ARES with an
opportunity to put capital to work. Furthermore, we would expect demand for credit to
increase as the economy in Europe continues to recover. Small to medium sized businesses
need to invest in growth. This could benefit ARES’ direct lending business.
One of the youngest investment teams
A topic that frequently comes up when we talk to investors is succession planning. While the
key person risk seems to be an issue in many industries, we believe that it is a particularly
important topic in the alternative asset management space. These leaders are deemed to be
one of the main reasons why limited partners entrust money managers their capital. They
are thought to play a major role in capital raising and capital deployment. While the reality
might deviate from this perception, investors in the common shares perceive this to be true
and invest accordingly. The good news for ARES is that this issue should be less prevalent
than for some of its peers, as they have one of the youngest management teams in the
sector.
Ares Management, L.P.
May 27, 2014 Bulent Ozcan (212) 863-4818; bulent.ozcan@rbccm.com 12
13. Exhibit 11: Succession planning does not seem to be immediate concern
51 yrs 52 yrs
56 yrs
65 yrs 65 yrs
70 yrs
0
10
20
30
40
50
60
70
80
FIG ARES APO BX CG KKR
Age
Source: Company reports; RBC Capital Markets
ARES’ management team’s average age is 52 years, slightly above that of Fortress Investment
Group and well ahead of that of its peers. Certainly, any of the individuals running
Blackstone, Carlyle or KKR & Co. could be on the job for another decade. They most likely
have the energy, focus, and vision to continue doing their job at the highest level for years to
come. However, despite this, key person risk remains an important concern on investors’
minds and can affect stock performance. Consequently, we believe that succession planning
should not be an issue at ARES for years to come.
Ares Management, L.P.
May 27, 2014 Bulent Ozcan (212) 863-4818; bulent.ozcan@rbccm.com 13
14. Investment thesis – Key negatives
ARES will likely not benefit from the current realization cycle
given its low exposure to private equity
As we had mentioned earlier, a large portion of revenues at ARES are generated by
management fees. In contrast, net performance fees comprised only 16% of the revenues &
net performance fees in 2013 – the lowest among its peers. While this provides significant
downside protection, it also limits earnings growth in an improving economy.
Alternative asset managers have capitalized on the current market environment and are in
the process of selling down assets, thus, generating performance fees for holders of the
common units. We believe that investors in ARES’ common shares will not be in a position to
benefit from this “harvesting cycle/realization cycle” to the same degree as investors who
own shares of its peers. As Exhibit 12 shows, ARES’ peers have a larger presence in private
equity.
Exhibit 12: Just about 12% of fee generating AUM is invested in private equity at ARES
12%
22% 27% 31%
37%
53%
88%
78% 73% 69%
63%
47%
0%
20%
40%
60%
80%
100%
120%
ARES BX APO CG FIG KKR
Private Equity AUM Other AUM
Source: Company reports; RBC Capital Markets
As for ARES’ private equity investments, we believe that these investments are not as far
along the realization cycle relative to its peers. Exhibit 13 below depicts the percentage of
private equity investments valued using market or broker quotes. In a sense, it serves as a
proxy for the maturity of private equity portfolios.
Ares Management, L.P.
May 27, 2014 Bulent Ozcan (212) 863-4818; bulent.ozcan@rbccm.com 14
15. Exhibit 13: About 11% of private equity assets are valued based on public or broker quotes
11%
21%
35%
39%
42%
56%
0%
10%
20%
30%
40%
50%
60%
ARES KKR CG FIG BX APO
Source: Company reports; RBC Capital Markets
As shown in Exhibit 13 above, only about 11% of ARES’ private equity investments are valued
using broker or public quotes. This means that the firm would have to either find a strategic
buyer to sell the assets to or enlist the portfolio companies on an exchange before it could
start selling shares. This is a lengthy process. We believe that other alternative asset
managers such as Apollo Global Management and Blackstone are ahead on the realization
cycle, as they have a larger portion of assets that is readily available for sale.
Interestingly, ARES’ largest private equity fund by invested capital, ACOF III, has deployed
about $3.7 billion of capital and it has generated realizations of around $3.5 billion. Yet,
unrealized investments in ACOF III remain around $3.2 billion. We believe that the 11%
“public marks” mentioned above are mainly the result of ACOF III not having floated its
portfolio companies, yet.
Consequently, we would expect private equity realizations to take place at a gradual rate.
Furthermore, realizations would not have the same impact on distributable earnings
compared to peers given that private equity assets represent a small portion of total assets
under management. Therefore, investors trying to capitalize on the current harvesting cycle
could be better off investing in firms that have floated a large portion of their portfolio
companies and are selling down assets opportunistically.
Private equity has not deployed large sums of capital
We would describe ARES as a strong private equity investor. Indeed, similar to Apollo Global
Management, the company has its roots in credit investing. The credit perspective, in our
view, has led to an investment philosophy at ARES that focuses on the downside risk just as
much as on the opportunity set.
Exhibit 14 below shows the asset weighted net internal rate of returns as of December 31,
2013, for the various publicly traded alternative asset managers.
Ares Management, L.P.
May 27, 2014 Bulent Ozcan (212) 863-4818; bulent.ozcan@rbccm.com 15
16. Exhibit 14: ARES’ private equity funds have been performing well, especially ACOF III
26%
20%
18% 19%
15%
5%
0%
5%
10%
15%
20%
25%
30%
Apollo Global
Management
Ares
Management
Carlyle Group KKR & Co Blackstone Group Fortress
Investment Group
Source: Company reports; RBC Capital Markets
However, we believe that the amount of capital deployed could remain low over the coming
quarters and the firm might not see the need to raise a new flagship private equity fund until
2016 – or later.
Exhibit 15 below shows that ACOF IV, a 2012 fund, has deployed merely $945 million of
capital as of the end of the year.
Exhibit 15: ACOF IV has deployed only about 20% of committed capital
PE Fund
($ in MM) Vintage Maturity Fund Size
Inception to
Date Capital
Invested
Inception to
Date
Distributions
Net Asset
Value
MOIC
Estimate
Unrealized
Investments Gross IRR Net IRR
ACOF I 2003 In Liquidation $751 $847 $1,384 $1,501 3.4x $116 21.0% 14.0%
ACOF II 2006 Harvesting 2,100 2,069.0 3,244 4,153 3.6x 909 20.0% 15.0%
ACOF III 2008 Harvesting 3,500 3,715.0 3,468 6,627 2.7x 3,159 34.0% 25.0%
ACOF IV 2012 Investing 4,700 945.0 - 984 1.0x 984 n/a n/a
ACOF Asia 2011 Investing 220 170.0 10 207 1.3x 196 n/a n/a
Total 11,271$ $7,746 $8,106 $13,472 2.8x $5,364 28.0% 20.5%
Source: Company reports; RBC Capital Markets
While we like the company’s disciplined approach to investing, we would point out that the
firm could be having a difficult time sourcing deals that fit its return objective. One could
certainly infer this based on the capital deployed in ACOF IV over the past two years. We
believe that the size of ARES’ next fund will be determined by the opportunity set. We would
not expect ARES to increase the size of its next fund significantly, unless we go through a new
economic crisis that leads to new opportunities to invest capital. However, we believe that
the opportunity set to deploy capital could grow as ARES expands its global footprint.
However, this could take some time.
Ares Management, L.P.
May 27, 2014 Bulent Ozcan (212) 863-4818; bulent.ozcan@rbccm.com 16
17. ARES does not have the same global footprint as some of its
peers
We believe that having a global footprint provides distinct advantages. Having a presence in
multiple countries could provide an edge in raising and deploying capital. Limited partners
prefer relationships with general partners that have a permanent presence in their home
market. Furthermore, while alternative asset strategies make an increasing percentage of
assets in US portfolios, there is a large growth opportunity outside of the US.
Exhibit 16 below shows the expected allocation to various alternative asset classes and is
based on a survey conducted by McKinsey in 2013 titled “The Mainstreaming of Alternative
Investments”. We believe that the results would have been similar if the survey was
conducted today. As the authors point out, growth in alternative asset classes is expected to
be broad and strong. However, there are three items we would like to point out. First,
allocations to alternative asset classes are higher in North America, and we would expect
European investors to increase their allocation to alternative asset managers. Second,
allocation in real estate is expected to increase the most in Europe. Third, this survey does
not include Asia, a rapidly growing market. A report published by Julius Baer, a wealth
manager, predicted that the high-net-worth population (cash and assets over $1 million) will
more than double in Asia, up from 1.16 million in 2010 to 2.67 million by 2015.
Exhibit 16: If the US is an indication, European investors could increase allocation to
alternative asset classes
Real EstateHedge FundsPrivate Equity
0.0%
2.0%
4.0%
6.0%
8.0%
10.0%
12.0%
2009 2010 2013E 2009 2010 2013E 2009 2010 2013E
North America European Union
Source: McKinsey & Company; RBC Capital Markets
Having a broad global presence allows the firm to identify attractive investment
opportunities by utilizing expertise about the local market. One could raise the question of
whether this is indeed true, given ARES’ strong private equity fund performance despite the
lack of a global footprint. We would argue that while ARES has generated excellent returns
investing mostly in the US, we believe that this was due to a few factors. First, ARES’ most
successful fund is a 2008 vintage. ARES Management LP, with its strength in credit, was able
to deploy capital in a profitable fashion. Note that its 2003 and 2006 funds have not enjoyed
the same level of success as ACOF III. Secondly, ARES’ flagship private equity funds are
smaller than those of its publicly traded peers. The ACOF IV fund has $4.7 billion of
commitments. As a comparison, Apollo Global Management raised over $17 billion from
third parties for its new flagship fund. Having a smaller fund can provide an advantage as one
can pursue smaller targets which tend to be available at lower entry multiples.
Ares Management, L.P.
May 27, 2014 Bulent Ozcan (212) 863-4818; bulent.ozcan@rbccm.com 17
18. Third, private equity investors with a credit-oriented investment philosophy seem to have
benefited to a larger degree from the recent financial crisis.
However, we believe that having a broad network to source deals across multiple regions will
become more important as entry multiples remain high in the US. We can see the challenges
of finding attractive opportunities with the firm’s fourth fund, ACOF IV, which has deployed
less than $1 billion since it was raised in 2012. Exhibit 17 below shows that ARES has the
least number of international offices.
Exhibit 17: ARES has only nine offices outside of the US
Ares
Management
L.P.
Apollo Global
Management
Blackstone
Group
Carlyle
Group
KKR & Co Fortress
Investment
Group
a a a a a a
x x x a a x
x x x a x x
x x x a x x
a x x x x x
a a a a a a
a x a a a x
x x x a x x
x x a x x x
a a a x x a
x x x a x x
a x x x x x
x x a x a x
x a x a x x
x x x x x a
x x x a x x
x x a a x x
x x a a a x
x a a a a x
x a a a a a
a a a a a a
x x a a a x
a x x a x x
a x a a x a
x x a a a x
x x a a a a
a x a a x a
x x x a x x
x x x a x x
310 277 840 700 265 276
x No
a Yes
Various cities, USA
Sao Paulo, BR
Lima, PE
Barcelona, ES
Frankfurt, DE
Munich, DE
Dublin, IE
Luxembourg, LU
London, UK
Paris, France
Amsterdam,NL
Dusseldorf, DE
Tokyo, JP
Mumbai, IN
Singapore, SG
Hong Kong, HK
Beijing, CN
Rome, IT
Milan, IT
Istanbul, TR
Dubai, AE
Madrid, ES
Stockholm, SE
Legend
Sydney, AU
Johannesburg, ZA
Lagos, NG
Investment Professionals
Chengdu, CN
Shanghai, CN
Seoul, KR
Source: Company reports; RBC Capital Markets
Having investment teams with deep knowledge about the market can help in finding
idiosyncratic investment opportunities.
Ares Management, L.P.
May 27, 2014 Bulent Ozcan (212) 863-4818; bulent.ozcan@rbccm.com 18
19. Interest rate sensitivity could be an issue in the short-term,
when interest rates start increasing – but the company could
benefit from higher rates over the long-term
Some investors might be concerned regarding the interest rate sensitivity of Ares
Management L.P. This would appear to make sense as 87% of assets under management are
either in tradable credit, direct lending or real estate. Based on the asset mix, an investor
might conclude that Ares Management L.P’s shares could be negatively impacted as interest
rates rise.
Exhibit 18: About 87% of assets could appear to be interest rate sensitive
Tradable Credit
38%
Direct Lending
36%
Private Equity
14%
Real Estate
12%
Source: Company reports; RBC Capital Markets
The impact of changes in interest rates would be most noticeable in the Tradable Credit
Group. This business comprises $28 billion of assets under management and includes long-
only strategies such as leveraged loans and high yield, as well as alternative strategies such
as multi-strategy credit and special situations. The disclosure provided in the S-1 filing shows
that the impact of a 10% decrease in total remaining fair value of the funds’ investments
could lead to a reduction of $117 million in performance fees and a $16 million decline in
investment income. The question then becomes what could lead to a 10% decline in fair
value. The company does not provide a breakdown of the AUM in tradable credit. While
leveraged loans would be generally priced off floating rates, high yield investments would
bear fixed rates. As for alternative strategies, we would expect the pricing primarily to be
based on floating rates. Nonetheless, it is difficult to determine what could lead to a 10%
decline in the remaining fair value given current disclosures. We would need more
information on whether the investments are priced off floating rates or fixed rates. At this
point, we cannot clearly determine the interest rate sensitivity of this segment.
As for the other parts of the business, we would argue that the impact of increasing interest
rates could be manageable.
ARES operates one of the largest business development companies, which tends to borrow
short-term and invest long-term - up to 10 years. This could negatively impact earnings due
to spread compression, but we would expect the spread compression to be manageable.
Ares Capital Corporation (ARCC) is ARES’ business development company. For managing the
assets, ARES receives performance fees on top of management fees. ARES calls the
performance fees out of Ares Capital Corporation “ARCC Part I fees” and characterizes them
Ares Management, L.P.
May 27, 2014 Bulent Ozcan (212) 863-4818; bulent.ozcan@rbccm.com 19
20. as management fees due to the recurring nature of these fees. These fees are meaningful
and contributed about 21% to total management fee revenues in 2013. The ARCC Part I fees
are based on ARCC’s pre-incentive fee net operating income. ARCC disclosed in its most
recent 10Q that only $100 million of the $3 billion of debt obligations is financed through a
revolving credit facility. As for the assets, about 9% of investments at fair value bore interest
at a fixed rate. The point is that there appears to be a small mismatch between assets and
liabilities. As interest rates increase from current levels, there would be a negative impact on
ARCC’s earnings. The interest rate sensitivity provided in the 10Q shows this. If the base rate
changed by +100 bps, net income would decline by $15.1 million. However, if the base
interest rate increased further (up 200 bps), ARCC’s earnings would actually increase.
Exhibit 19: ARCC’s net income would decline initially as base rate increases
($ in million)
Interest
Income
Interest
Expense Net Income
Up 300 basis points $104.9 $3.0 $101.9
Up 200 basis points 44.6 2.0 42.6
Up 100 basis points (14.1) 1.0 (15.1)
Down 100 basis points 6.4 (0.2) 6.6
Down 200 basis points 6.4 (0.2) 6.6
Down 300 basis points 6.4 (0.2) 6.6
Source: Company reports; RBC Capital Markets
An increase in interest rates absent economic growth and strong market conditions could
negatively impact the lending business, to be sure. Thus, we would be less concerned about
an increase in interest rates if this increase is accompanied by an economic recovery.
The same is true for the real estate business. Capitalization rates are low right now. As
interest rates increase, capitalization rates could increase, as well. This could potentially
depress real estate valuations, if net operating income for the properties does not increase.
This could happen if the occupancy rate increases or if rates can be taken, i.e., rents
increased. It is difficult to assess the impact of higher rates on the investments made by the
real estate without more information. However, we would view the impact of higher interest
rates on the real estate platform as low. The company disclosed that if the fair value of its
investments dropped by 10%, performance fees could decline by $5 million and investment
income could decline by $2 million.
One could argue that interest rate sensitivity might be lower than perceived. However, it is
difficult to determine whether the concerns are overblown based on information made
available to investors.
Ares Management, L.P.
May 27, 2014 Bulent Ozcan (212) 863-4818; bulent.ozcan@rbccm.com 20
21. Liquidity and float expected to be among the lowest in the
alternative asset management sector
While we have witnessed an increase in trading volume and liquidity in the sector since we
began coverage about a year ago, it should come as no surprise that the shares of alternative
asset managers remain fairly illiquid. This is certainly impacted by the structure of the firms.
There are a large number of mutual funds that do not allow ownership of limited
partnerships. There is still a reluctance to invest in back office operations to capture
opportunities offered by the alternative asset management sector. Furhthermore, a large
portion of the companies are owned by the founding partners and company insiders. Thus,
given the low liquidity, it can take a while to build a significant ownership in an alternative
asset manager. Exhibit 20 below shows the 30-day average trading volume for various
alternative asset managers.
Exhibit 20: 30-day average volume (in millions)
6.55
3.03
2.42
1.46 1.27
0.78
0.24 0.40
0.0
2.0
4.0
6.0
8.0
BX KKR FIG OZM APO CG OAK ARES
Source: FactSet; RBC Capital Markets; average volume excludes shares traded on the day of the IPO
We estimate that average daily volume for ARES will be around 400,000 shares. We have
excluded the volume on the first day of trading for the analysis, which was around 7.7 million
on May 2, 2014.
We would expect ARES to be one of the least liquid names in the sector. There are simply not
enough shares outstanding and management retains over 70% of the ownership of the
company. We would not expect them to sell their shares in the near term, even if they could.
ARES had to reduce the offering size given the ascribed valuation. We think that
management considers the current valuation as inexpensive, which could have driven the
decision to reduce the offering size. Thus, given current volumes, it would take about 10 days
to buy 5% of the shares outstanding. In comparison, investors could buy 5% of the
outstanding shares of Blackstone in less than half that time.
Ares Management, L.P.
May 27, 2014 Bulent Ozcan (212) 863-4818; bulent.ozcan@rbccm.com 21
22. Exhibit 21: Only about 80 million of ARES shares are currently outstanding (in millions)
578.0
404.8
453.9 472.6
149.0
64.1
127.7
80.4
0.0
200.0
400.0
600.0
800.0
BX KKR FIG OZM APO CG OAK ARES
Source: FactSet; RBC Capital Markets
Consequently, investors in ARES shares should expect stock price volatility as investors build
positions or rebalance their portfolios.
Overhang due to ownership by strategic investors
There are two strategic investors in Ares Management LP – the Abu Dhabi Investment
Authority (ADIA) and Alleghany Corporation (NYSE: Y). While we view Alleghany as a long
term investor that could retain its ownership in ARES, we would expect ADIA to reduce its
exposure to ARES in the coming years.
In July 2013, Alleghany invested $250 million for a 6.25% equity ownership in ARES. In
addition, the firm committed to invest up to $1 billion of capital in various ARES investment
strategies. Alleghany provides ARES with an opportunity to expand its presence in the
insurance industry. ARES’ management indicated that it would like to enhance its
distribution channels by targeting insurance companies. We believe that this is a mutually
beneficial relationship. Alleghany has gained access to investment expertise in credit. ARES,
on the other hand, now has a partner with in-depth experience in insurance - property and
casualty and reinsurance. Thus, we would expect Alleghany to retain its ownership in ARES.
As for ADIA, we would view them as a likely seller. This sovereign wealth funds, which usually
will not make a commitment of less than $50 million, started taking minority stakes in
alternative assets managers in 2007. ADIA bought 30 million non-voting shares in Apollo
Global Management (APO) in June 2007. The investment authority sold some of its
investment in Apollo in 2013. ADIA also had equity ownership in Carlyle Group (CG), which it
exited in September 2013.
We view ADIA as a willing seller, but would expect them to retain their ownership until
valuations improve. Initially, ADIA wanted to sell its shares with Ares Management LP going
public. The initial IPO range was between $21 and $23. However, at a $19 IPO pricing, ADIA
decided against selling its shares. Should the share price move closer to the initial IPO range,
ADIA could once more become interested in monetizing its holding. As a reminder, ADIA
owns 16.3% of ARES. Depending on the exit strategy, these shares could end up as public
float. However, there is a lock up period of one year. After one year, ADIA could sell 50% of
its ownership, with the remainder becoming available for sale after the second year.
Ares Management, L.P.
May 27, 2014 Bulent Ozcan (212) 863-4818; bulent.ozcan@rbccm.com 22
23. Potential tax rate changes could lower distributable earnings
The tax treatment of carried interest has been in the spotlight for some time now. With the
need to raise tax revenues and reduce the budget deficit, we would expect this debate to
continue. This is despite the fact that as the Private Equity Growth Capital Council pointed
out, changing the tax treatment of carried interest would only pay for 3.1 hours a year in
federal government operations.
Private equity firms generate income in two ways. They receive a management fee, which is
taxed as ordinary income, and carried interest. Private equity funds receive 20% of
partnerships profit when the return exceeds a certain hurdle rate, i.e., carried interest.
Currently, carried interest qualifies to be treated as long-term capital gains.
In 2007, the Congress held hearings on this topic. The Obama Administration’s 2008 Budget
Blueprint included a sentence that carried interest should be taxed as ordinary income. In
2010, the US House of Representatives passed HR 4213, the American Jobs and Closing Tax
Loopholes Act.
While it is difficult to predict whether the tax treatment of carried interest will change and
be a part of a tax reform bill, if passed, taxing carried interest as ordinary income could have
an adverse impact on capital distributions and dividend yields as it would significantly raise
the amount of taxes owed. HR 4213 could prevent ARES from completing certain types of
internal reorganization transactions or converting to a corporation on a tax-free basis. The
proposed legislation could also increase the ordinary income portion of any gain realized
from the sale of common units.
However, there could be a multi-year transition period before capital gains can be taxed as
ordinary income. Thus, the impact of any changes would not be immediate and there could
be sufficient time to revise any tax law changes under a new administration. Furthermore, it
is difficult to predict how the company’s shares would react to any changes in the tax law.
Currently, there is a reluctance to own shares of alternative asset managers as many
institutional investors do not want to be burdened with filing K-1s, cannot own them due to
fund mandates or due to the float not being sufficient.
Alternative asset managers could reconsider their corporate structure and reorganize as a
corporation, if carried interest is taxed as ordinary income. This, in turn, could increase
demand for their shares and liquidity, helping offset some of the negative effect of having to
pay ordinary income taxes.
Requirement to file K-1 is holding back investors
As mentioned above, certain institutional investors do not want to invest in alternative asset
managers due to the requirement to file K-1s. Limited partnerships are required to issue a
Schedule K-1 to unitholders. This would require institutional investors to build out their back
office.
Each unitholder has to report the partnership’s taxable income on a K-1. A certain portion of
the income from owning the common units could have tax consequences for tax-exempt
entities if it was deemed “Unrelated Business Taxable Income” (UBTI).
The bottom line is this: Owning shares of any alternative asset manager structured as a
limited partnership can lead to incremental administrative burdens.
However, institutional investors can avoid this by entering into a total return swap/buying a
note that provides a synthetic exposure to returns. Our understanding of a TRS/note is that a
Ares Management, L.P.
May 27, 2014 Bulent Ozcan (212) 863-4818; bulent.ozcan@rbccm.com 23
24. broker would structure this such that the counterparty would receive the cash flow
associated with the underlying assets – for a fee. The broker would take care of any filing
requirements/back-office duties. This would allow institutional investors to own the
economic benefits in companies such as ARES without having to outright own the shares.
This, of course, is a very high-level description of the structure and the details would be
beyond the scope of this note. Some institutional clients are prohibited from owning a
limited partnership due to fund mandates. Owning a TRS/note would alleviate increased
administrative costs associated with owning the underlying securities outright.
Exhibit 22: Investors can gain exposure to alternative asset managers through total return
swaps
9.1% 8.9%
6.9%
6.6%
5.3%
3.6%
2.6%
0%
1%
2%
3%
4%
5%
6%
7%
8%
9%
10%
KKR FIG OZM APO BX OAK CG
Source: FactSet; RBC Capital Markets
Exhibit 22 above shows the percentage of shares outstanding owned by brokers/dealers.
Investors unable to own the shares directly can gain exposure to alternative asset managers
by entering into a total return swap (TRS) or buying a note that provides them synthetic
exposure to an alternative asset manager.
Were alternative asset managers to change their corporate structure due to a loss of tax
advantages associated with being a limited partnership, we believe that more institutional
investors could be enticed to own their shares. As mentioned previously, some institutional
investors cannot own limited partnerships due to fund mandates. Owning the shares directly
would add to liquidity, there is likely a high probability that brokers providing exposure to
limited partnerships match buy and sell orders internally before routing any trades to the
exchanges.
Analyzing companies within the sector is difficult given
inconsistent accounting & utilization of non-GAAP measures
across the sector and the difficulty of projecting realizations
We believe that the reason why alternative asset managers trade at a discount to traditional
asset managers can be explained by the complexity of the industry, lack of visibility into
earnings (realization) and the difficulty of comparing companies within the sector.
For instance, while some alternative asset managers disclose the value of accrued
performance fees on their balance sheet, others do not. Furthermore, while most companies
disclose economic net income (a non-GAAP measure of earnings power), Fortress does not.
Ares Management, L.P.
May 27, 2014 Bulent Ozcan (212) 863-4818; bulent.ozcan@rbccm.com 24
25. The reason is that economic net income (ENI) adds volatility to earnings. Fortress argues that
over time, ENI and distributable earnings will converge. ENI shows marks on portfolios,
unrealized incentive fees and carried interest as earnings, which can fluctuate from quarter
to quarter. There are other examples of non-GAAP measures being used to demonstrate
value creation. Simple exercises such as comparing capital raising activity and capital
deployment are inherently difficult because not all companies disclose these measures for all
of their business units. Moreover, it is extremely difficult to project earnings as there is very
little visibility into realizations. This leads to many surprises and misses when the companies
report earnings.
Exhibit 23 below depicts this and shows the average deviation of reported earnings versus
the mean analyst expectation on a quarterly basis. We would expect larger “misses” for
annual projections. The data below goes back to Q1/08 or latest quarter data was available.
Exhibit 23: Average earnings surprises – actual reported earnings versus estimated earnings
(%)
-17%
-459%
-11%
30% 31% 64%
-500%
-400%
-300%
-200%
-100%
0%
100%
APO BX CG OAK OZM KKR
Source: FactSet; RBC Capital Markets
Clearly, projecting next quarter’s earnings is not an easy undertaking. Yet, we believe that
the lack of transparency could lead to opportunities. We would not expect the accounting to
change, nor would we expect the alternative asset managers to agree to use common non-
GAAP measures to make their performance more comparable. Consequently, the sector as a
whole trades at a discount given the issues described above. We could see a multiple
expansion as the industry matures, investors become more comfortable with the accounting,
and alternative asset managers provide additional information that would allow an easier
comparison across the sector.
Ares Management, L.P.
May 27, 2014 Bulent Ozcan (212) 863-4818; bulent.ozcan@rbccm.com 25
26. Valuation framework
We value Ares Management, L.P. using a “one plus a half methodology”, which is a deviation
from the valuation approach we have used for traditional asset managers. Under this
method, earnings derived from fee-based earnings (asset management fees) are valued
using a peer traditional asset management multiple, while earnings attributed to incentive
income (performance fees) are valued at a 50% discount.
Management fees earned by Ares Management L.P. are higher than those earned by
traditional long-only fund managers, justifying a premium to peer P/E multiples in our view.
We are applying a 15% premium to the peer multiple to value fee-based earnings. As for
incentive income, we apply a 50% discount to the management fee earnings multiple to
value the incentive income related earnings. We believe a discount is justified as
performance fees are more volatile than fee-based earnings and difficult to project.
Our price target for Ares Management L.P. is $23. We arrive at our price target using a price-
to-earnings multiple of 18.0x on next-twelve months (NTM) estimated fee-based earnings of
$0.87 per common unit. This is consistent with the approach we have taken for alternative
asset managers. We believe that a premium to the median traditional asset management
multiple is warranted, as alternative asset managers tend to charge higher management fee
rates. Furthermore, assets tend to be stickier due to the long lock-up periods for private
equity funds. We value earnings based on management fees at $15.71.
Moreover, we value incentive income based on a price-to-earnings multiple of 9.0x and NTM
incentive income EPS of $0.76. The multiple of 9.0x represents a 50% discount to the fee-
based earnings multiple. We value earnings based on incentive income at $6.86 per common
unit. The sum of the two valuations leads us to our price target of $23 for Ares Management,
L.P.
Exhibit 24: Price target based on one-plus-a-half-methodology
Valuation
NTM Management Fee Related EPS $0.87
P/E Multiple 18.0x
Per Share $15.71
NTM Performance Related Income EPS $0.76
P/E Multiple 9.0x
Per Share $6.86
Price Target $23
Source: Company reports; RBC Capital Markets estimates
Our $23 base case scenario valuation is based on these assumptions over the next 12
months: Yield on incentive eligible assets of 4% in Tradable Credit; multiple of invested
capital of 1.5x in private equity; yield on incentive eligible assets of 6% in Direct Lending;
yield on incentive eligible assets of 4% in Real Estate.
Ares Management, L.P.
May 27, 2014 Bulent Ozcan (212) 863-4818; bulent.ozcan@rbccm.com 26
27. Risks and price target impediments
Poor performance of ARES’ funds could lead to a shortfall in distributable earnings
Ares, like other alternative asset managers, derives a portion of its earnings from
performance fees. Distributable earnings could decline if performance deteriorates.
Adverse capital market and economic conditions could impact ARES’ economic net
income
Difficult economic conditions could adversely affect the company’s results. The market value
of securities and debt instruments held by the company could decline. Furthermore,
illiquidity in the markets could adversely impact the pace of realizations. Assets under
management could decline, lowering the base upon which ARES charges management fees.
Finally, adverse markets could lead to an increase in financing costs or reduce the availability
of financial instruments used to support private equity and real estate funds.
Weak investment performance could result in declining assets under management
and impact the firm’s ability to raise capital for future funds
Weaker than expected fund performance could impact the firm's ability to raise additional
capital for follow-on funds. This could lead to lower management fees if ARES cannot
replenish the capital it returns to its limited partners.
A decline in Ares Capital Corporation’s (ARCC) management fees could adversely
impact revenues and earnings
About 42% of ARES’ management fees are derived from managing the operations of ARCC. If
ARCC’s total assets or its net investment income were to decline, the amount ARES receives
due to the investment advisory agreement it has with ARCC would decline as well.
Changes in the tax code could negatively impact the company’s share
Changes to the US federal tax law could have a negative impact on the share price. Currently,
carried interest is treated as capital gain and not ordinary income. If carried interest income
were to be treated as ordinary fee income, the company’s share price could be negatively
impacted as this would affect dividends.
Key person risk
Retention of key senior managing directors is important. A departure of key personnel and
loss of their services could have an adverse impact on the company’s ability to raise and
retain capital. Departure of the company’s senior professionals could also lead to the
departure of highly qualified employees. Several funds have “key person” provisions, which
provide investors with the right to redeem their investments should a senior employee
(other than the principals) leave the firm. A loss of a key person could negatively affect fund
performance.
Ares Management, L.P.
May 27, 2014 Bulent Ozcan (212) 863-4818; bulent.ozcan@rbccm.com 27
28. Company description
Founded in 1997, Ares Management L.P. (ARES) focuses mainly on alternative credit-based
strategies, which includes private equity, direct lending, tradable credit, and real estate
activities. Based out of Los Angeles, California, ARES has more than 15 offices in the United
States, Europe and Asia. ARES provides its services to sovereign wealth funds, endowments,
foundations, government and private pension funds, investment companies, family offices,
banks, insurance companies, private corporations and a limited number of high net worth
individuals. The company manages separate client-focused fixed income portfolios and
mutual funds for its clients. ARES provides a wide array of investment strategies, serving over
500 institutional clients directly and utilizing its publicly traded and sub-advised funds to
offer its products to a retail investor base. As of December 31, 2013, ARES had around 700
employees including approximately 310 investment professionals, 280 operations
management professionals, with the balance in administrative support. ARES’ assets under
management (AUM) stood at US$74 billion as of December 31, 2013, up from US$60.2 billion
as of December 31, 2012.
Exhibit 25: Ares Management L.P. snapshot
Founded 1997
Founders Antony Ressler
John Kissick
Michael Arougheti
Bennett Rosenthal
David Kaplan
Headquarters Los Angeles, California
Employees 700 (as of December 31, 2013)
Business Segments Tradable Credit Group
Direct Lending
Private Equity
Real Estate
Management Fees US$517 Million (December 31, 2013)
Total AUM US$74 Billion (December 31, 2013)
Source: Company reports
ARES operates through four investment groups:
Tradable Credit Group: The group manages US and European senior secured bank loans,
distressed debt, high yield bonds, and other fixed income investments in a variety of
funds and investment vehicles.
Direct Lending Group: This group manages assets of Ares Capital Europe, Ares Capital
Corporation and other funds. It primarily invests in self-originated senior and mezzanine
debt of middle market companies.
Private Equity Group: The group manages five private equity commingled funds that
focus on growth equity opportunities in North America, Europe, and China.
Real Estate Group: It focuses on making debt and equity investments in real estate
assets in North America and Europe. The group also makes investments through its
publicly traded REIT, Ares Commercial Real Estate Corporation.
Ares Management, L.P.
May 27, 2014 Bulent Ozcan (212) 863-4818; bulent.ozcan@rbccm.com 28
29. Milestones
Exhibit 26: Milestones
Year Highlights
1997 Founded by Antony Ressler, John Kissick, Michael Arougheti, David Kaplan, and Bennett Rosenthal,
Ares Management, L.P. was established by Apollo Global Management (APO) to manage a $1.2 billion
market value collateralized debt obligation vehicle
2002 Ares Management L.P. completed spinout from Apollo Global Management and became an independent
firm
2003 Launched first dedicated private equity funds group
Launched Ares Corporate Opportunities Fund I
2004 Launched first dedicated private debt funds group
Ares Private Debt group created a specialty finance company, Ares Capital Corporation (ARCC)
which is now the largest business development company by market capitalization
2006 Launched its second private equity fund: Ares Corporate Opportunities Fund II
2007 Direct Lending group expanded its presence in Europe and raised its first dedicated fund
The Abu Dhabi Investment Authority bought a nearly 20% stake in Ares Management, L.P.
2008 ARES launched its third private equity fund: Ares Corporate Opportunities Fund III
2010 ARCC completed its merger with Allied Capital. Allied Capital shares were delisted from the NYSE and
trading ceased at the close of trading on April 1, 2010.
ARES launched its first China growth fund in order to tap the Asian markets
2011 Company’s private equity group launched Ares Corporate Opportunities Fund Asia fousing on growth
equity opportunities in China
ARES bought Indicus Advisors in order to expand its presence in European Credit Business
Company bought Wrightwood, a provider of debt capital to the U.S. commercial real estate sector
2012 Ares Real Estate Group formed a specialty finance company, Ares Commercial Real Estate Corp (NYSE:
ACRE), a real estate investment trust focused on middle-market commercial real estate
In November, Ares' Markets Group launched its first publicly traded vehicle, Ares Dynamic Credit
Allocation Fund (NYSE:ARDC). This is a closed-end fund managing a portfolio of credit investments
Ares Management L.P.'s fourth US private equity fund called Ares Corporate Opportunities Fund IV was
raised
2013 Alleghany Corporation paid $250 million to acquire a 6.25% equity ownership interest in Ares
Management, L.P.
Ares Multi-Strategy Credit Fund commenced its operations in October
The company's Real Estate Group acquired a real estate investment management firm, AREA Property
Partners LP
ACRE acquired EF&A Funding, L.L.C., d/b/a Alliant Capital LLC, a financial services company focused on
originating and servicing multi-family loans for various government and government-sponsored
entities
Source: Company reports
Ares Management, L.P.
May 27, 2014 Bulent Ozcan (212) 863-4818; bulent.ozcan@rbccm.com 29
30. Business segments
ARES operates via four distinct investment groups that are the company’s reportable
segments: 1) Tradable Credit Group, 2) Direct Lending Group, 3) Private Equity Group, and 4)
Real Estate Group. These four groups can invest across a company’s capital structure—from
senior debt to common equity.
1) Tradable Credit Group
As of December 31, 2013, the team managed approximately US$28 billion of client assets
(38% of total AUM), while its average AUM stood at US$27 billion. The Ares Tradable Credit
Group has been investing in both bank loans and high yield bonds for more than 15 years.
The group invests in funds ranging from commingled and separately managed accounts for
institutional investors to publicly traded vehicles and sub-advised funds for retail investors.
Although the investment team helps customize around 75 tradable credit funds that the
company has to offer as per specific investment objectives, mandates can be broadly
categorized between long-only credit and alternative credit investment strategies. The Ares
Tradable Credit Group is based out of Los Angeles, London and New York and has 40 analysts
that support nearly 20 managers and traders. The group uses long-only (leveraged loans and
high yield bonds), multi-strategy credit and global special situations strategies to invest
primarily in tradable corporate debt securities. The Tradable Credit Group offers funds that
can be broadly divided into two categories:
Long-only Credit Funds: Tradable Credit Group’s long-only strategies involve investing
via strategic allocations to leveraged loans and high yield bonds. Long-only credit funds
mainly focus on long-only and performing credit with an aim of topping the performing
bank loan or high yield market indices. For leveraged loans, the group focuses on
investing in asset-rich, cash-flow positive companies that are active issuers in both the
primary and secondary markets. The team tactically allocates funds across bank loans
and high yield bonds based on market opportunity and relative value. Under the
Tradable Credit Group’s long-only strategies, the team manages over 51 funds. As of
December 31, 2013, Tradable Credit Group long-only credit AUM was US$19.1 billion
compared to US$18.7 billion, same period last year.
Alternative Credit Funds: The team invests up and down the capital structure and across
asset classes. Alternative credit funds aim to deliver attractive absolute risk-adjusted
returns relative to publicly traded stocks, hedge funds, distressed funds, bank loans, high
yield bonds or various other investment types. Under the Tradable Credit Group’s
alternative strategies, the team manages over 21 funds. As of December 31, 2013,
Tradable Credit Group alternative credit AUM was US$8.9 billion compared to US$7.2
billion, as of December 31, 2012.
Exhibit 27: Ares Tradable Credit Group Snapshot (as of December 31, 2013)
Segment Tradable Credit Group
Offices Los Angeles, London, New York
Primary Role Asset manager in the publicly traded debt markets
AUM US$28 Bn
Investment Strategies Long-Only Credit, Alternative Credit
Investment Funds ~75 active funds
Investment Personnel ~60 professionals
Local Market Presence US & Europe
Current Portfolio 600+ Companies
Source: Company reports
Ares Management, L.P.
May 27, 2014 Bulent Ozcan (212) 863-4818; bulent.ozcan@rbccm.com 30
31. Tradable Credit Group AUM: As of December 31, 2013, AUM from tradable credit team
stood at US$28.0 billion compared to US$25.9 billion as of December 31, 2012. The US$2.1
billion rise in Tradable Credit Group AUM was due to US$7.7 billion of new commitments
during the year 2013 and market appreciation of US$991.3 million across the portfolio. This
increase was offset by capital reduction of US$3.7 billion generated by the net pay down of
credit facilities by leveraged loan funds. The US$7.7 billion commitment includes a US$5.6
billion commitment to Tradable Credit Group long-only credit funds (US$4.7 billion in
commitments to Tradable Credit Group leveraged loan funds and US$924.0 million of new
equity commitments in Tradable Credit Group high yield fund). The remaining US$2.1 billion
commitment was to Tradable Credit Group alternative credit funds, which included: US$1.2
billion in commitments to Tradable Credit Group multi-strategy credit funds and US$885.0
million of new equity commitments in Tradable Credit Group special situation funds
Exhibit 28: Ares Tradable Credit Group AUM and Fee Earning AUM ($ in billion)
19.6
23.7
25.9
17.0
20.6
23.2
26.027.9
0.0
5.0
10.0
15.0
20.0
25.0
30.0
2010 2011 2012 2013
AUM Fee Earning AUM
Source: Company reports
As of December 31, 2013, Tradable Credit Group’s total fee earning AUM rose by US$2.8
billion (or 12.1%) to stand at US$26.0 billion, compared to US$23.2 billion as of December
31, 2012. The increase was mainly because of US$2.3 billion of new debt commitments for
funds that earn fees on a gross asset basis (primarily CLOs) and US$3.7 billion of new
subscriptions. However, the increase in fee earning AUM was partially offset by total net
distributions, redemptions and reduction in leverage (for funds that earn fees on a gross
asset basis) of US$4.3 billion (US$3.6 billion attributable to Tradable Credit Group long-only
credit funds and remaining US$690 million to Tradable Credit Group alternative credit
funds).
Revenues: Tradable Credit Group generates management and performance fees from long-
only credit and alternative credit funds:
Tradable Credit Group long-only credit funds: Management fees generated from long-
only credit funds ranges from 0.45% to 0.65% of principal par plus cash or NAV. As of
December 31, 2013, leveraged loan funds strategy had an average management
contract term of 12.5 years. The fee range of leveraged loan funds strategy usually
remains unchanged at the close of the re-investment period. The high-yield strategy
funds mainly represent open-ended managed accounts. Typically, these accounts do not
include investment period termination or management contract expiration dates.
Management fee rates provided by the fund decrease as the NAV of the funds exceed
certain negotiated amounts.
Ares Management, L.P.
May 27, 2014 Bulent Ozcan (212) 863-4818; bulent.ozcan@rbccm.com 31
32. Performance fees from Tradable Credit Group long-only credit funds represent 10% to
20% of each incentive eligible fund's profits subjected to a preferred return of
approximately 7% to 12%/annum.
Tradable Credit Group alternative credit funds: Management fees generated from
alternative credit funds usually range from 0.50% to 1.75% of NAV, gross asset value,
committed capital or invested capital. As of December 31, 2013, funds in this strategy
had an average management contract term of 9.2 years. The multi-strategy credit
strategy funds include open-ended or managed account structures. Typically, these
funds do not include investment period termination or management contract expiration
dates. The special situations strategy funds include closed-end funds with investment
period termination or management contract termination dates and managed accounts.
The managed accounts do not include investment period termination or management
contract termination dates.
Performance fees from Tradable Credit Group alternative credit funds represent 10% to
30% of each incentive eligible fund's profits subject to a preferred return of
approximately 5% to 9%/annum.
As of December 31, 2013, total management fees generated by Tradable Credit Group were
up slightly by US$0.7 million to stand at US$144.8 million compared to US$145.5 million,
same period last year. For the same period, the effective management fee rate for 2013
decreased by 0.08% to 0.59% (0.53% excluding deferred management fees). Ares Tradable
Credit Group witnessed a US$14.9 million increase from new funds. However, it was offset
by US$9.9 million lower one-time deferred fees earned in 2013 and US$6.5 million fall from
alternative credit funds. As of December 31, 2013, deferred management fees fell from
US$25 million in the year 2012 to US$15 million in the year 2013, as the contribution to the
effective management fee rate was 0.06% in 2013 when compared to 0.11% in the year
2012.
Exhibit 29: Ares Tradable Credit Group Revenue and ENI ($ in million)
98.6
145.5 144.8
6.7
106.7
59.7
84.9
198.0
278.4
0.0
50.0
100.0
150.0
200.0
250.0
300.0
2011 2012 2013
Management Fees Net Performance Fees Economic net income
Source: Company reports
Tradable Credit Group’s gross performance fees stood at US$136.8 million in 2013 down by
US$30.8 million as compared to year ended December 31, 2012. For year ended December
31, 2013, performance fees from the Tradable Credit Group long-only and alternative credit
funds were US$47.1 million and US$89.7 million, respectively. Performance fees from the
Tradable Credit Group long-only credit funds included US$38.7 million and US$8.4 million
Ares Management, L.P.
May 27, 2014 Bulent Ozcan (212) 863-4818; bulent.ozcan@rbccm.com 32
33. fees from Credit Strategies Fund I (CSF) and Ares Enhanced Credit Opportunities Fund I
(ECO), respectively.
Economic Net Income: Tradable Credit Group’s ENI was US$198.0 million for the year ended
December 31, 2013 compared to US$278.4 million for the year ended December 31, 2012.
The US$80.4 million decrease in ENI was primarily driven by decreases in net performance
fees, net investment income and FRE by US$47.0 million, US$29.3 million and US$4.0 million,
respectively.
2) Direct Lending Group
As of December 31, 2013, the team managed approximately US$27.5 billion of client assets
(37% of total AUM), while its average AUM stood at US$25 billion. For the same period,
Direct Lending Group managed more than 25 funds or investment vehicles. The Ares Direct
Lending Group delivers financing solutions to meet the distinct and underserved capital
needs of its clients. Direct Lending Group’s major clientele includes power generation and
infrastructure project owners, small and middle-market companies and early stage and
emerging growth companies, which are typically backed by venture capital firms. ARES’
direct lending group acts as direct lender to customers in the US and European markets via
its direct lending vehicles ARCC and ACE II.
ACE: Launched in 2007, Ares Capital Europe (ACE) invests in first lien senior secured loans,
second lien senior secured loans and long-term mezzanine debt in the European markets.
Also, ACE II is a commingled fund, which is dedicated to private direct lending in the
European middle market. The European team has approximately 30 investment professionals
located in four offices. ACE delivers financing solutions across a potential borrower’s capital
structure, which may include an equity component in some cases. It mainly focuses on high
free cash flow yielding companies in defensive industries and in healthy geographies. It
provides financing opportunities to middle-market companies with €10-€75 million of
EBITDA and an enterprise value of up to €500 million. As of December 31, 2013, the Direct
Lending Group's AUM from Europe funds was US$4.9 billion compared to US$3.3 billion,
same period last year.
Exhibit 30: Ares Direct Lending Group Snapshot (As of December 31, 2013)
Segment Direct Lending Group
AUM US$27 Bn
Investment Strategies US Direct Lending (ARCC), Euro Direct Lending (ACE II)
Investment Funds 25+ active funds
Investment Personnel ~125 professionals
Local Market Presence US & Europe
Current Portfolio 400+ companies
Source: Company reports
Direct Lending Group AUM: As of December 31, 2013, AUM from the direct lending team
stood at US$27.5 billion compared to US$22.5 billion as of December 31, 2012. The US$5.0
billion increase was backed by US$5.3 billion of new commitments to the funds. This
included US$1.6 billion in capital commitments to SSLP, US$1.6 billion in capital
commitments to ARCC, US$1.1 billion in capital commitments to ACE II and US$718.6 million
of new fund commitments to five managed accounts. Market appreciation across the
portfolio stood at US$1.3 billion. The increase in AUM witnessed a minor set back due to net
distributions and capital reduction of US$876.4 million and US$626 million, respectively.
Ares Management, L.P.
May 27, 2014 Bulent Ozcan (212) 863-4818; bulent.ozcan@rbccm.com 33
34. Exhibit 31: Ares Direct Lending Group AUM and Fee Earning AUM ($ in billion)
14.4
16.7
22.5
10.7
13.6
15.5
19.6
27.5
0.0
5.0
10.0
15.0
20.0
25.0
30.0
2010 2011 2012 2013
AUM Fee Earning AUM
Source: Company reports
As of December 31, 2013, total fee earning AUM stood at US$19.6 billion, up by US$4.1
billion from US$15.5 billion as of December 31, 2012. The increase in fee-earning AUM was
due to US$4.0 billion of subscriptions and capital deployment in funds. This included
subscriptions and capital deployments of US$2.0 billion in Senior Secured Loan Fund LLC
(SSLP) and US$1.2 billion in European Direct Lending Group funds. Market appreciation
across the portfolio stood at US$841.1 million. The increase was partially offset by net
distributions, redemption, and reduction in leverage of US$1.9 billion.
Revenues: Direct lending group generates management and performance fees from the US
and European markets.
Management Fees: Total management fees generated from the direct lending group ranges
from 0.75% to 2.00% of invested capital, NAV or total assets. In this strategy, certain closed
end funds and managed accounts step down to between 0.50% and 1.50% of the aggregate
cost or market value of the portfolio investments following the expiration or termination of
the investment period. Also, the management fees include the ARCC Part I Fees. The ARCC
Part I Fees are quarterly performance fees on the investment income from Ares Capital
Corporation (ARCC). ARES retains 20% of ARCC’s pre-incentive fee net investment income,
subject to a 1.75% quarterly hurdle rate. ARES views these fees as predictable and recurring
in nature, which leads to the management fee classification. As of December 31, 2013, the
funds in the strategy had an average management contract term of 10.2 years.
Performance Fees: Total performance fees from direct lending group represent 10% to 20%
of each incentive eligible fund's profits, or cumulative realized capital gains (net of realized
capital losses and unrealized capital depreciation). A few of the funds are also subject to a
preferred return of approximately 5% to 8% per year.
As of December 31, 2013, total management fees generated by the direct lending group
stood at US$238.4 million compared to US$190.1 million, same period last year. Out of the
US$48.3 million increase, US$33.1 million was due to incremental management fees driven
by additional capital raises of ARCC. For the same period, Ares Management’s Direct Lending
Group’s European platform also generated additional management fees of US$14.9 million.
Total management fee from ARCC was US$215.4 million as of December 31, 2013 out of
which US$110.5 million were earnings related to ARCC Part I Fees.
Ares Management, L.P.
May 27, 2014 Bulent Ozcan (212) 863-4818; bulent.ozcan@rbccm.com 34
35. Exhibit 32: Ares Direct Lending Group Revenue and ENI ($ in million)
154.7
190.1
238.4
5.7 8.0
71.9
99.3
121.8
0.0
50.0
100.0
150.0
200.0
250.0
300.0
2011 2012 2013
M anagement Fees Net Performance Fees Economic net income
Source: Company reports
Economic Net Income: As of December 31, 2013, direct lending group’s ENI was US$121.8
million compared to US$99.3 million, same period last year. The US$22.5 million increase
was backed by higher FRE of US$24.8 million and an increase in net performance fees of
US$2.3 million. However, the increase was partially offset by a US$4.6 million decrease in net
investment income.
3) Private Equity Group
As of December 31, 2013, the Ares Private Equity Group managed approximately US$9.9
billion of AUM (13% of total AUM) through five private equity funds. These include Ares
Corporate Opportunities Fund LP; Ares Corporate Opportunities Fund II LP; Ares Corporate
Opportunities Fund III LP; Ares Corporate Opportunities Fund Asia LP and Ares Corporate
Opportunities Fund IV LP. The group mainly focuses on investing in growth equity, distressed
buyouts/discounted debt accumulation, prudently leveraged control buyouts and rescue/de-
leveraging capital in order to maximize the risk/reward profile of the group’s invested
capital. The group deploys a flexible capital strategy that allows it to invest across various
market cycles. As per this strategy, the team put to work approximately US$2.7 billion across
2008-2009-2010 compared to US$3.1 billion across 2011-2012-2013. Private equity group’s
activities are maintained by two teams in North America/Europe and China.
North America/Europe flexible capital: The ARES senior private equity professionals
raised the firm’s first private equity fund in 2003. At present, the group has 40 senior
private equity professionals who are based in Los Angeles, London and Chicago. These
professionals invest in a wide variety of investment opportunities making equity
commitments generally in the US$100 to US$400 million range.
China growth capital: Ares Management expanded its presence in the Asian markets by
establishing its offices in Shanghai and Chengdu and a service office in Hong Kong. The
group has seven investment professionals that mainly target minority growth equity
investments in the US$25 to US$50 million range.
Ares Management, L.P.
May 27, 2014 Bulent Ozcan (212) 863-4818; bulent.ozcan@rbccm.com 35
36. Exhibit 33: Ares Private Equity Group Snapshot (As of December 31, 2013)
Segment Private Equity Group
AUM US$10Bn
Investment Strategies US/Euro Flexible Capital, China Growth Capital
Investment Funds 5 active funds
Investment Personnel ~50 professionals
Local Market Presence US, Europe and China
Current Portfolio 25+ companies
Source: Company reports
Private Equity Group AUM: As of December 31, 2013, total AUM declined by US$279 million
to stand at US$9.9 billion when compared to the same period last year. The decrease was led
by net distributions of US$713.4 million, which consisted of gross distributions of US$932.1
million offset by US$218.7 million in recallable amounts. Also, US$1.4 billion of capital was
called, offset by a similar reduction in uncalled committed capital with nominal net impact to
AUM with a net pay down of term loans of US$277.2 million. The decrease was marginally
offset by US$630 million market appreciation across the portfolio in the year 2013.
Exhibit 34: Ares Private Equity Group AUM and Fee Earning AUM ($ in billion)
7.8
7.4
10.1
5.2 4.9
7.8
7.2
9.9
0.0
2.0
4.0
6.0
8.0
10.0
12.0
2010 2011 2012 2013
AUM Fee Earning AUM
Source: Company reports
As of December 31, 2013, total fee earning AUM declined by US$595.8 million to US$7.2
billion compared to US$7.8 billion as of December 31, 2012. Total fee earning AUM was
comprised of capital commitments of $4.5 billion and invested capital of US$2.7 billion. The
decline in fee earning AUM was primarily driven by net distributions and redemptions of
US$590.5 million of limited partner capital.
Revenues: Private Equity group generates management and performance fees.
Management Fees: Management fee rates in the Private Equity Group range from 1.50% to
2.00% per annum of invested capital, stockholders' equity or total capital commitments
during the investment period. Management fees generally step down to between 0.75% and
1.125% of the aggregate cost basis of unrealized portfolio investments either due to
expiration (or termination) of the investment period or due to the launch of a successor
fund. These funds have an average management contract term of 12.5 years.
Performance Fees: Performance fees from private equity group represent 20% of each
incentive eligible fund's profits, subject to a preferred return of roughly 8% per annum.
Ares Management, L.P.
May 27, 2014 Bulent Ozcan (212) 863-4818; bulent.ozcan@rbccm.com 36
37. As of December 31, 2013, total management fees generated by the private equity group
stood at US$93.4 million, up from US$69.3 million on December 31, 2012. The effective
management fee rate increased by 0.15% to stand at 1.24% as of 2013. This was primarily
attributable to ACOF IV, which closed in Q2/12 and for which fees were activated during
Q4/12. The increase in management fees was due to a rise in fees from new funds of
US$56.8 million for the year ended December 31, 2013. This was partially offset by a
contractual fee step down of US$29.2 million in Ares Corporate Opportunities Fund III along
with realizations in legacy funds, which resulted in a decrease in fees of US$4.2 million.
Exhibit 35: Ares Private Equity Group Revenue and ENI ($ in million)
67.7 69.3
93.4
32.5
44.6
28.1
93.1
105.6110.2
0.0
20.0
40.0
60.0
80.0
100.0
120.0
2011 2012 2013
Management Fees Net Performance Fees Economic net income
Source: Company reports
Private Equity Group’s performance fees fell by US$16.5 million to stand at US$28.1 million
for the year ended December 31, 2013 compared to US$44.6 million, same period last year.
During the year 2013, the group witnessed performance fee reversals of around US$5.6
million mainly related to Ares Corporate Opportunities Fund I (ACOF I). The decline in the
performance fees was also driven by ACOF I, ACOF II and ACOF III due to substantial
realizations on the underlying investments during the year 2012.
Economic Net Income: Private Equity group’s ENI stood at US$105.6 million for the year
ended December 31, 2013 compared to US$110.2 million, as of December 31, 2012. The
US$4.6 million decrease was backed by lower net performance fees and net investment
income of US$16.5 million and US$4.5 million respectively. The decrease in ENI was partially
offset by higher FRE of US$16.3 million in 2013.
4) Real Estate Group
As of December 31, 2013, the Ares Real Estate Group managed approximately US$8.7 billion
of AUM (12% of total AUM). The group, which is headed by John Bartling and Lee Neibart,
manages US and European real estate, private equity and debt commingled funds and
separately managed accounts. It comprises of four platforms: European Equity, US Equity,
India Equity and Global Debt. The real estate group also manages ACRE, a publicly traded
commercial mortgage REIT. ACRE is focused on direct lending on properties owned by
commercial real estate sponsors and operators. As of December 31, 2013, the Ares real
estate group had around 80 investment professionals working in 15 cities across the US,
Europe, and India.
Ares Management, L.P.
May 27, 2014 Bulent Ozcan (212) 863-4818; bulent.ozcan@rbccm.com 37