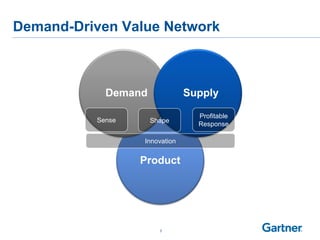
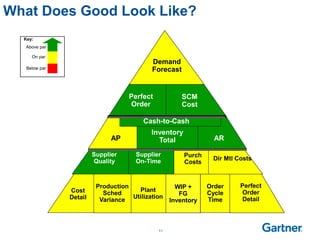
This presentation, including any supporting materials, is owned by Gartner, Inc. and/or its affiliates and is for the sole use of the intended Gartner audience or other
authorized recipients. This presentation may contain information that is confidential, proprietary or otherwise legally protected, and it may not be further copied,
distributed or publicly displayed without the express written permission of Gartner, Inc. or its affiliates.
© 2010 Gartner, Inc. and/or its affiliates. All rights reserved.
Debra Hofman
Managing Vice President
Supply Chain Research
Gartner Supply Chain Top 25:
Insights From Leaders
1
Agenda
• Defining Supply Chain Leadership
• Distinguishing Characteristics of
Leaders
• Leaders’ Focus Areas
2
From Supply Chain to Demand Driven
Value Network
From
Innovation an Externality
Assembly Line Supply
Demand Point a Given
To
Embedded Innovation
Networked Supply
Demand Management
3
Demand-Driven Value Network
Product
Demand Supply
Sense Shape
Profitable
Response
Innovation
4
Operations and innovation drive value
Higher cash flow,
profits, p/e
Operational
Excellence
(Perfect Order,
Total Supply
Chain Cost)
Leader
LeaderLaggard
Laggard
Innovation Excellence
(Time to Value, Return on R&D)
Winners
Losers
Demand Supply
Product
P
D
S
5
Financials
50%
Opinion
50%25% Peer vote
25% Analyst
vote
25% ROA
10%
Revenue
growth
15%
Inventory
turns
The Supply Chain Top 25 Methodology
6
2013
7
What distinguishes leaders: cross-
industry themes
• Outside-in focus
• Embedded innovation
• Extended supply chains
• Vision & Execution
• Excellence Addicts
Supply chains that are…
• Predictable and reliable
• Flexible
…and have:
• Profitable demand response
• Sustainable growth
• Satisfied customers
Outcome
8
Best Practices: Managing Performance
Supplier
Quality
Supplier
On-Time
Purchase
Costs
Dir Mtl
Costs
RM
Inv
Cost
Detail
Production
Schedule
Variance
Plant
Utilization
WIP + FG
Inventory
Order
Cycle
Time
Perfect
Order
Detail
Correct
Diagnose
AP AR
Inventory
Total
Cash-to-Cash
Assess
Demand
Forecast
SCM
Cost
Perfect
Order
The Hierarchy of Supply Chain Metrics
9
Best Practices: Managing Performance
Supplier
Quality
Supplier
On-Time
Purchase
Costs
Dir Mtl
Costs
RM
Inv
Cost
Detail
Production
Schedule
Variance
Plant
Utilization
WIP + FG
Inventory
Order
Cycle
Time
Perfect
Order
Detail
Correct
Diagnose
AP AR
Assess
Demand
Forecast
SCM
Cost
Perfect
Order
Inventory
Total
Cash-to-Cash
The Hierarchy of Supply Chain Metrics
10
Best Practices: Managing Performance
Supplier
Quality
Supplier
On-Time
Purchase
Costs
Dir Mtl
Costs
RM
Inv
Cost
Detail
Production
Schedule
Variance
Plant
Utilization
WIP + FG
Inventory
Order
Cycle
Time
Perfect
Order
Detail
Correct
Diagnose
AP AR
Assess
Demand
Forecast
SCM
Cost
Perfect
Order
Inventory
Total
Cash-to-Cash
The Hierarchy of Supply Chain Metrics
11
On par
Below par
Above par
Key:
Supplier
Quality
Supplier
On-Time
Purch
Costs
Dir Mtl Costs
Cost
Detail
Production
Sched
Variance
Plant
Utilization
Order
Cycle
Time
AP AR
Inventory
Total
Cash-to-Cash
Perfect
Order
SCM
Cost
Demand
Forecast
WIP +
FG
Inventory
Perfect
Order
Detail
What Does Good Look Like?
12
What distinguishes leaders: cross-
industry themes
• Outside-in focus
• Embedded innovation
• Extended supply chains
• Vision & Execution
• Excellence Addicts
Supply chains that are…
• Predictable and reliable
• Flexible
…and have:
• Profitable demand response
• Sustainable growth
• Satisfied customers
Outcome
Orchestrators
13
Trends
SC Talent
SC as Growth
Enabler
Simplification &
SegmentationMulti-Local
Strategies
Analytics
14
Thank You!
www.supplychaintop25.com

Keynote%20Debra%20Hofman%20Final

  • 1.
    This presentation, includingany supporting materials, is owned by Gartner, Inc. and/or its affiliates and is for the sole use of the intended Gartner audience or other authorized recipients. This presentation may contain information that is confidential, proprietary or otherwise legally protected, and it may not be further copied, distributed or publicly displayed without the express written permission of Gartner, Inc. or its affiliates. © 2010 Gartner, Inc. and/or its affiliates. All rights reserved. Debra Hofman Managing Vice President Supply Chain Research Gartner Supply Chain Top 25: Insights From Leaders
  • 2.
    1 Agenda • Defining SupplyChain Leadership • Distinguishing Characteristics of Leaders • Leaders’ Focus Areas
  • 3.
    2 From Supply Chainto Demand Driven Value Network From Innovation an Externality Assembly Line Supply Demand Point a Given To Embedded Innovation Networked Supply Demand Management
  • 4.
    3 Demand-Driven Value Network Product DemandSupply Sense Shape Profitable Response Innovation
  • 5.
    4 Operations and innovationdrive value Higher cash flow, profits, p/e Operational Excellence (Perfect Order, Total Supply Chain Cost) Leader LeaderLaggard Laggard Innovation Excellence (Time to Value, Return on R&D) Winners Losers Demand Supply Product P D S
  • 6.
    5 Financials 50% Opinion 50%25% Peer vote 25%Analyst vote 25% ROA 10% Revenue growth 15% Inventory turns The Supply Chain Top 25 Methodology
  • 7.
  • 8.
    7 What distinguishes leaders:cross- industry themes • Outside-in focus • Embedded innovation • Extended supply chains • Vision & Execution • Excellence Addicts Supply chains that are… • Predictable and reliable • Flexible …and have: • Profitable demand response • Sustainable growth • Satisfied customers Outcome
  • 9.
    8 Best Practices: ManagingPerformance Supplier Quality Supplier On-Time Purchase Costs Dir Mtl Costs RM Inv Cost Detail Production Schedule Variance Plant Utilization WIP + FG Inventory Order Cycle Time Perfect Order Detail Correct Diagnose AP AR Inventory Total Cash-to-Cash Assess Demand Forecast SCM Cost Perfect Order The Hierarchy of Supply Chain Metrics
  • 10.
    9 Best Practices: ManagingPerformance Supplier Quality Supplier On-Time Purchase Costs Dir Mtl Costs RM Inv Cost Detail Production Schedule Variance Plant Utilization WIP + FG Inventory Order Cycle Time Perfect Order Detail Correct Diagnose AP AR Assess Demand Forecast SCM Cost Perfect Order Inventory Total Cash-to-Cash The Hierarchy of Supply Chain Metrics
  • 11.
    10 Best Practices: ManagingPerformance Supplier Quality Supplier On-Time Purchase Costs Dir Mtl Costs RM Inv Cost Detail Production Schedule Variance Plant Utilization WIP + FG Inventory Order Cycle Time Perfect Order Detail Correct Diagnose AP AR Assess Demand Forecast SCM Cost Perfect Order Inventory Total Cash-to-Cash The Hierarchy of Supply Chain Metrics
  • 12.
    11 On par Below par Abovepar Key: Supplier Quality Supplier On-Time Purch Costs Dir Mtl Costs Cost Detail Production Sched Variance Plant Utilization Order Cycle Time AP AR Inventory Total Cash-to-Cash Perfect Order SCM Cost Demand Forecast WIP + FG Inventory Perfect Order Detail What Does Good Look Like?
  • 13.
    12 What distinguishes leaders:cross- industry themes • Outside-in focus • Embedded innovation • Extended supply chains • Vision & Execution • Excellence Addicts Supply chains that are… • Predictable and reliable • Flexible …and have: • Profitable demand response • Sustainable growth • Satisfied customers Outcome Orchestrators
  • 14.
    13 Trends SC Talent SC asGrowth Enabler Simplification & SegmentationMulti-Local Strategies Analytics
  • 15.