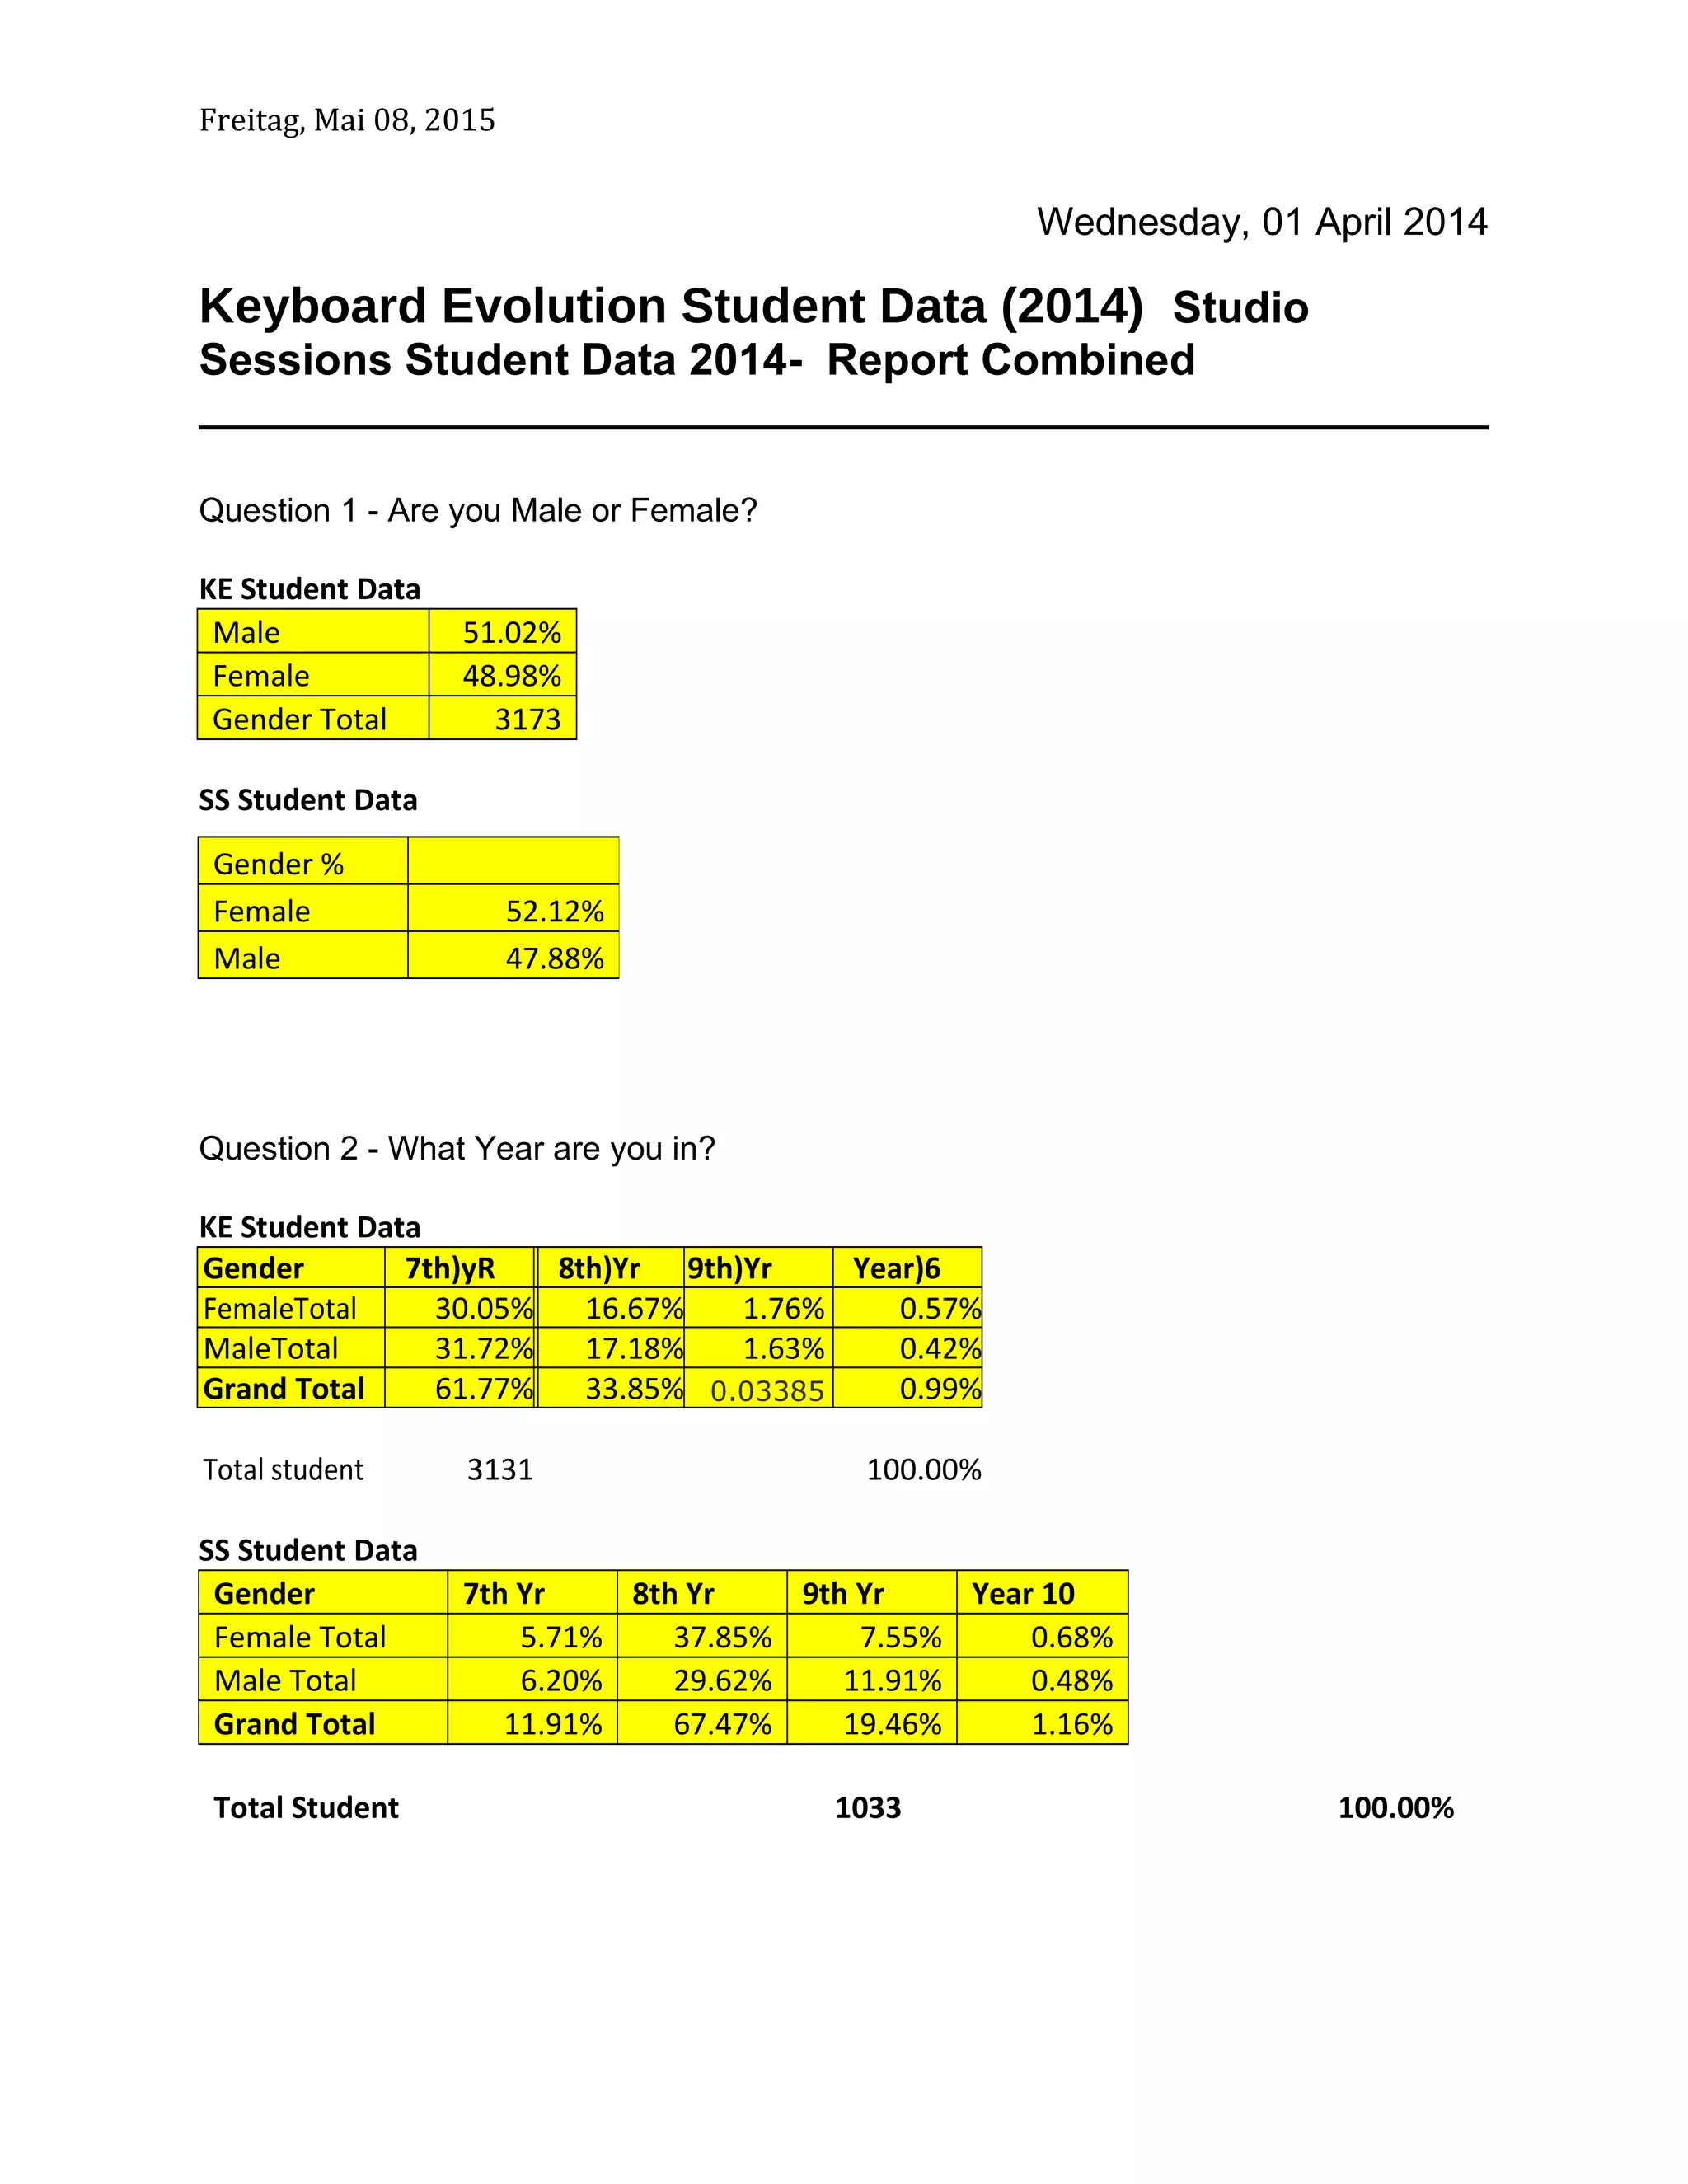
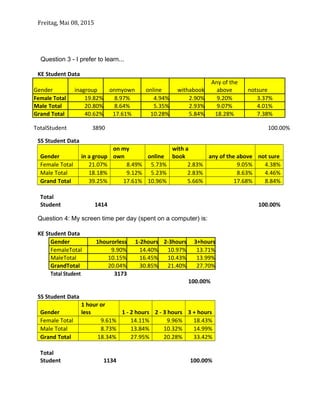
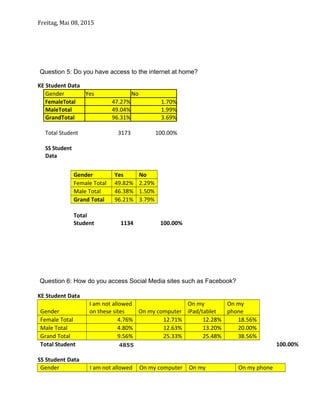
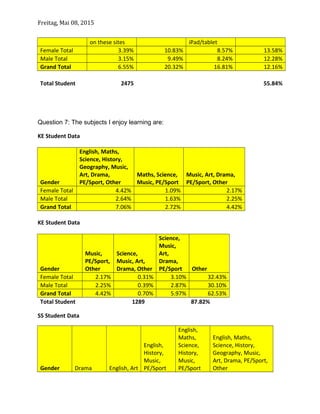
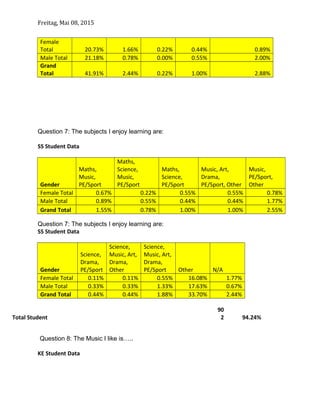
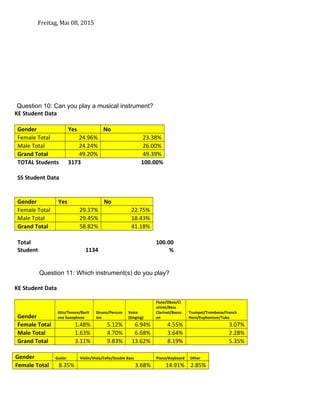
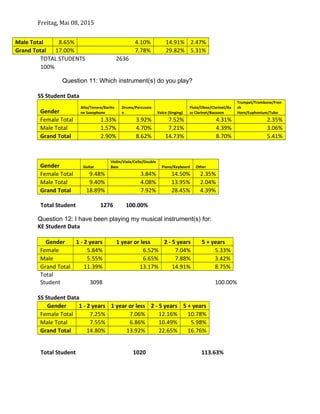
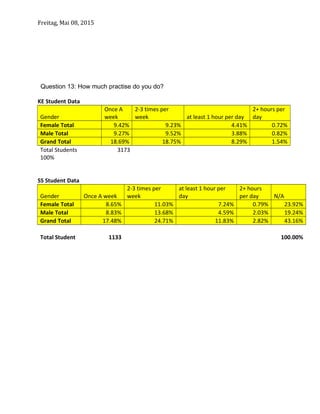
- The documents contain survey results from students participating in two programs: Keyboard Evolution (KE) and Studio Sessions (SS).
- The surveys gathered demographic information like gender and year of study, as well as data on students' music preferences, access to instruments, and practice habits.
- The data is broken down by questions with percentages showing the responses for males and females separately and combined.
The survey of 3,352 UNL students found that most students believe their professors treat students fairly regardless of political beliefs. A majority supported UNL joining the Big Ten for both academic and athletic reasons. While most students supported renovations to the campus recreation center, opinions were split on whether UNL should become a "wet campus" that allows alcohol. Students held a variety of views on national political issues, leaders, and 2012 elections.
This document summarizes the results of an online survey conducted in Vietnam about movie watching habits. Over 300 Vietnamese respondents shared how often they go to cinemas, what types of movies they prefer, and their favorite cinema chains. Key findings include that over half go to movies at least once a month, action and comedy are most popular genres, and CGV, Lotte and Galaxy are top cinema brands. Preferences vary between gender, age groups and cities. The survey provides useful market data on the Vietnamese movie industry.
The document summarizes the results of a survey about qualities of a good technical trainer. It finds:
- Most respondents were between 20-25 years old and from the east region.
- The majority were from the MT and ICT departments and in their 7th semester.
- Respondents agreed that trainers should prepare lessons, understand the material, know their students, use varied teaching methods and activities, and consider student level in exams.
- They also agreed trainers should be friendly, understand student needs, test themselves, accept evaluation, and teach different levels.
A survey was conducted about participation in fun runs. Of 501 respondents:
- Over 30% had never participated in a fun run, while 30% had participated in 1-2 fun runs.
- The top reasons for joining a fun run were that they are fun, for a good cause, and friends are participating.
- Most respondents usually run with 3-5 friends at fun runs.
- Respondents typically hear about fun runs through social media, word of mouth, and Facebook.
- The top reasons for not joining a fun run included there being no official time and the registration fees being too expensive.
The survey found that most TU BBA students read newspapers or watch TV for news, but TV viewership is slightly higher at 82.66% compared to newspaper readership at 77.33%. More male students (25.33%) do not read newspapers than female students (20%). While most students use both newspapers and TV for news, preference for TV alone at 24.66% is higher than newspapers alone at 21.33%, possibly due to the rise of 24-hour TV channels.
This document summarizes the results of a survey given to 136 students in Spain to understand their perspectives on gender equality in sports. The key findings were:
- The students were evenly split between male and female.
- Most students (76%) practice some sport, with football being the most popular.
- Students generally practice sports 2-3 times a week and mostly play with both boys and girls.
- Many sports like basketball, football, and volleyball can be played by both men and women. Oil wrestling and motorbike racing were seen as sports only for boys/men while ballet was seen as only for girls/women.
The document describes the results of a survey given to APEX students to understand their lives outside the classroom better. Key findings include:
- Over half of students get less than 7 hours of sleep per night, though most think 7 hours is recommended.
- Students spend 3+ hours per day on media like texting and TV. Boys watch more TV while girls text more.
- The top reasons for tardiness are oversleeping and transportation issues. Boys are late more due to family responsibilities.
- Most students plan to attend college after APEX, though boys cite full-time work and military more than girls.
- While most students and families want them to attend college, over a quarter feel
STEM Students Abroad: Understanding their Motivations and ExperiencesCIEE
This session will focus on science, technology, engineering, and mathematics (STEM) students' motivations for studying abroad and the value of their experiences. With STEM fields underrepresented in study abroad, we hope to share student stories that encourage future STEM students to take the leap. Survey data from STEM student feedback will highlight: why STEM students study abroad, types of experiences, skills gained abroad for future careers or academic pursuits, perceived barriers to studying abroad, and ways to meet those challenges. Part of the session will focus on learning more about academic advisor perspectives on STEM students studying abroad, including benefits and challenges.
IT Services Questionnaire Analysis LinkedinLuke Searle
The survey results show that most students and teachers are generally satisfied with the IT services at Perins School. Some key findings include:
- 57% of all students said issues were resolved straight away, while 33% had to wait a short time
- 65% agreed that the IT team resolved their issues and explained what was wrong
- 76% said their questions were answered and 75% felt the IT team showed product knowledge
- The most helpful member of the IT team, according to 65% of respondents, was Mr. Searle
- Customer service was rated as excellent by 22% and good by 48% of respondents
262 students from a junior high school in Greece completed an online survey about their participation in physical activities. The survey found that:
1) 41.38% of students exercise 3-5 times per week, while 34.48% exercise more than 5 times per week.
2) 67.30% of students enjoy participating in physical activities most of the time.
3) Remarkably, boys in the first grade reported that physical activity helps them release tension totally, while girls in the first grade did not report the same level of stress relief.
This document provides a quarterly accomplishment report for Cluster IV (LloHerMaBaGen) in Cebu Province, Philippines. It summarizes statistical data on learners by implementer, district, and program. It also outlines major activities conducted, including accreditation and equivalency test results, professional development workshops, learning sessions, graduation ceremonies, and a household survey. The cluster aims to support Alternative Learning System programs through data collection, training opportunities, and community outreach.
Raising Standards Performance Review November 2008TFulmer1980
The document summarizes discussions from a faculty meeting at Glenn Hills Middle School aimed at raising academic standards. It outlines the school's vision, leadership standards, and data on student performance, retention rates, attendance, discipline issues. Assessment data showed 15% of students made the honor roll while 42% had one or more failing grades. Special education students had higher failure rates than average.
Spatial regression model predicting Thailand’s election โดย อาจารย์ ดร. อานน...BAINIDA
The document discusses a conference on business analytics and data science in Thailand that included several presentations and topics:
1) Using data science to predict the results of Thailand's upcoming election and factors like social, economic, geographic, and demographic variables that could influence election outcomes.
2) Building spatial regression models to predict election results based on past voting data and other metrics.
3) One presentation discussed building a spatial negative binomial regression model to predict Thailand's 2011 election results based on 2005 and 2007 election data as well as socioeconomic and demographic variables.
This document summarizes the findings of a survey assessing developmental assets among students in the Bernards Township School District. Key findings include higher rates of alcohol use among student athletes compared to others, evidence of students riding with drunk drivers, and increasing rates of cheating on tests with grade level. The implications are that efforts are needed to address risks of alcohol use and prevent drunk driving, strengthen developmental assets for at-risk students, and explore ways to reduce cheating. Sharing the survey results with students and community could empower discussion around issues examined.
NATIONAL SURVEY ON SUBSTANCE USE IN THE GENERAL POPULATION IN GEORGIA 2015Irma Kirtadze M.D.
This presentation was produced by Addiction Research Center Alternative Georgia for the Addiction Research Development in Georgia Project funded by United States Agency for International Development (USAID) and Czech Development Agency (CzDA).
This document summarizes a presentation given at EMAC 2012 in Lisbon, Portugal about segmenting Facebook users who are rural tourists based on their geo-demographics, travel motivations, and activities. The study analyzed survey responses from over 1,000 Finnish Facebook users who had used the platform in the previous week. Chi-square tests found differences among age, gender, region of residence in terms of travel motivations and preferred activities. The results suggest socio-demographic variables remain important for segmentation and targeting on Facebook. New approaches may be needed to embrace online market segmentation.
Presence of middle school students’ participation inadmurphy
This document summarizes a research study that explored middle school students' sense of "presence" and participation in a virtual game environment about science topics. The study involved 154 6th and 7th grade students who played two games, Sheep Trouble and Weather Trouble, to practice scientific inquiry. Students completed pre- and post-surveys on their experience. The results showed that over half of students reported feeling some level of presence in the virtual environment. Seventh graders reported higher levels of presence than sixth graders. The study provides evidence that virtual games can help students engage with scientific concepts.
This document provides admissions statistics for students admitted to the NU Foundation Year Program from 2010 to 2016. It summarizes the number of applicants, exam takers meeting admission criteria, accepted students, and their test scores and choices of NU schools. Over this period, the number of applicants increased while the number of accepted students fluctuated between 484 and 720. Accepted students predominantly came from East Kazakhstan, Astana, and Almaty regions and most commonly chose the School of Engineering or Science and Technology. IELTS scores and entrance exam scores generally trended upward over this time period.
This document summarizes the results of an online questionnaire given to journalism educators from around the world about their views on the future of journalism. Some key findings include:
- Over 1000 educators from 42 countries responded, with most coming from European countries. The majority have higher education degrees and teach journalism skills.
- Respondents tended to be older (72% over 40), mostly male (54%), and have significant practical journalism experience (65% over 5 years).
- Educators see important qualifications as practical journalism experience and general knowledge, but think a university degree is less important than skills for teachers.
- They believe students' future careers will likely involve freelancing or working for startups rather than
SOCIAL NETWORK SITE USAGE IN INDONESIADI Marketing
The study surveyed 2,000 Indonesian social media users over 5 days in June 2017. It found that Facebook, Instagram and YouTube are the top 3 social networks used in Indonesia, with Facebook being the most frequently used. 88% of respondents access social media via smartphones, spending an average of 1.82 hours per day. The most common activities are communicating with friends, updating social news, and viewing friends' news. Local news, movies and life skills guides are the most followed topics. Clothing, shoes and bags are most frequently purchased through social networks, with 46% using social media for business purposes.
The document describes a survey conducted by students on knowledge of colon cancer in Malaysia. It includes an introduction describing the disease and survey objectives. The methodology section outlines how they created and distributed survey forms to collect data from males and females. The results and analysis sections present the data in tables and graphs, comparing responses between genders. Overall, the findings suggest females displayed greater knowledge of colon cancer symptoms and risks compared to males.
Reading opens the gate way to an ever increasing find for of information about oneself and his surroundings. Reading is essential for national integration and international understanding too. This article finds about the students engineering college habits on reading skills. Then the article shows that the students of engineering are having reading habit which is differentiated according to their area of interest, students reading style and mode of education in school. It helps them to understand and appreciate the common achievements. The unique contribution is made by the people nation towards the advancement of human culture and civilization and the joys and sufferings shared by the whole human societies. Through reading, it is possible to build sound values and arrive at means and methods for creative living in this machine age. Therefore they would develop their reading skills through reading style, rectifying their problem while reading, method of reading area of interest and taking notes.
Similar to KE and SS Student Data 2014 Combined (20)
An Experimental Study on Habits of Reading Skills among First Year Engineerin...
KE and SS Student Data 2014 Combined
1. Freitag, Mai 08, 2015
Wednesday, 01 April 2014
Keyboard Evolution Student Data (2014) Studio
Sessions Student Data 2014- Report Combined
Question 1 - Are you Male or Female?
KE Student Data
Male 51.02%
Female 48.98%
Gender Total 3173
SS Student Data
Question 2 - What Year are you in?
KE Student Data
Gender 7th)yR 8th)Yr 9th)Yr Year)6
FemaleTotal 30.05% 16.67% 1.76% 0.57%
MaleTotal 31.72% 17.18% 1.63% 0.42%
Grand Total 61.77% 33.85% 0.03385 0.99%
Total student 3131 100.00%
SS Student Data
Gender 7th Yr 8th Yr 9th Yr Year 10
Female Total 5.71% 37.85% 7.55% 0.68%
Male Total 6.20% 29.62% 11.91% 0.48%
Grand Total 11.91% 67.47% 19.46% 1.16%
Total Student 1033 100.00%
Gender %
Female 52.12%
Male 47.88%
2. Freitag, Mai 08, 2015
Question 3 - I prefer to learn...
KE Student Data
Gender inagroup onmyown online withabook
Any of the
above notsure
Female Total 19.82% 8.97% 4.94% 2.90% 9.20% 3.37%
Male Total 20.80% 8.64% 5.35% 2.93% 9.07% 4.01%
Grand Total 40.62% 17.61% 10.28% 5.84% 18.28% 7.38%
TotalStudent 3890 100.00%
SS Student Data
Gender in a group
on my
own online
with a
book any of the above not sure
Female Total 21.07% 8.49% 5.73% 2.83% 9.05% 4.38%
Male Total 18.18% 9.12% 5.23% 2.83% 8.63% 4.46%
Grand Total 39.25% 17.61% 10.96% 5.66% 17.68% 8.84%
Total
Student 1414 100.00%
Question 4: My screen time per day (spent on a computer) is:
KE Student Data
Gender 1hourorless 1-2hours 2-3hours 3+hours
FemaleTotal 9.90% 14.40% 10.97% 13.71%
MaleTotal 10.15% 16.45% 10.43% 13.99%
GrandTotal 20.04% 30.85% 21.40% 27.70%
Total Student 3173
100.00%
SS Student Data
Gender
1 hour or
less 1 - 2 hours 2 - 3 hours 3 + hours
Female Total 9.61% 14.11% 9.96% 18.43%
Male Total 8.73% 13.84% 10.32% 14.99%
Grand Total 18.34% 27.95% 20.28% 33.42%
Total
Student 1134 100.00%
3. Freitag, Mai 08, 2015
Question 5: Do you have access to the internet at home?
KE Student Data
Gender Yes No
FemaleTotal 47.27% 1.70%
MaleTotal 49.04% 1.99%
GrandTotal 96.31% 3.69%
Total Student 3173 100.00%
SS Student
Data
Question 6: How do you access Social Media sites such as Facebook?
KE Student Data
Gender
I am not allowed
on these sites On my computer
On my
iPad/tablet
On my
phone
Female Total 4.76% 12.71% 12.28% 18.56%
Male Total 4.80% 12.63% 13.20% 20.00%
Grand Total 9.56% 25.33% 25.48% 38.56%
Total Student 4855 100.00%
SS Student Data
Gender I am not allowed On my computer On my On my phone
Gender Yes No
Female Total 49.82% 2.29%
Male Total 46.38% 1.50%
Grand Total 96.21% 3.79%
Total
Student 1134 100.00%
4. Freitag, Mai 08, 2015
on these sites iPad/tablet
Female Total 3.39% 10.83% 8.57% 13.58%
Male Total 3.15% 9.49% 8.24% 12.28%
Grand Total 6.55% 20.32% 16.81% 12.16%
Total Student 2475 55.84%
Question 7: The subjects I enjoy learning are:
KE Student Data
Gender
English, Maths,
Science, History,
Geography, Music,
Art, Drama,
PE/Sport, Other
Maths, Science,
Music, PE/Sport
Music, Art, Drama,
PE/Sport, Other
Female Total 4.42% 1.09% 2.17%
Male Total 2.64% 1.63% 2.25%
Grand Total 7.06% 2.72% 4.42%
KE Student Data
Gender
Music,
PE/Sport,
Other
Science,
Music, Art,
Drama, Other
Science,
Music,
Art,
Drama,
PE/Sport Other
Female Total 2.17% 0.31% 3.10% 32.43%
Male Total 2.25% 0.39% 2.87% 30.10%
Grand Total 4.42% 0.70% 5.97% 62.53%
Total Student 1289 87.82%
SS Student Data
Gender Drama English, Art
English,
History,
Music,
PE/Sport
English,
Maths,
Science,
History,
Music,
PE/Sport
English, Maths,
Science, History,
Geography, Music,
Art, Drama, PE/Sport,
Other
5. Freitag, Mai 08, 2015
Female
Total 20.73% 1.66% 0.22% 0.44% 0.89%
Male Total 21.18% 0.78% 0.00% 0.55% 2.00%
Grand
Total 41.91% 2.44% 0.22% 1.00% 2.88%
Question 7: The subjects I enjoy learning are:
SS Student Data
Gender
Maths,
Music,
PE/Sport
Maths,
Science,
Music,
PE/Sport
Maths,
Science,
PE/Sport
Music, Art,
Drama,
PE/Sport, Other
Music,
PE/Sport,
Other
Female Total 0.67% 0.22% 0.55% 0.55% 0.78%
Male Total 0.89% 0.55% 0.44% 0.44% 1.77%
Grand Total 1.55% 0.78% 1.00% 1.00% 2.55%
Question 7: The subjects I enjoy learning are:
SS Student Data
Gender
Science,
Drama,
PE/Sport
Science,
Music, Art,
Drama,
Other
Science,
Music, Art,
Drama,
PE/Sport Other N/A
Female Total 0.11% 0.11% 0.55% 16.08% 1.77%
Male Total 0.33% 0.33% 1.33% 17.63% 0.67%
Grand Total 0.44% 0.44% 1.88% 33.70% 2.44%
Total Student
90
2 94.24%
Question 8: The Music I like is…..
KE Student Data
7. Freitag, Mai 08, 2015
Question 8: The Music I like is…..
SS Student Data
Gender Pop Rock Classical Romantic Baroque Jazz Dance
All of
the
Above
Not
sure Other
Female Total 10.24% 5.82% 5.87% 1.14% 1.04% 2.34% 8.16% 3.78% 5.07% 7.11%
Male Total 13.08% 5.37% 6.32% 1.39% 0.55% 3.23% 6.91% 3.03% 2.29% 7.26%
Grand Total 23.32% 11.19% 12.18% 2.54% 1.59% 5.57% 15.07% 6.81% 7.36% 14.37%
100.00%
Total Students 2011
Question 9: In Primary School, I got to play/sing music…..
KE Student Data
Gender
Every
day Never Occasionally
Once a
fortnight
Once a
month
Once a
week
Several times a
week
Female Total 1.83% 7.03% 10.05% 1.51% 0.66% 20.23% 7.66%
Male Total 1.73% 11.82% 11.53% 1.70% 1.13% 16.86% 6.24%
Grand Total 3.56% 18.85% 21.59% 3.21% 1.80% 37.09% 13.90%
total student 3173 100.00%
SS Student Data
Gender Every day Never Occasionally Once a fortnight Once a month Once a week
Several times
a week
Female Total 2.38% 9.35% 13.67% 2.38% 0.97% 16.14% 7.23%
Male Total 1.50% 7.76% 11.90% 2.20% 0.88% 13.67% 9.96%
Grand Total 3.88% 17.11% 25.57% 4.59% 1.85% 29.81% 17.20%
Total
Students 1134 100.00%
8. Freitag, Mai 08, 2015
Question 10: Can you play a musical instrument?
KE Student Data
Gender Yes No
Female Total 24.96% 23.38%
Male Total 24.24% 26.00%
Grand Total 49.20% 49.39%
TOTAL Students 3173 100.00%
SS Student Data
Gender Yes No
Female Total 29.37% 22.75%
Male Total 29.45% 18.43%
Grand Total 58.82% 41.18%
Total
Student 1134
100.00
%
Question 11: Which instrument(s) do you play?
KE Student Data
Gender
Alto/Tenore/Barit
one Saxophone
Drums/Percuss
ion
Voice
(Singing)
Flute/Oboe/Cl
arinet/Bass
Clarinet/Basso
on
Trumpet/Trombone/French
Horn/Euphonium/Tuba
Female Total 1.48% 5.12% 6.94% 4.55% 3.07%
Male Total 1.63% 4.70% 6.68% 3.64% 2.28%
Grand Total 3.11% 9.83% 13.62% 8.19% 5.35%
Gender Guitar Violin/Viola/Cello/Double Bass Piano/Keyboard Other
Female Total 8.35% 3.68% 14.91% 2.85%
9. Freitag, Mai 08, 2015
Male Total 8.65% 4.10% 14.91% 2.47%
Grand Total 17.00% 7.78% 29.82% 5.31%
TOTAL STUDENTS 2636
100%
Question 11: Which instrument(s) do you play?
SS Student Data
Gender
Alto/Tenore/Barito
ne Saxophone
Drums/Percussio
n Voice (Singing)
Flute/Oboe/Clarinet/Ba
ss Clarinet/Bassoon
Trumpet/Trombone/Fren
ch
Horn/Euphonium/Tuba
Female Total 1.33% 3.92% 7.52% 4.31% 2.35%
Male Total 1.57% 4.70% 7.21% 4.39% 3.06%
Grand Total 2.90% 8.62% 14.73% 8.70% 5.41%
Gender Guitar
Violin/Viola/Cello/Double
Bass Piano/Keyboard Other
Female Total 9.48% 3.84% 14.50% 2.35%
Male Total 9.40% 4.08% 13.95% 2.04%
Grand Total 18.89% 7.92% 28.45% 4.39%
Total Student 1276 100.00%
Question 12: I have been playing my musical instrument(s) for:
KE Student Data
Gender 1 - 2 years 1 year or less 2 - 5 years 5 + years
Female 5.84% 6.52% 7.04% 5.33%
Male 5.55% 6.65% 7.88% 3.42%
Grand Total 11.39% 13.17% 14.91% 8.75%
Total
Student 3098 100.00%
SS Student Data
Gender 1 - 2 years 1 year or less 2 - 5 years 5 + years
Female Total 7.25% 7.06% 12.16% 10.78%
Male Total 7.55% 6.86% 10.49% 5.98%
Grand Total 14.80% 13.92% 22.65% 16.76%
Total Student 1020 113.63%
10. Freitag, Mai 08, 2015
Question 13: How much practise do you do?
KE Student Data
Gender
Once A
week
2-3 times per
week at least 1 hour per day
2+ hours per
day
Female Total 9.42% 9.23% 4.41% 0.72%
Male Total 9.27% 9.52% 3.88% 0.82%
Grand Total 18.69% 18.75% 8.29% 1.54%
Total Students 3173
100%
SS Student Data
Gender Once A week
2-3 times per
week
at least 1 hour per
day
2+ hours
per day N/A
Female Total 8.65% 11.03% 7.24% 0.79% 23.92%
Male Total 8.83% 13.68% 4.59% 2.03% 19.24%
Grand Total 17.48% 24.71% 11.83% 2.82% 43.16%
Total Student 1133 100.00%