Downloaded 392 times
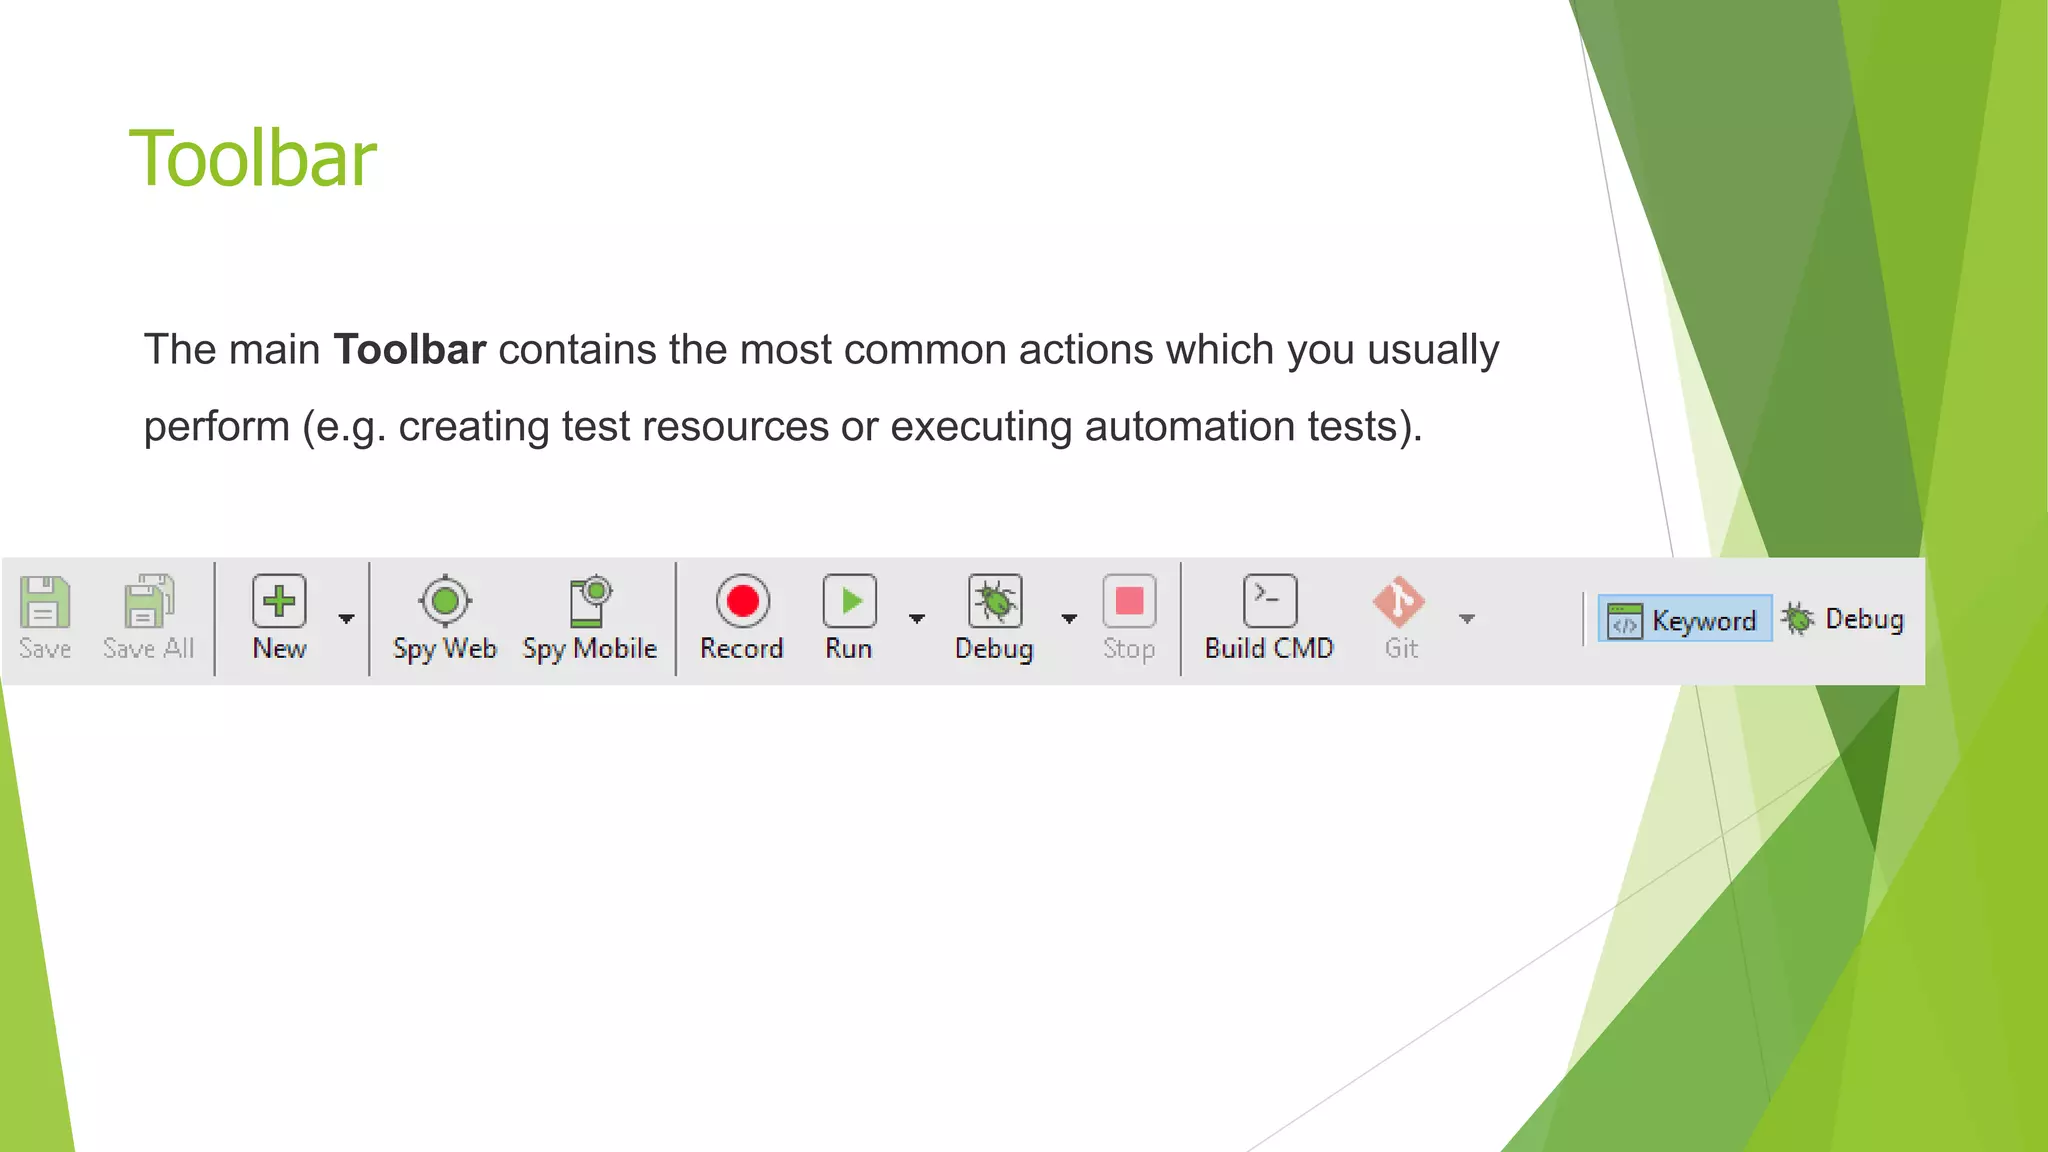
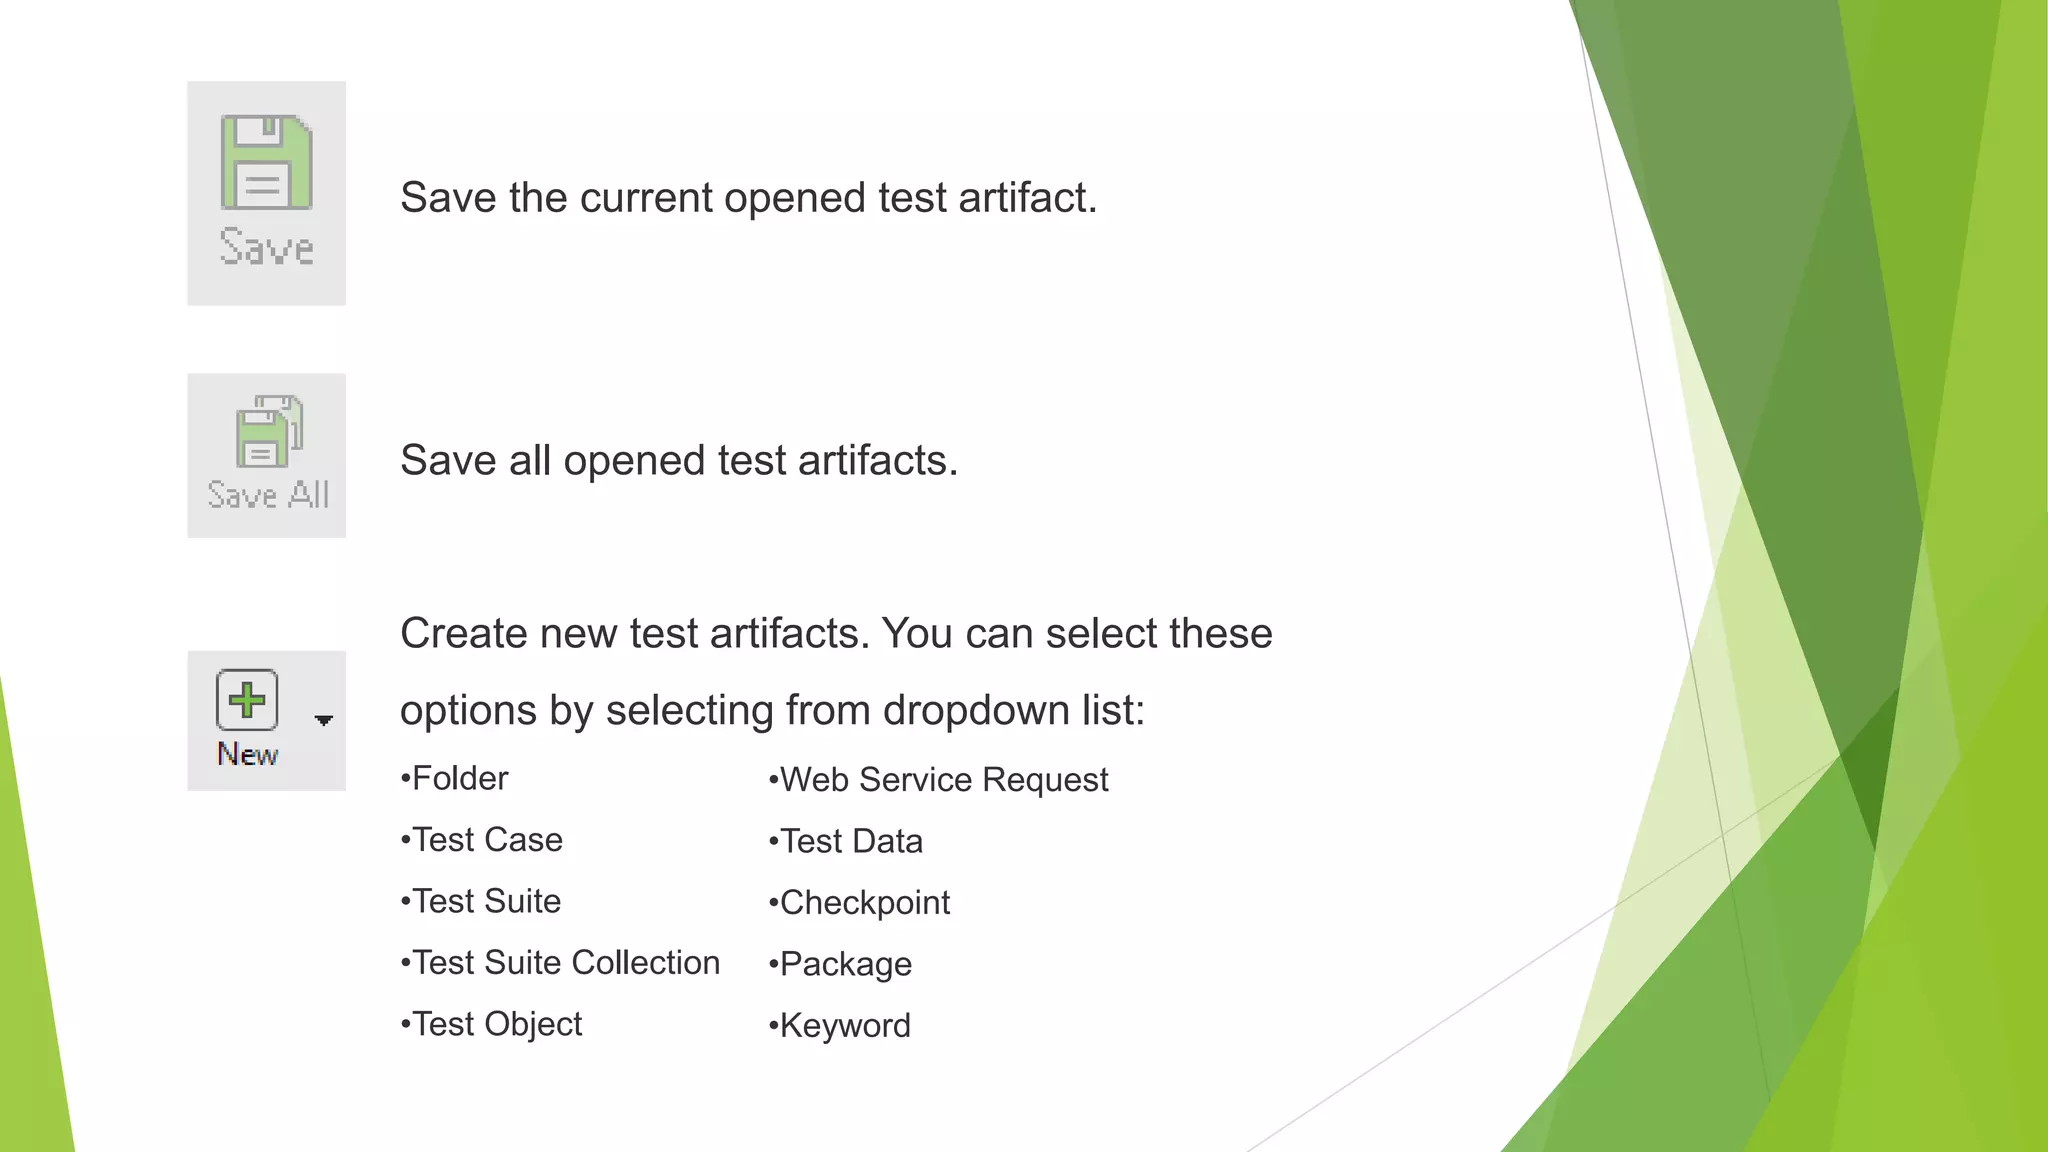
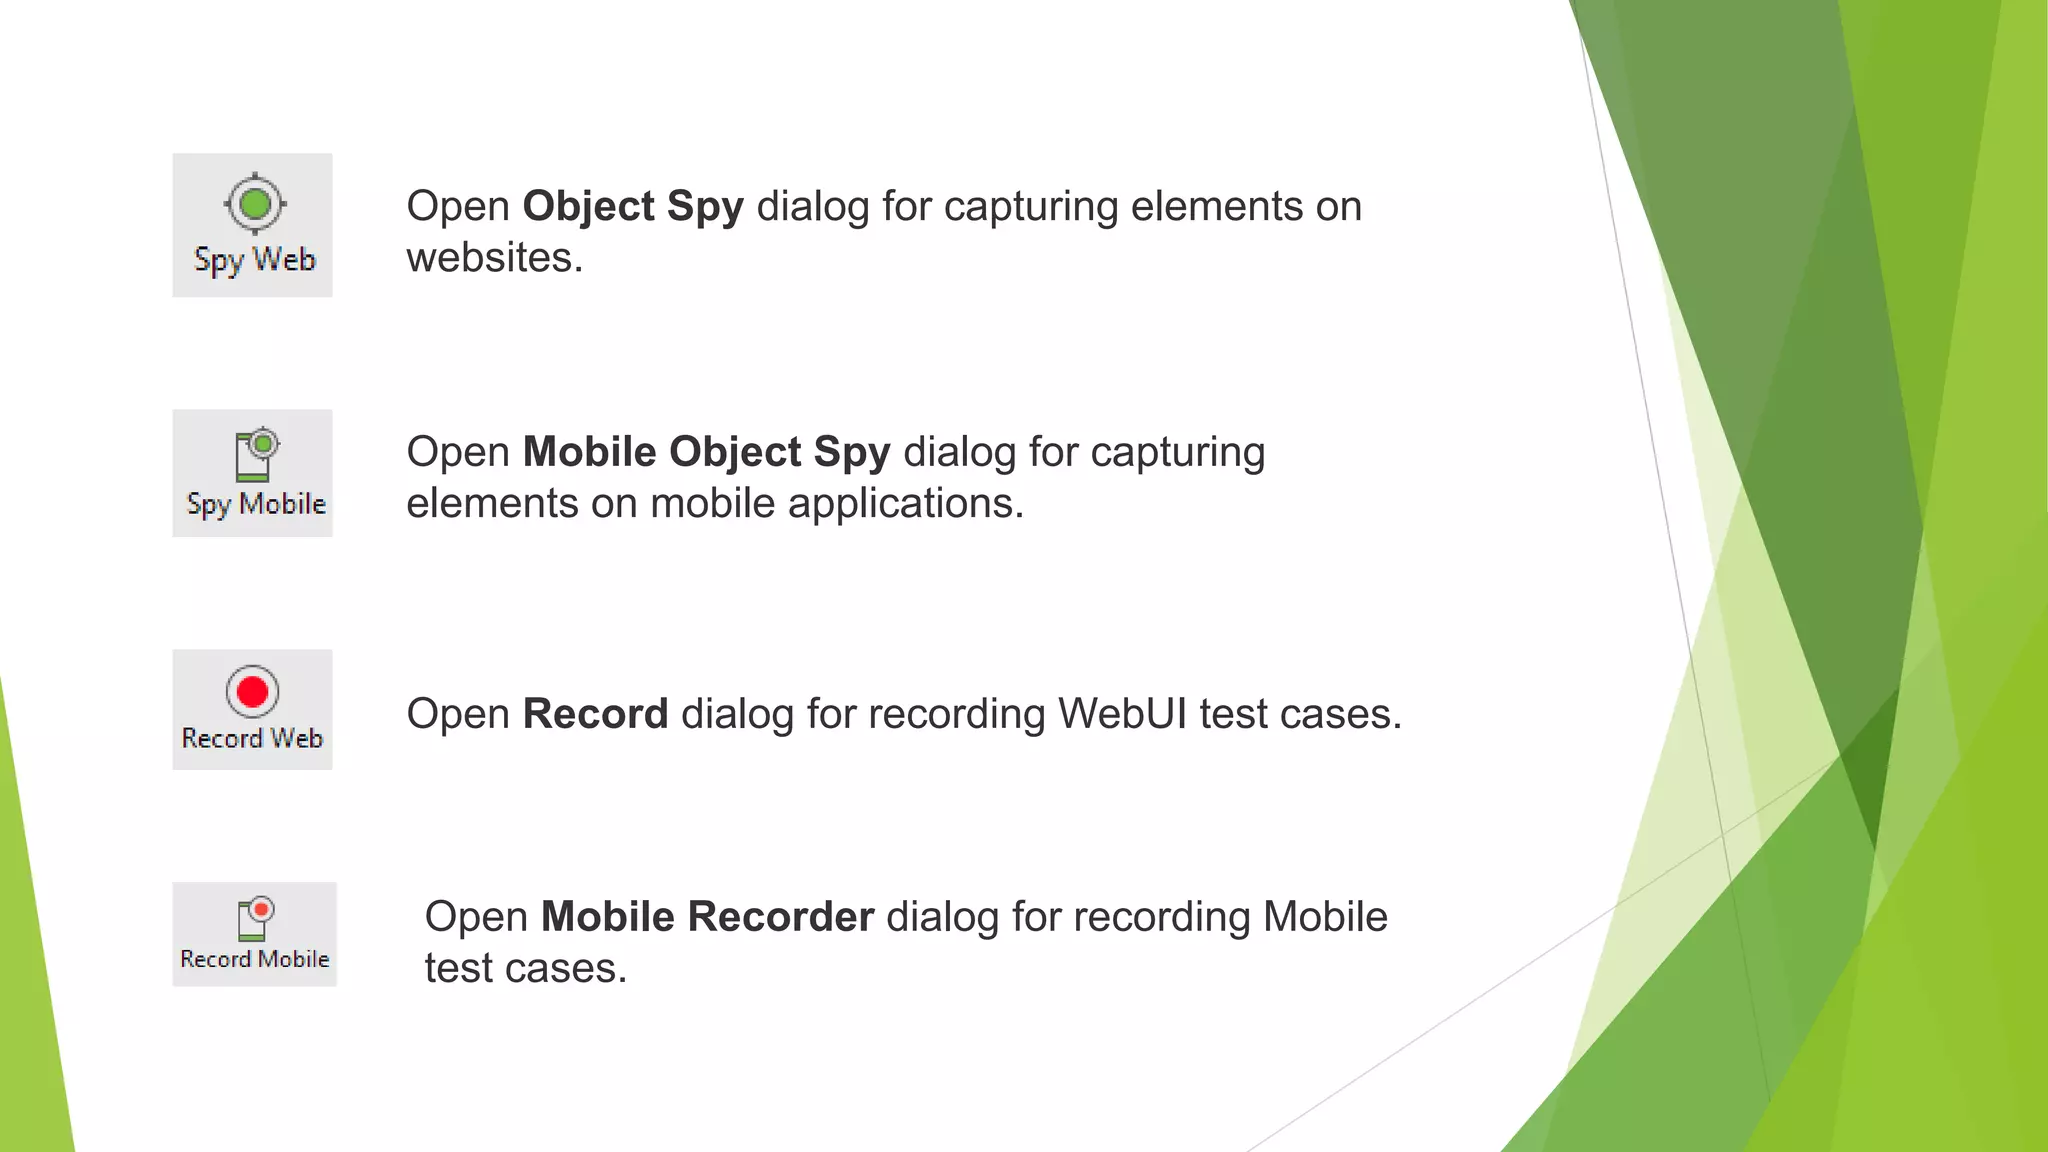
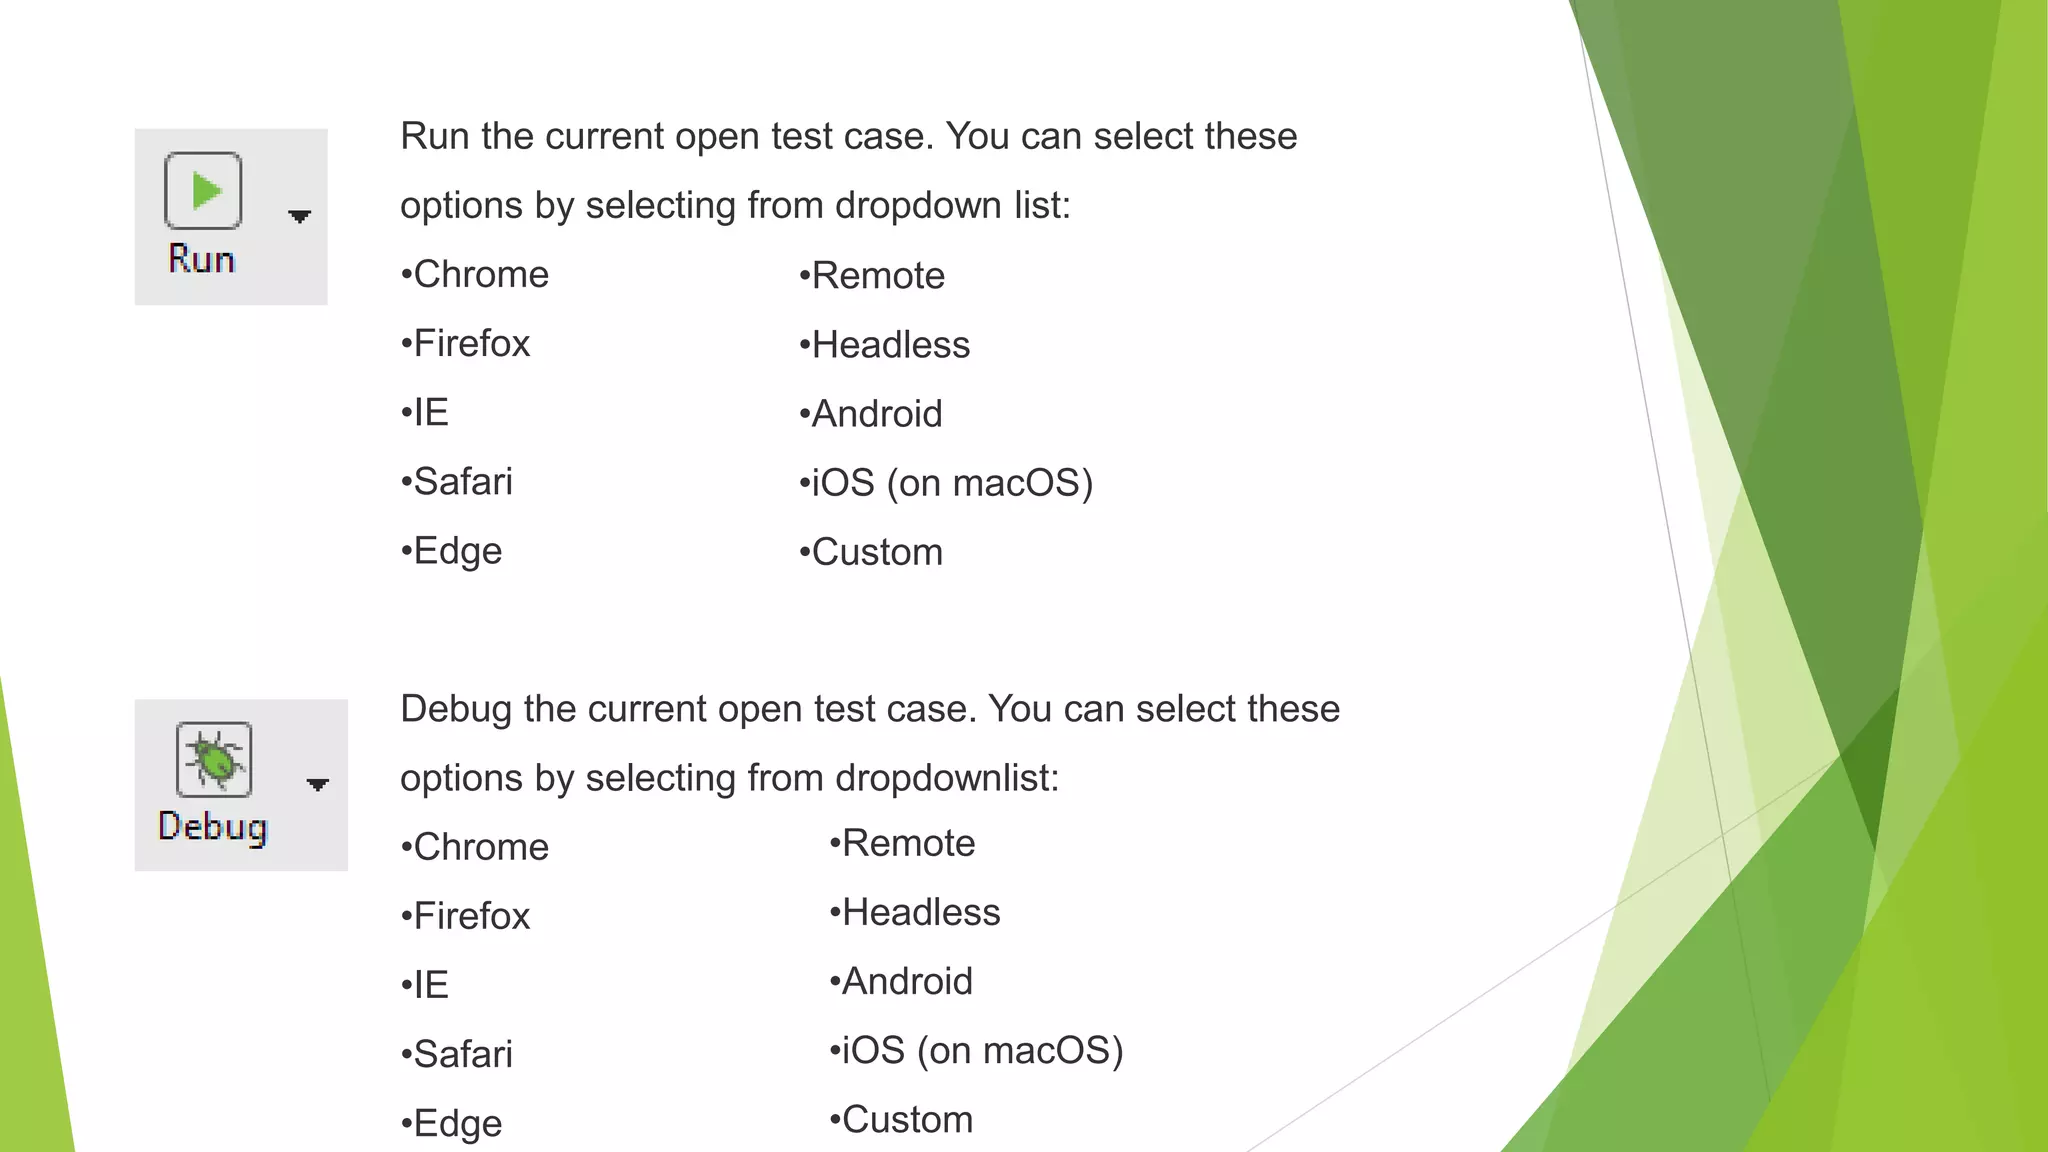
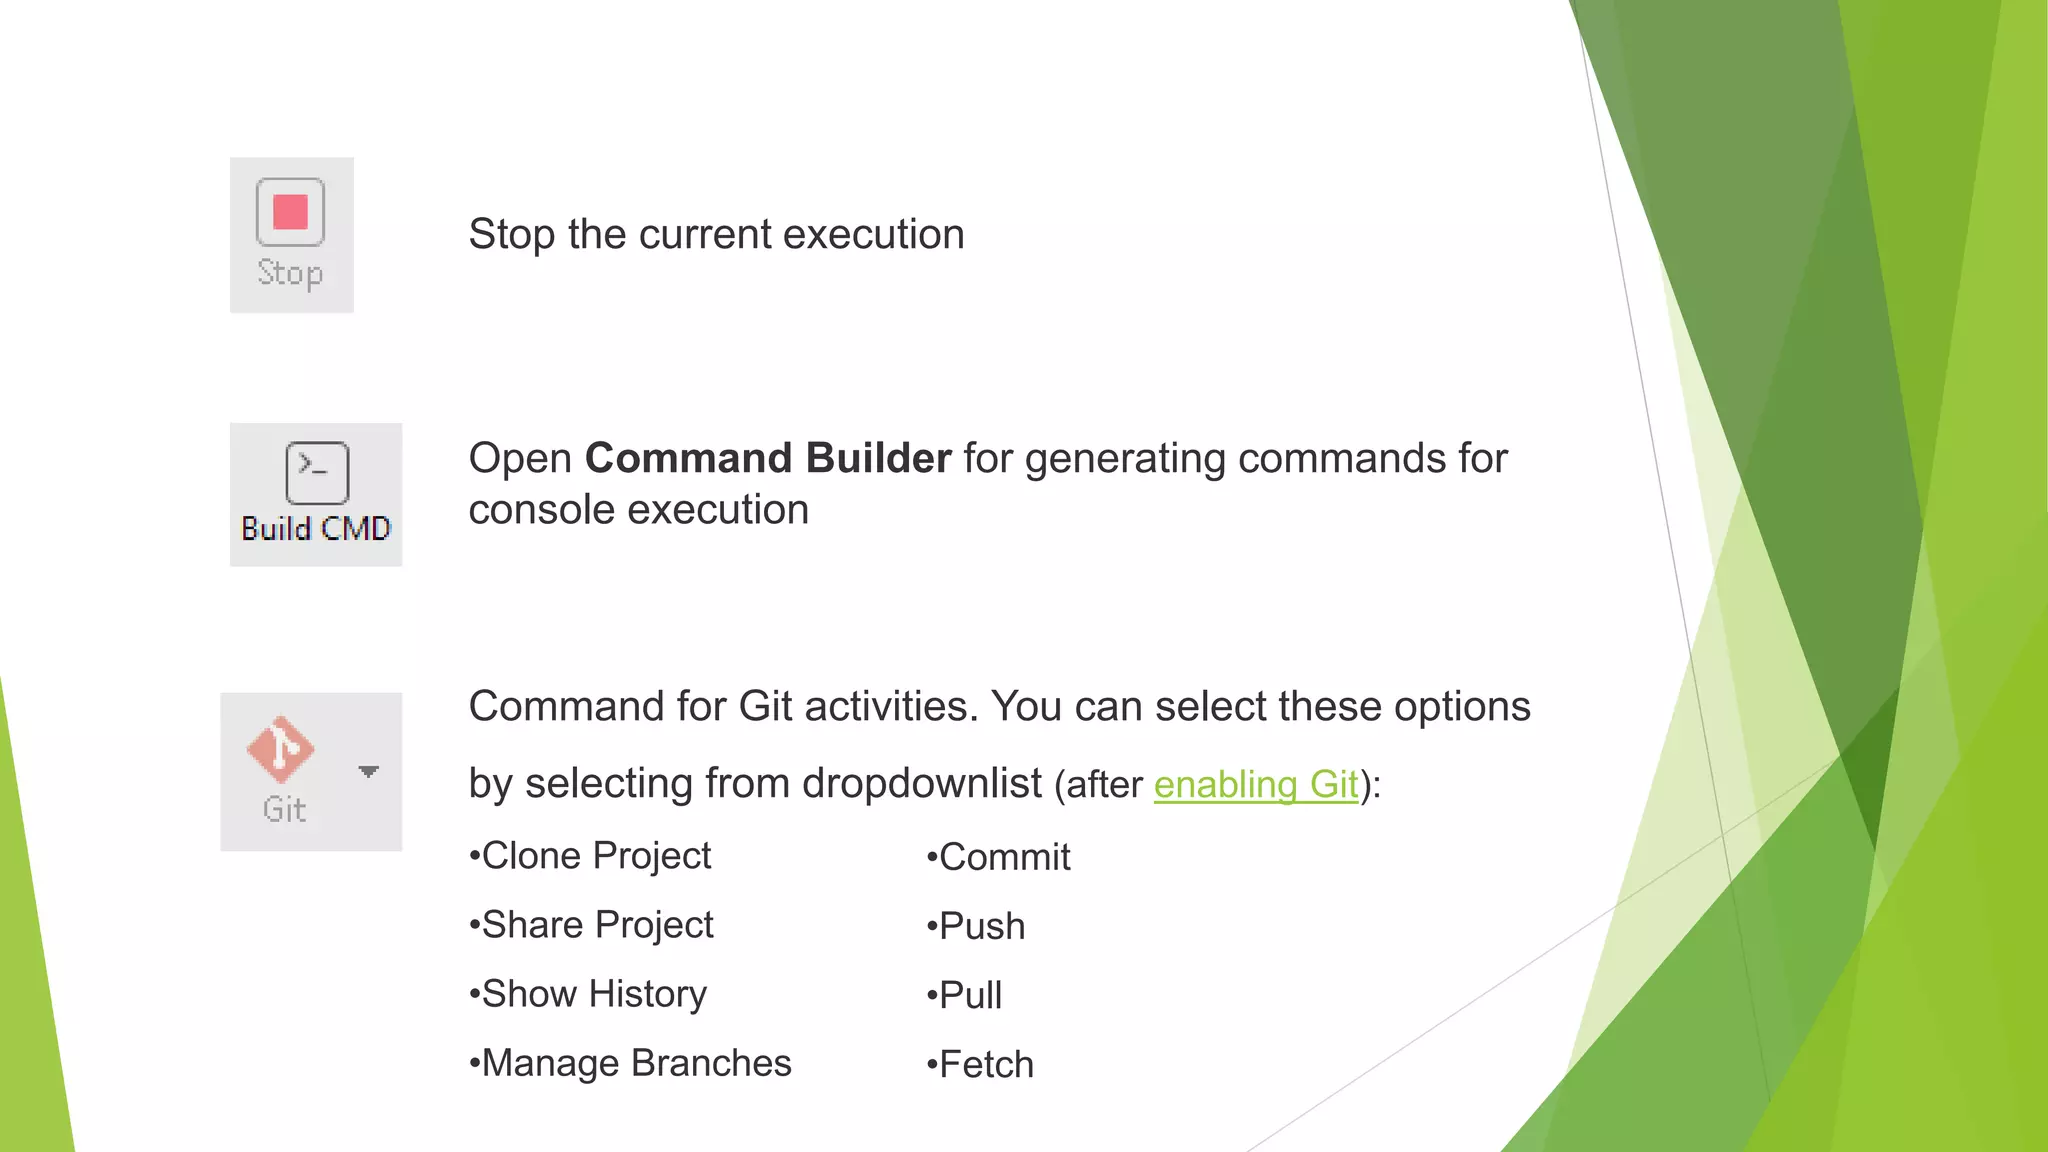
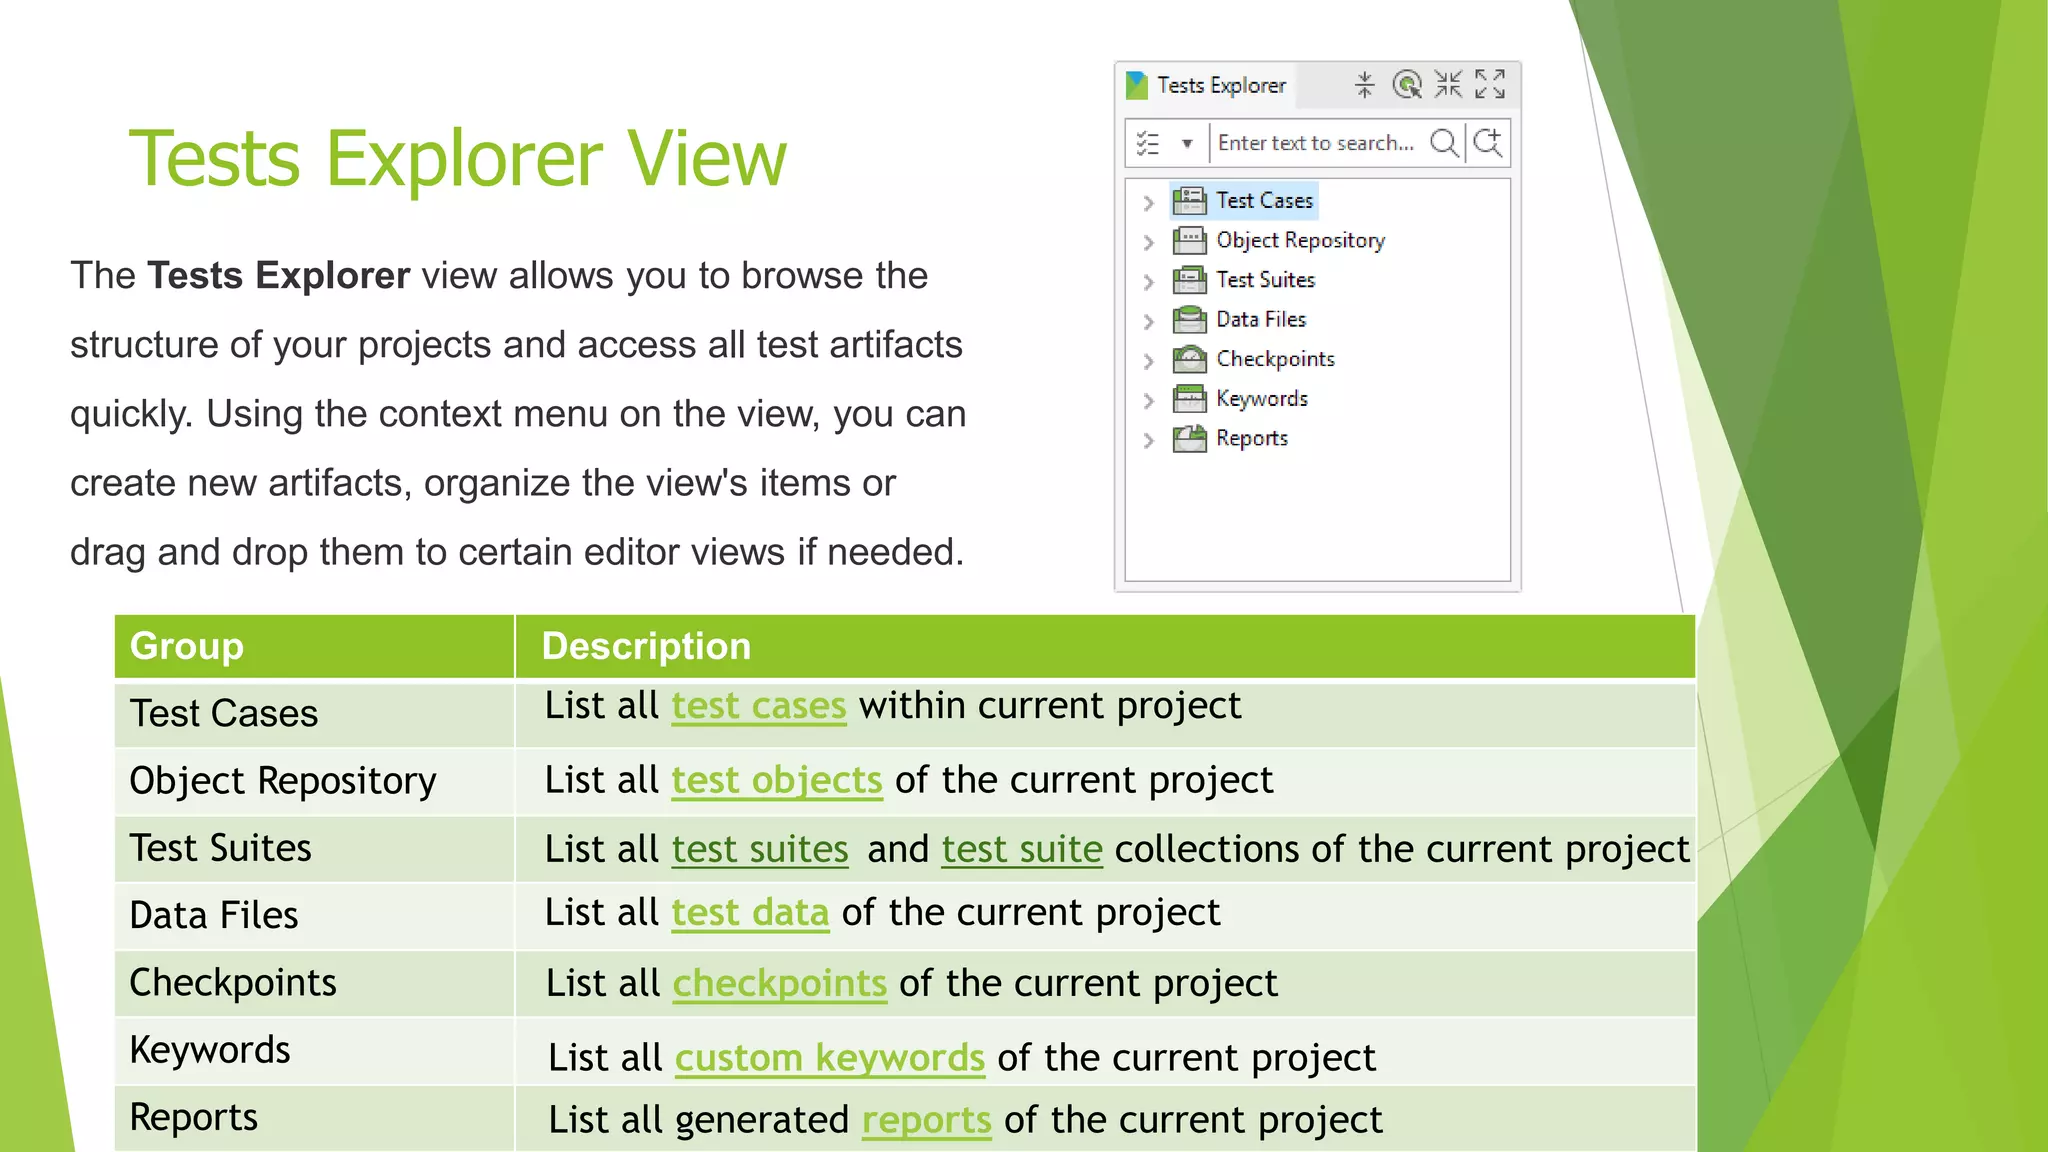
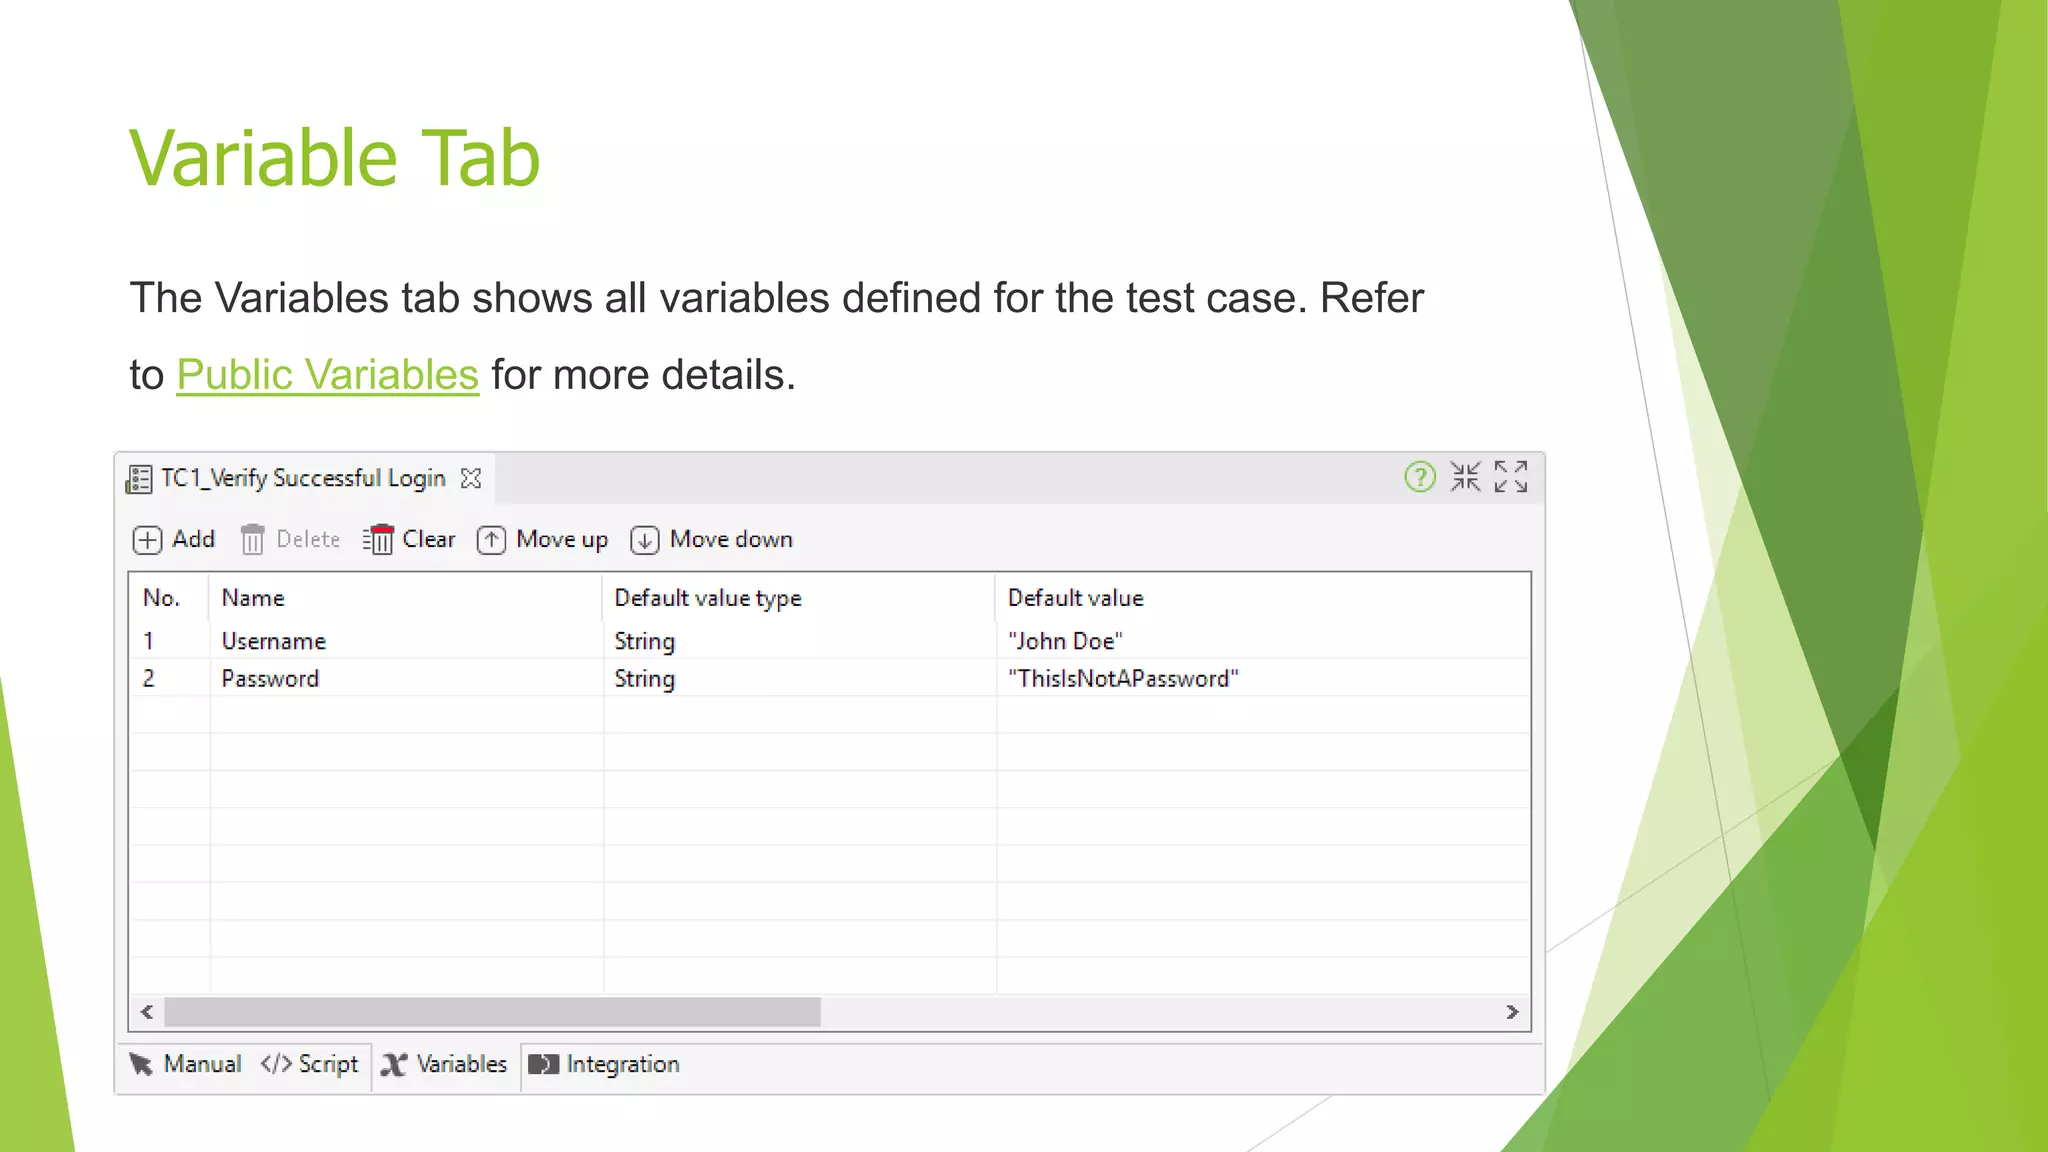
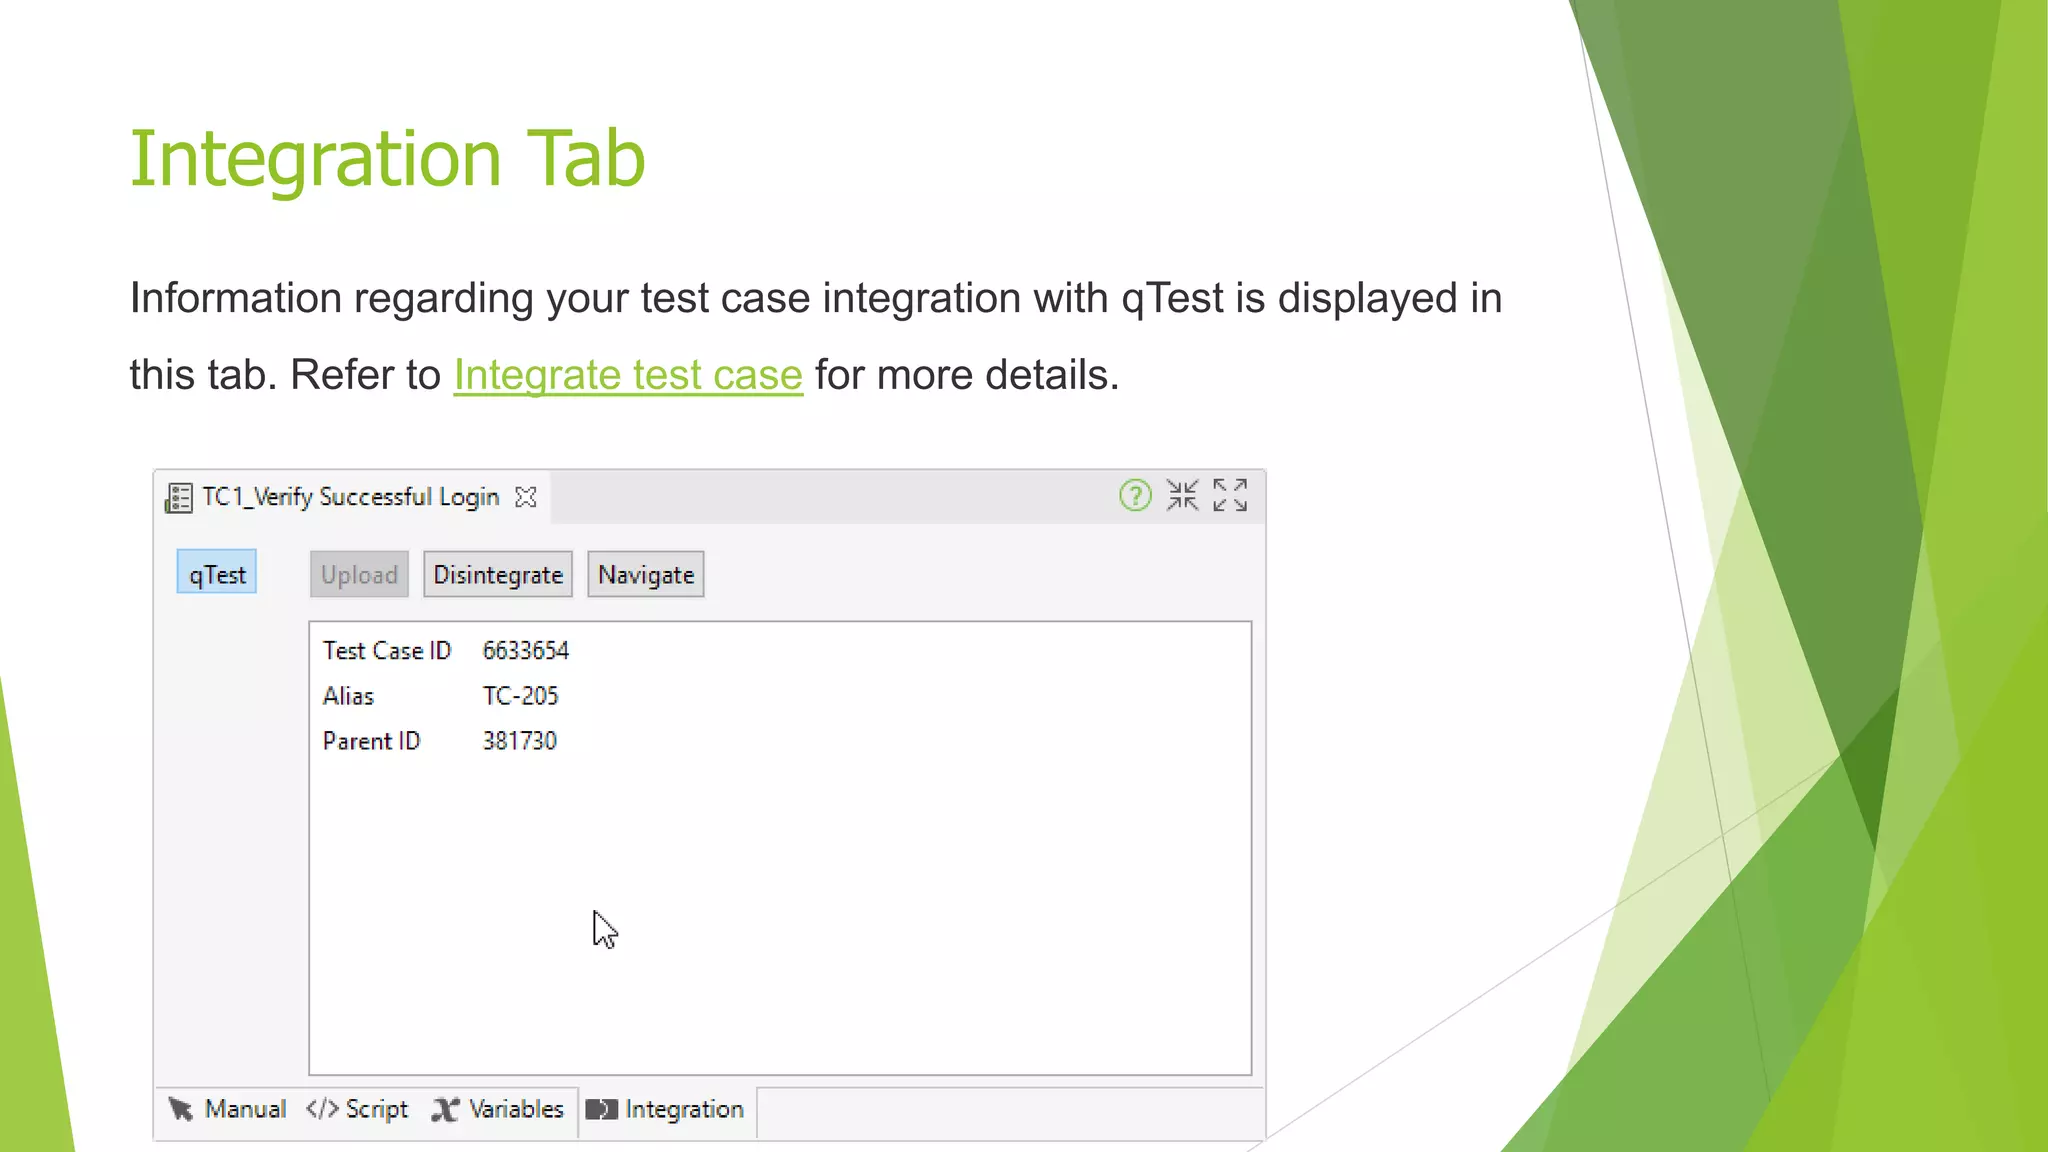
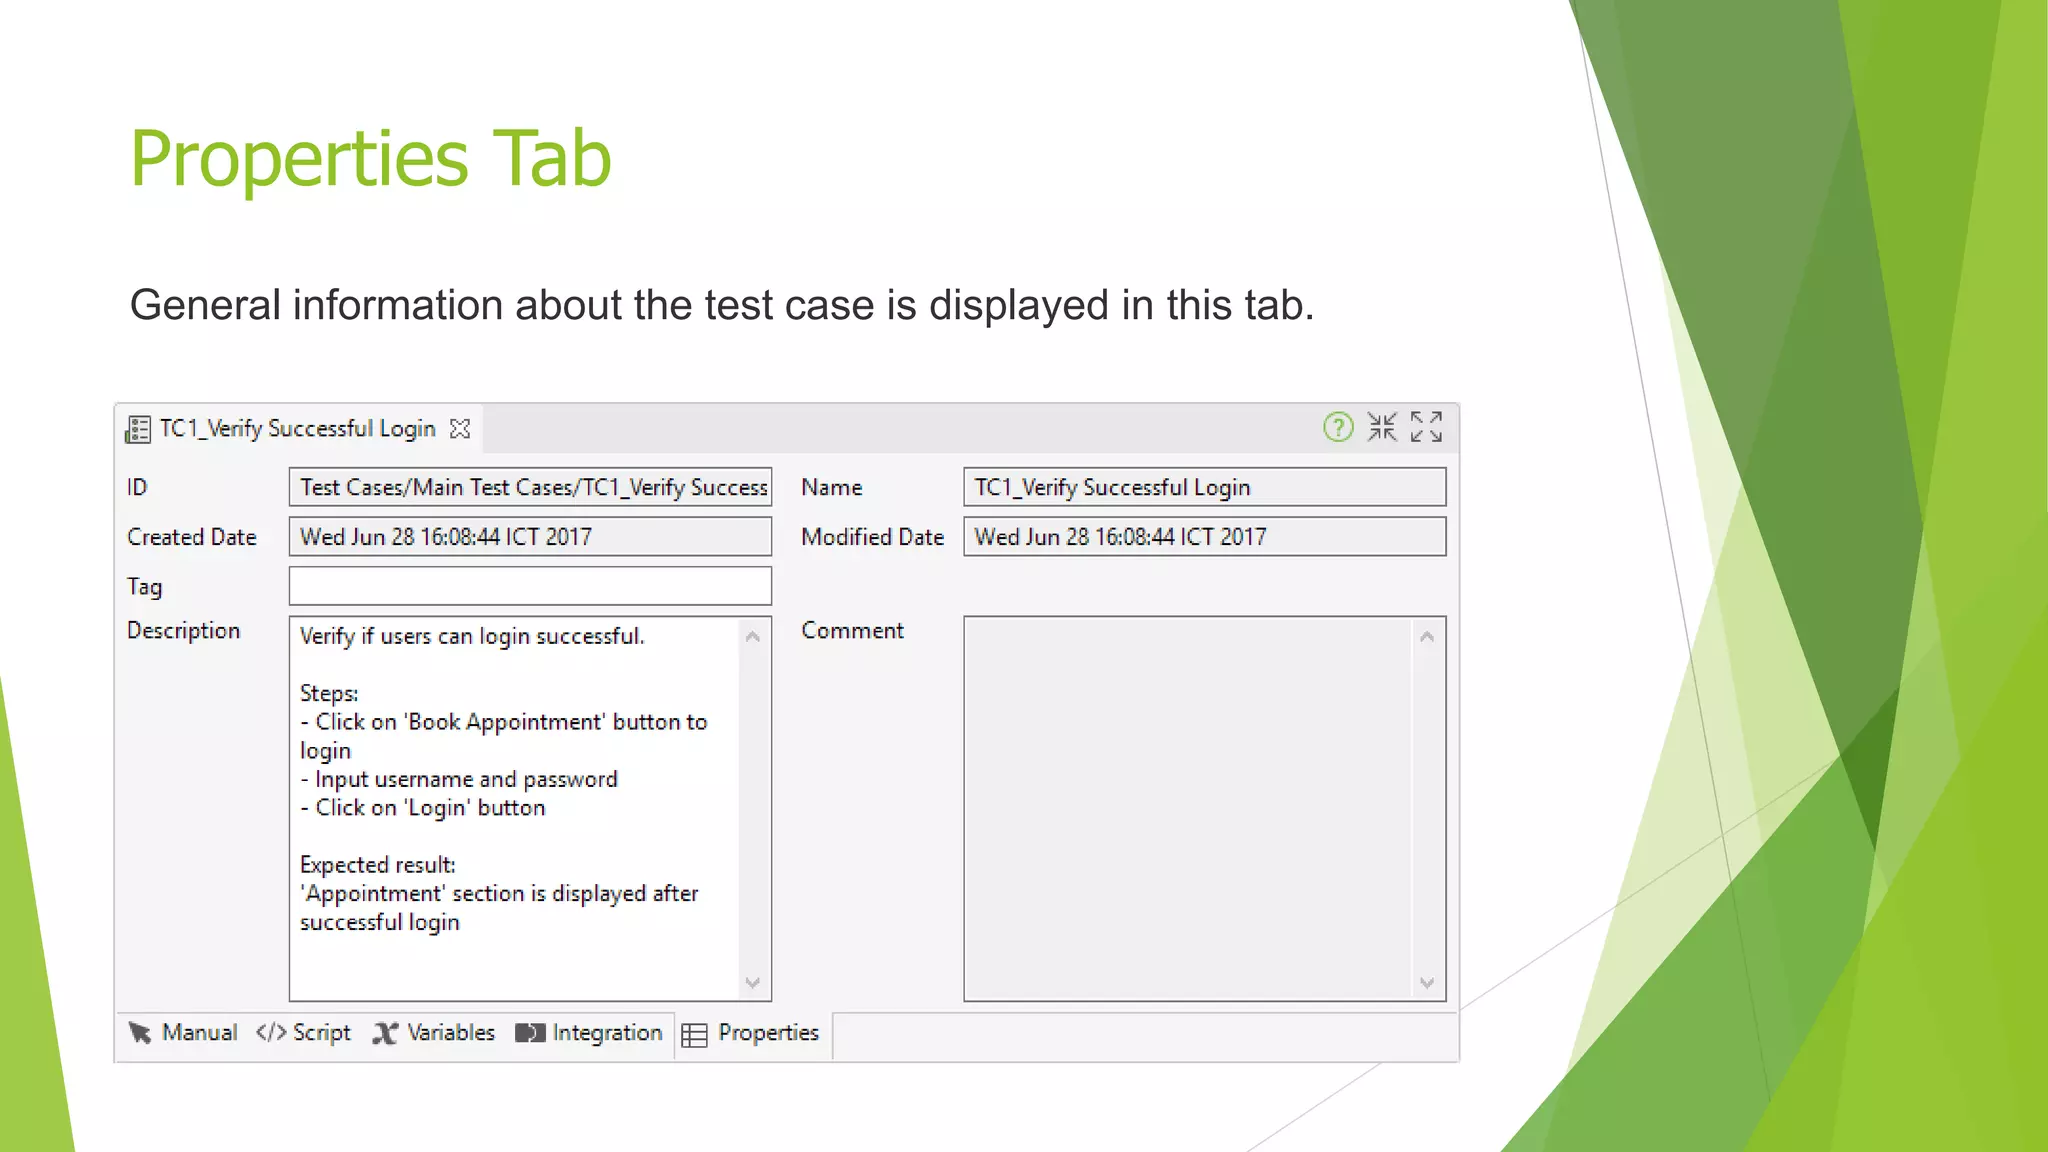
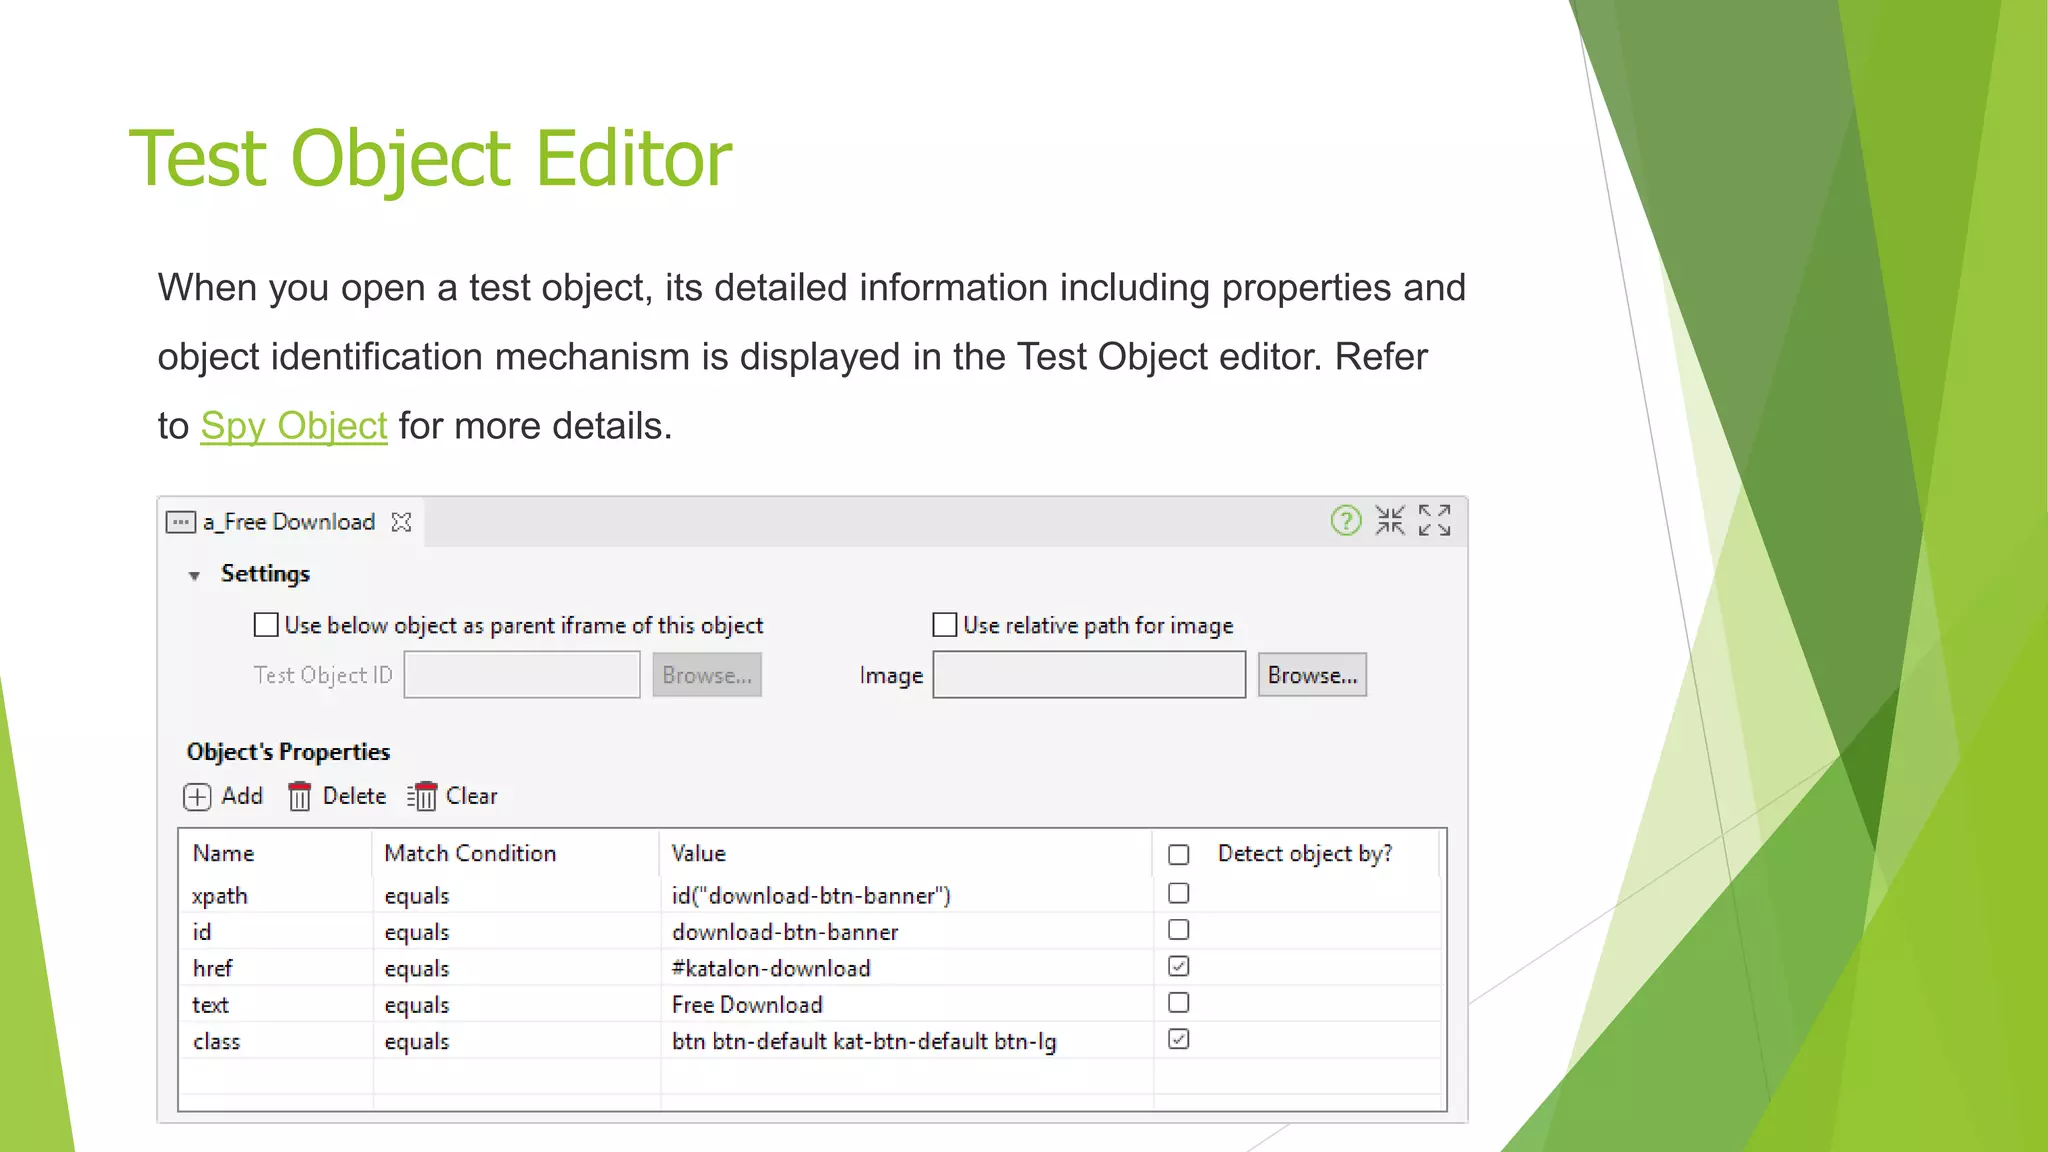
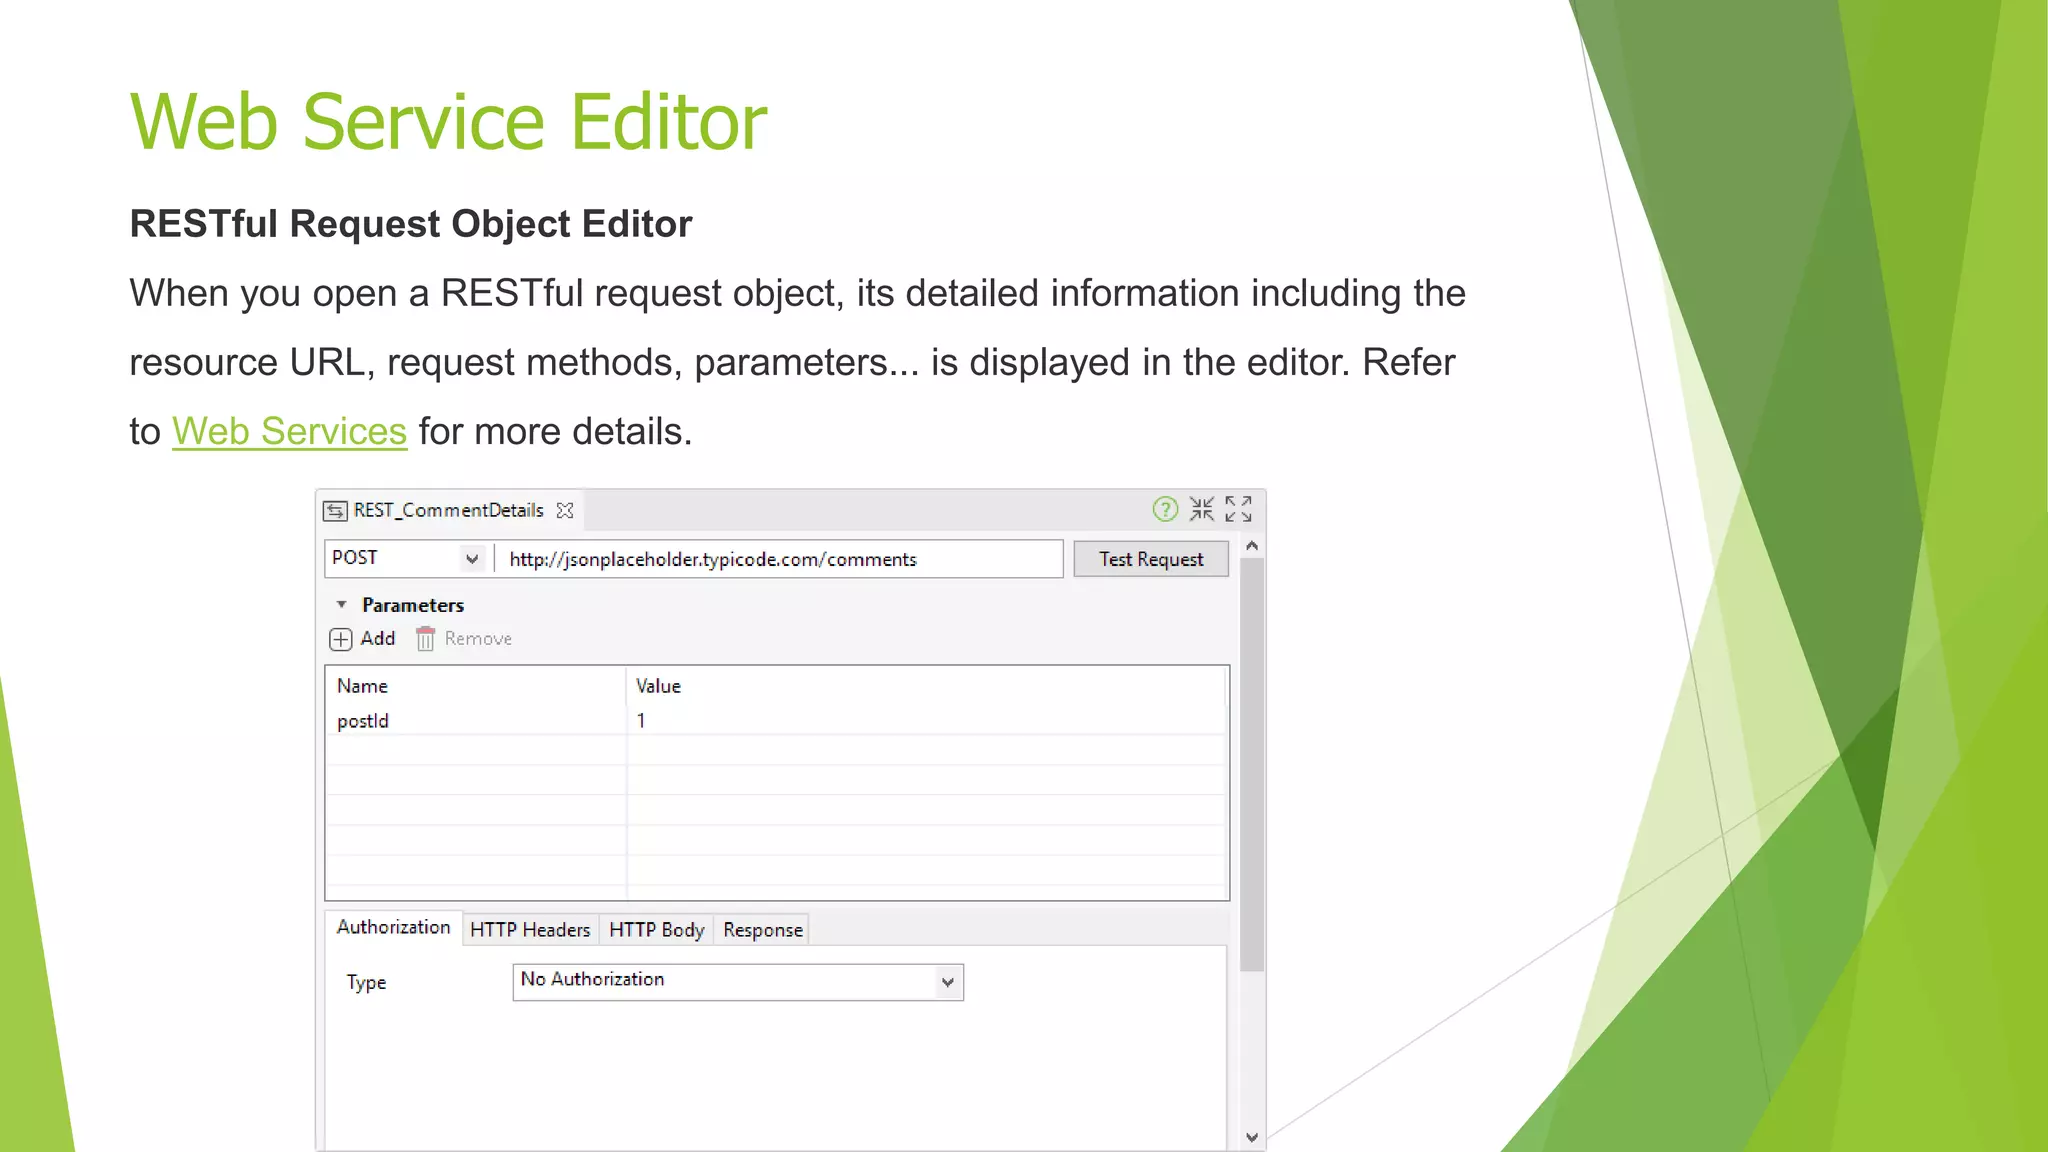
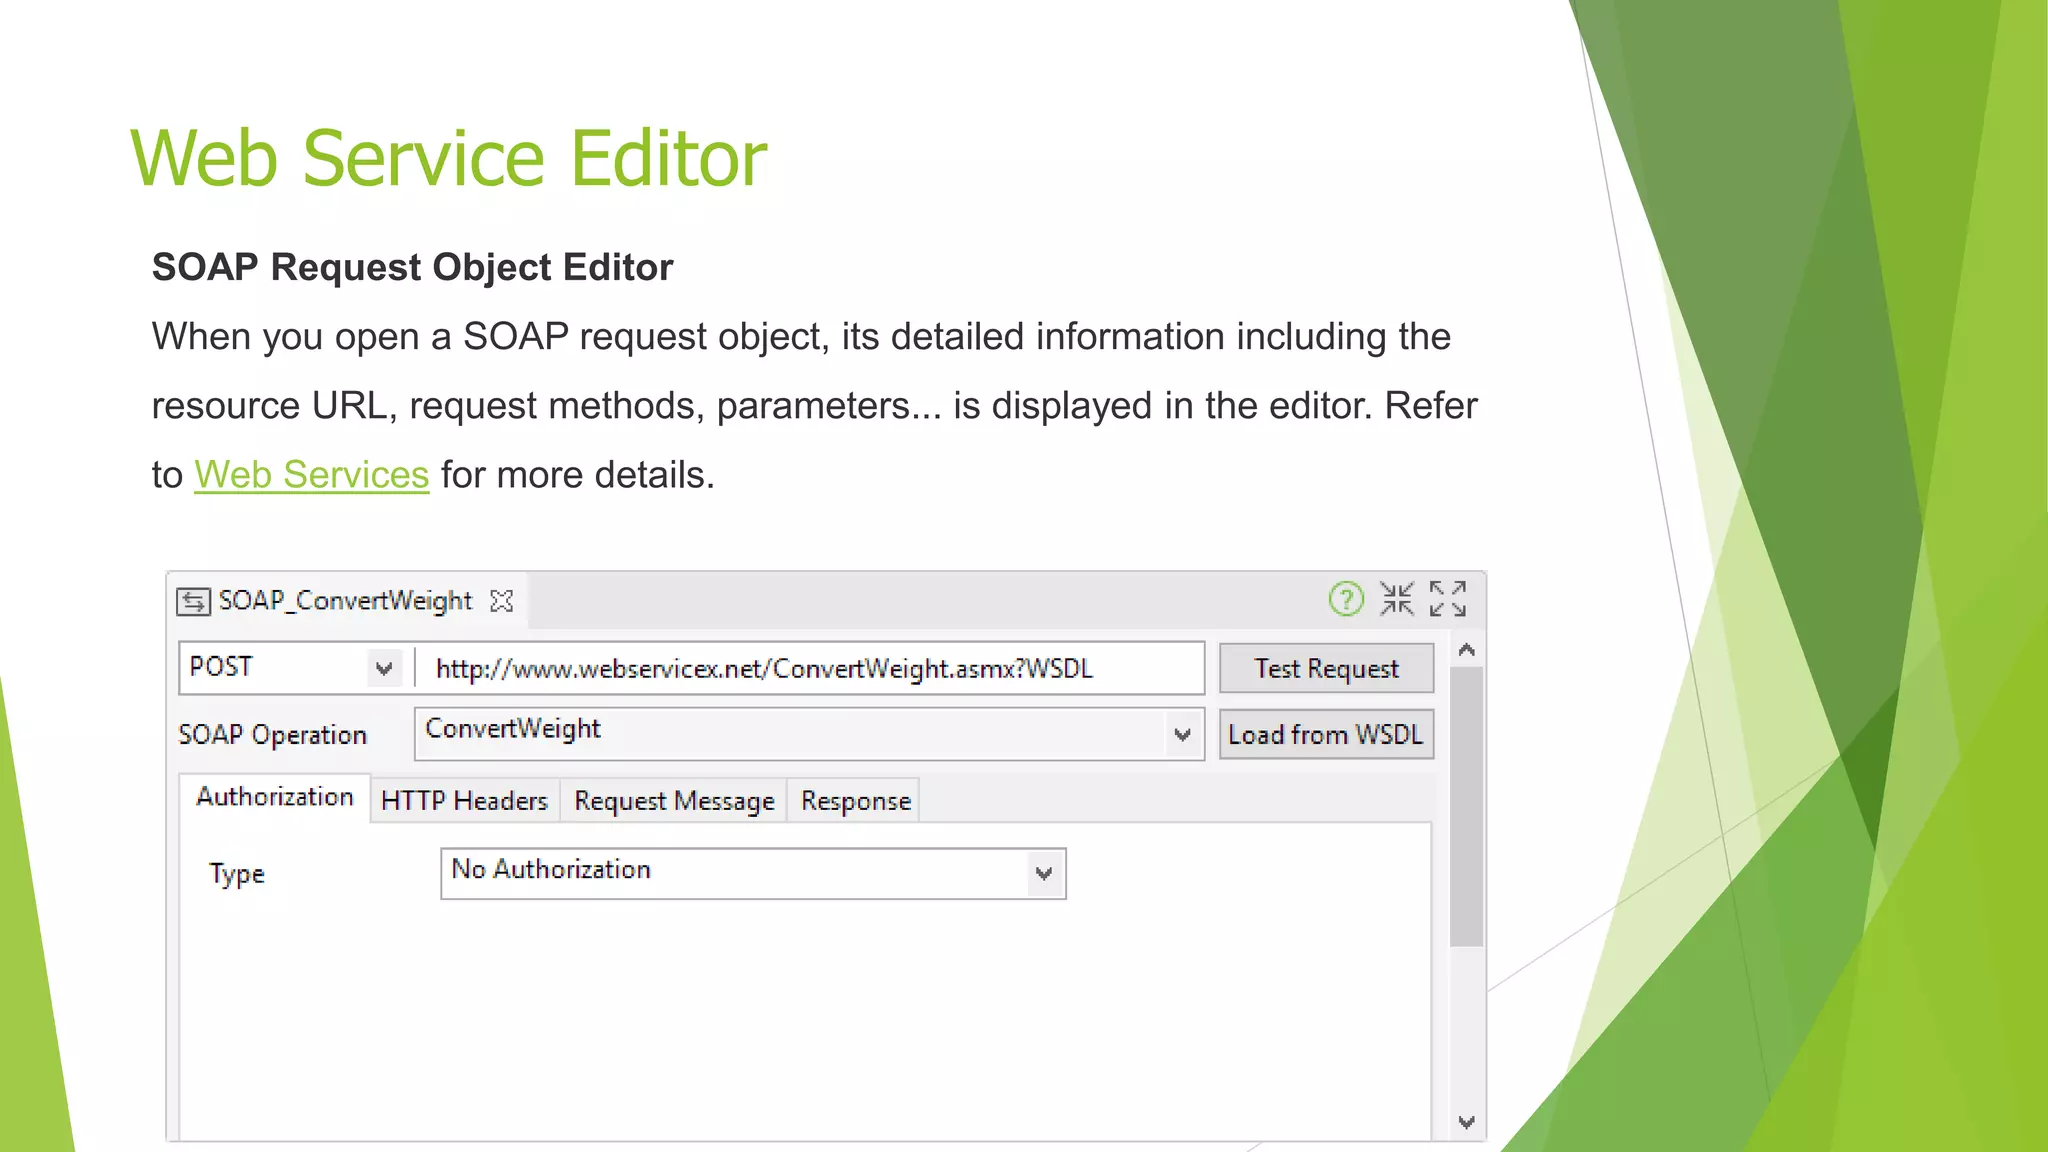
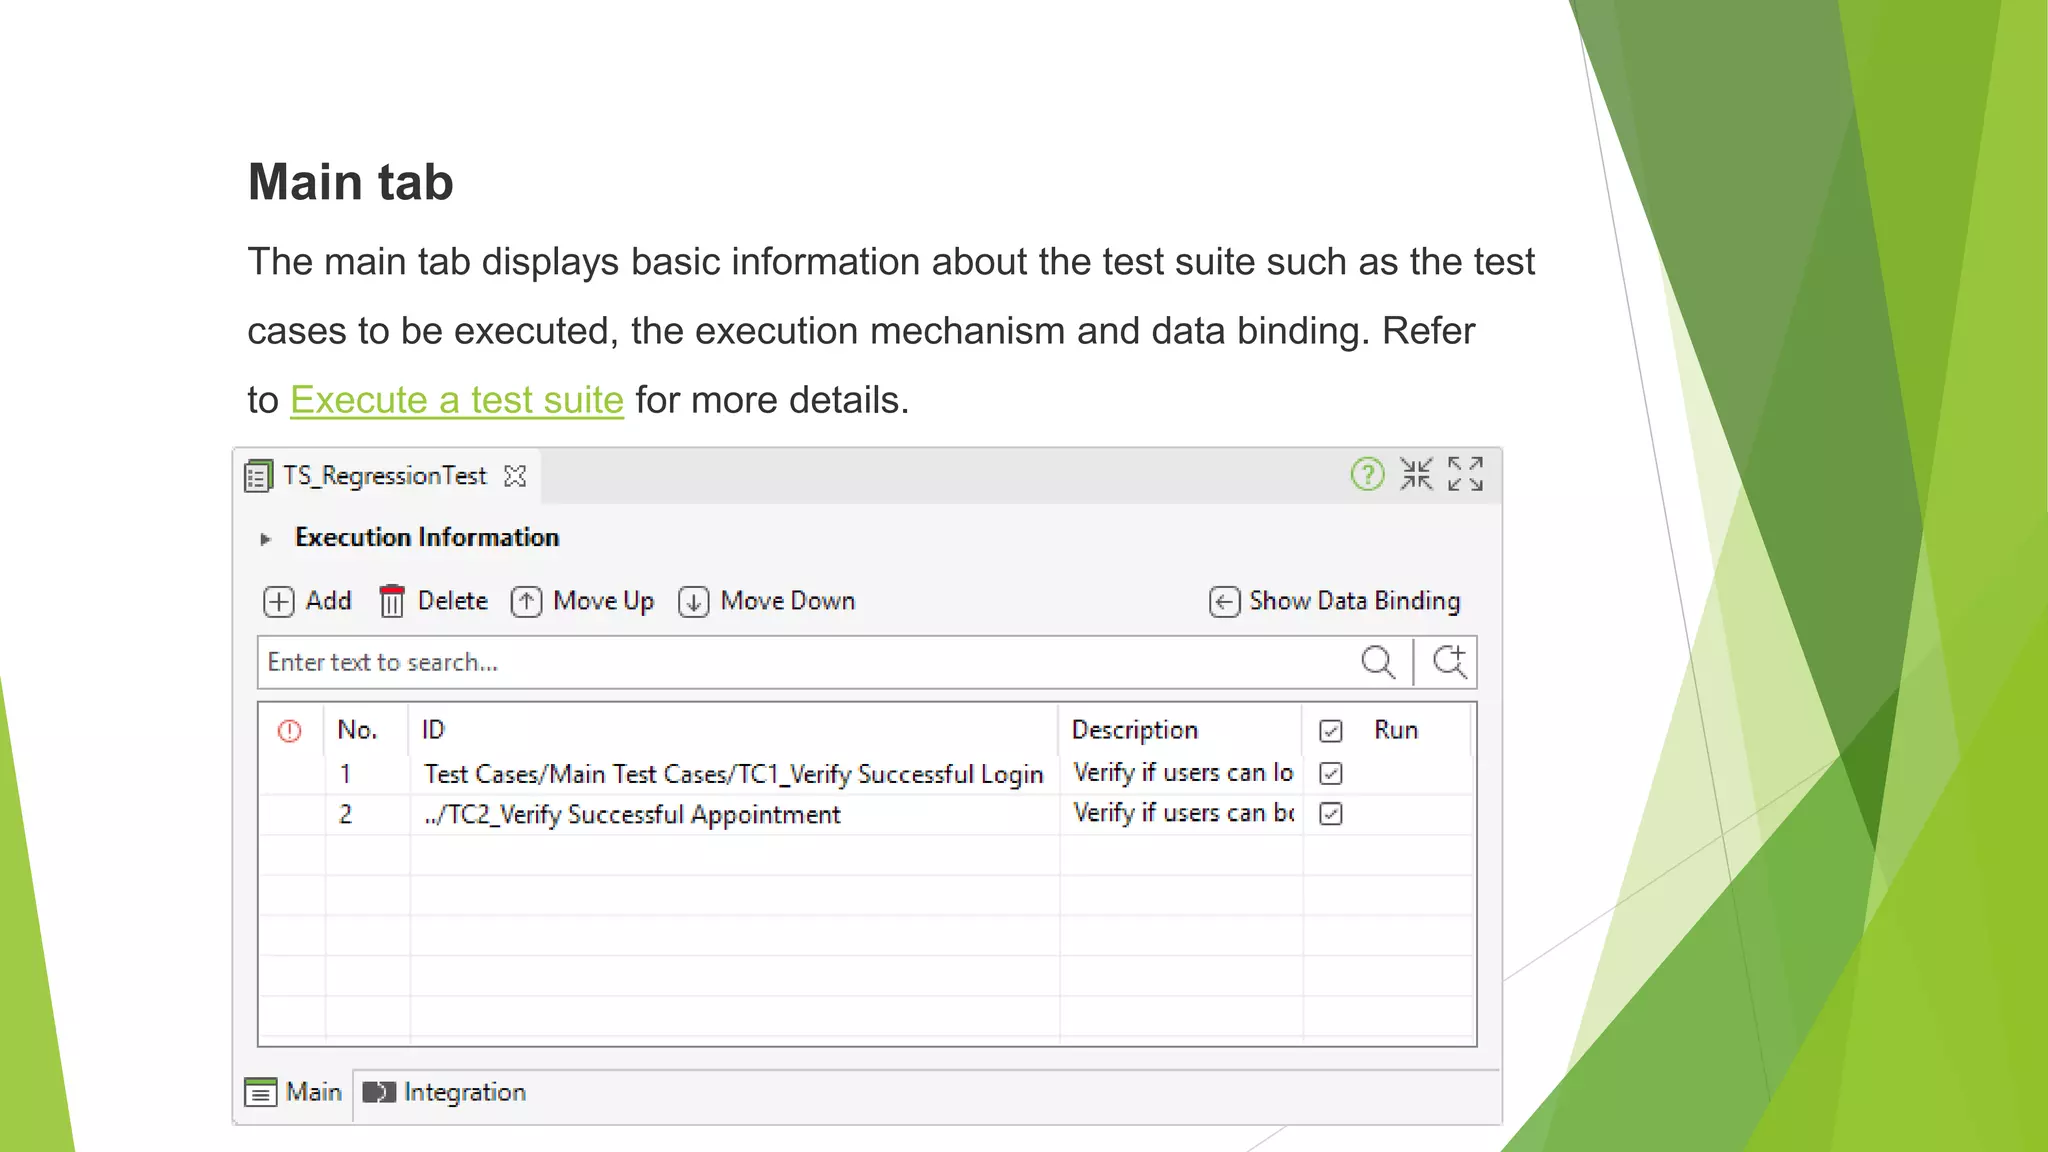


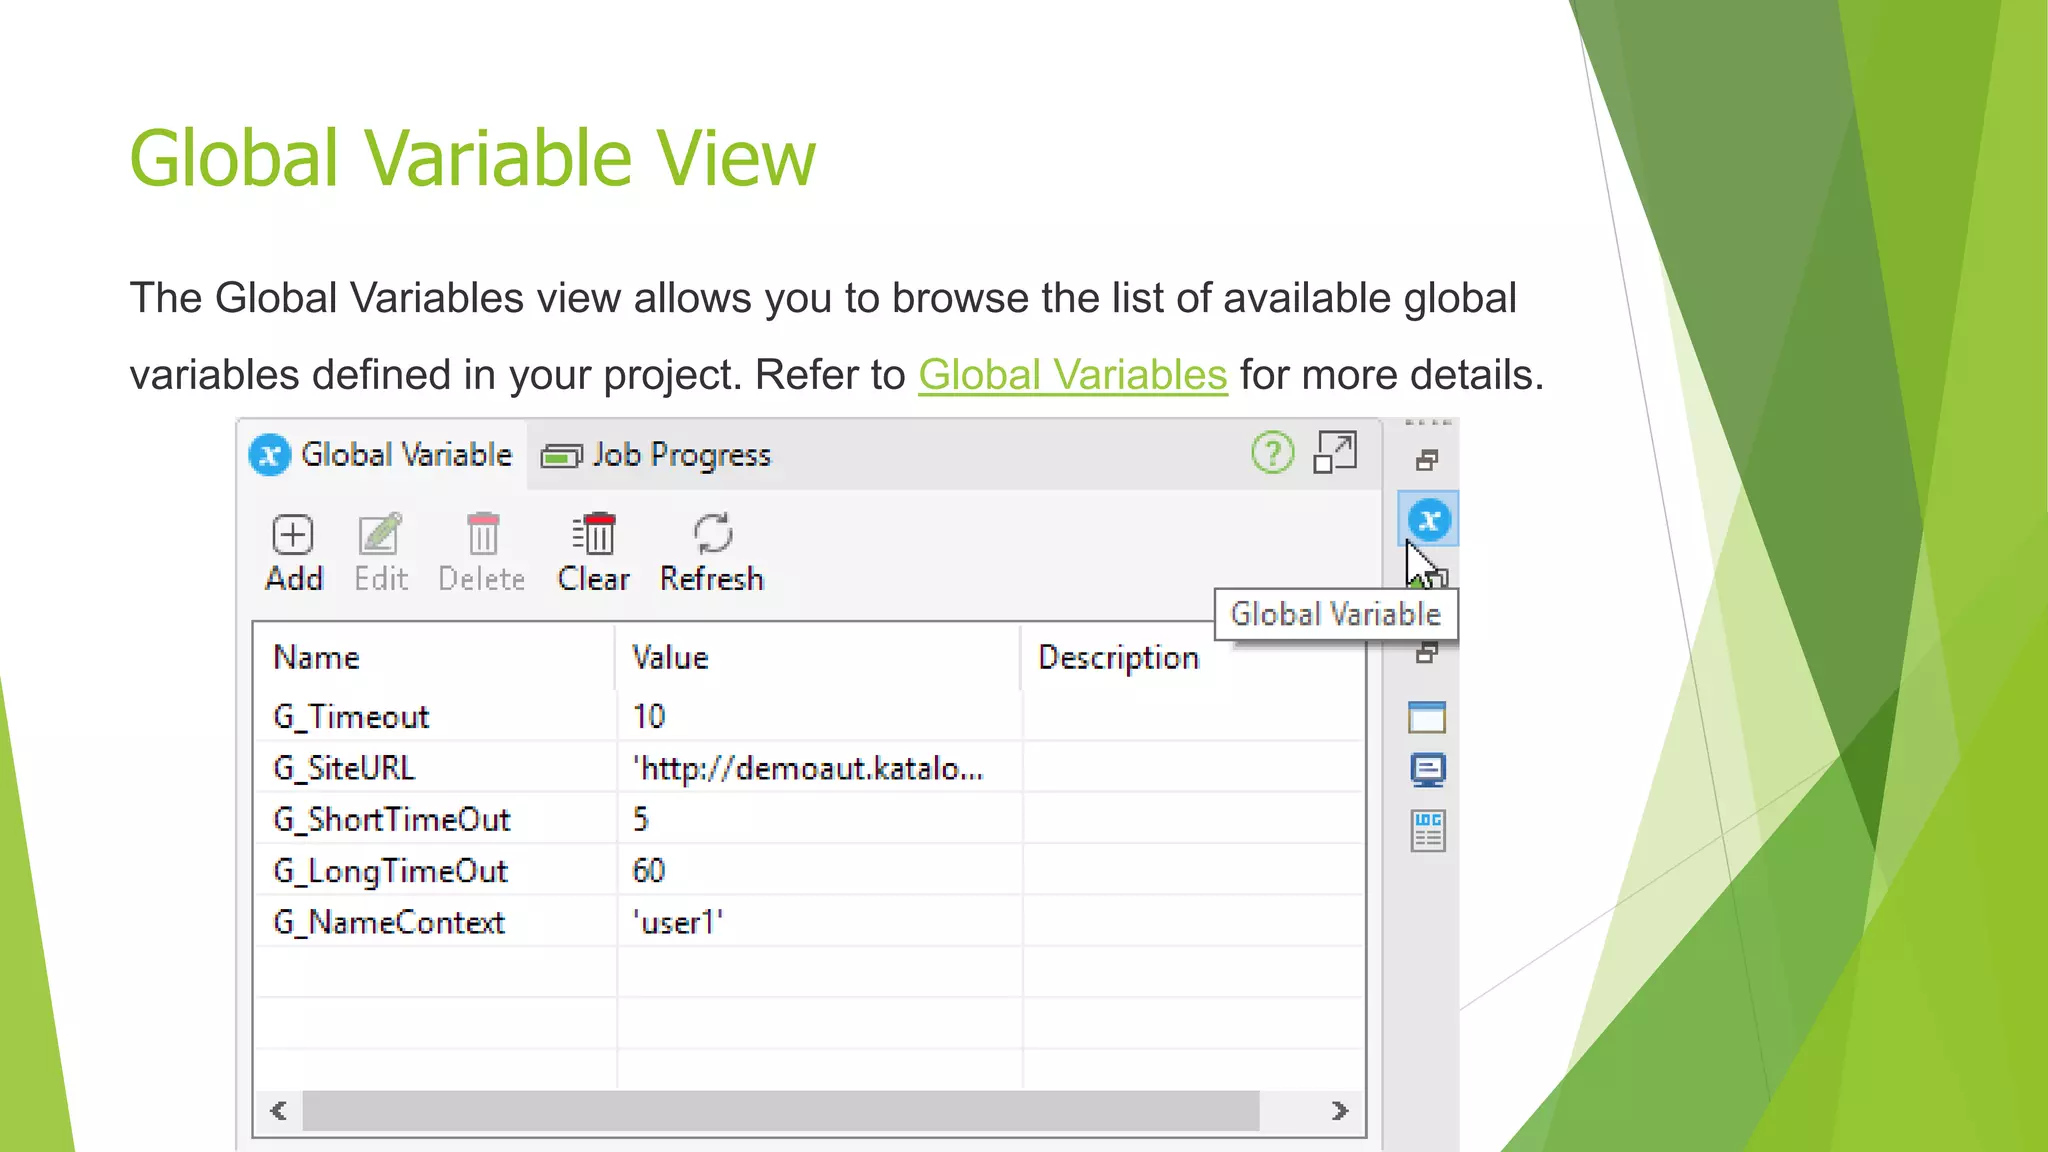
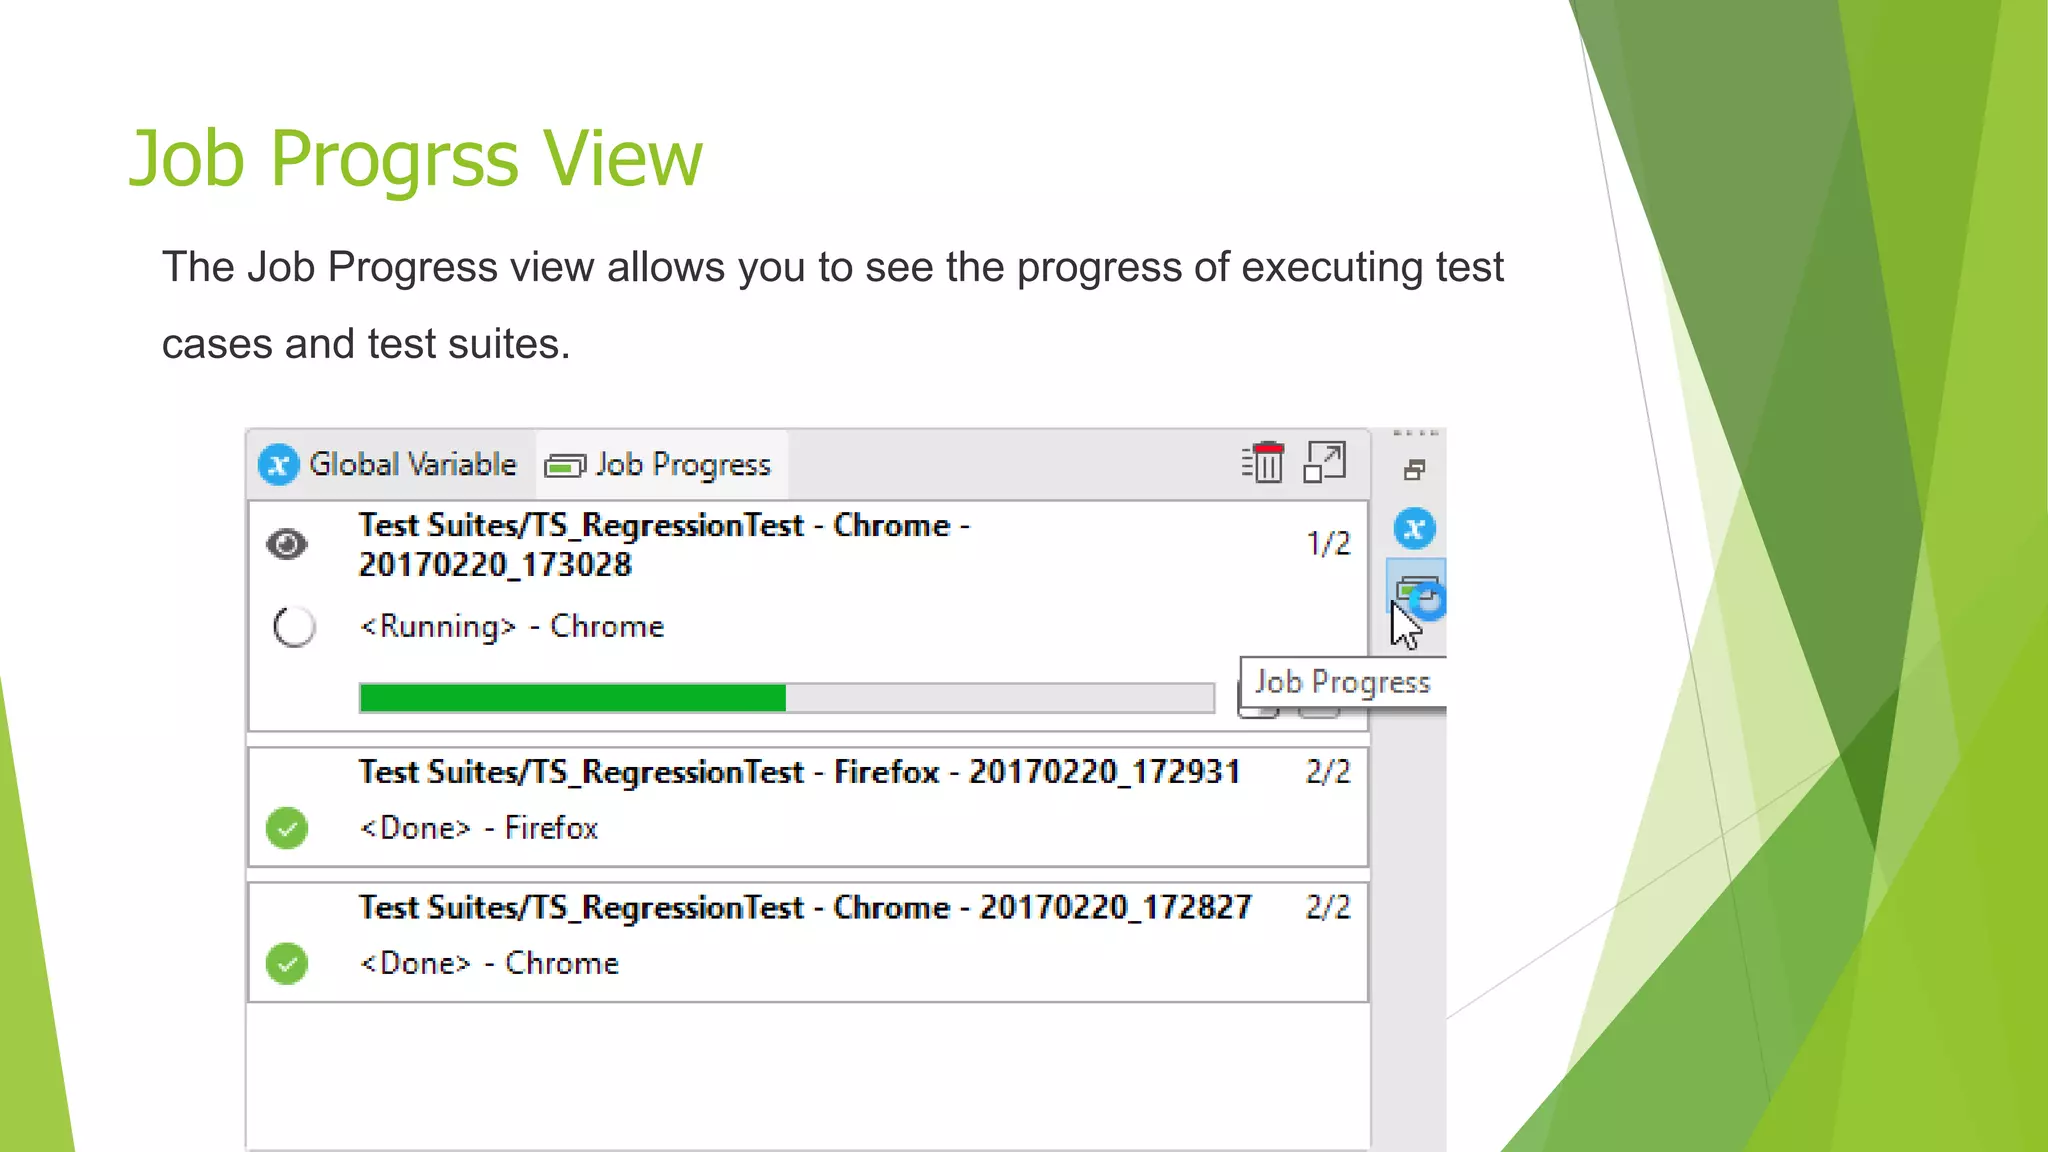


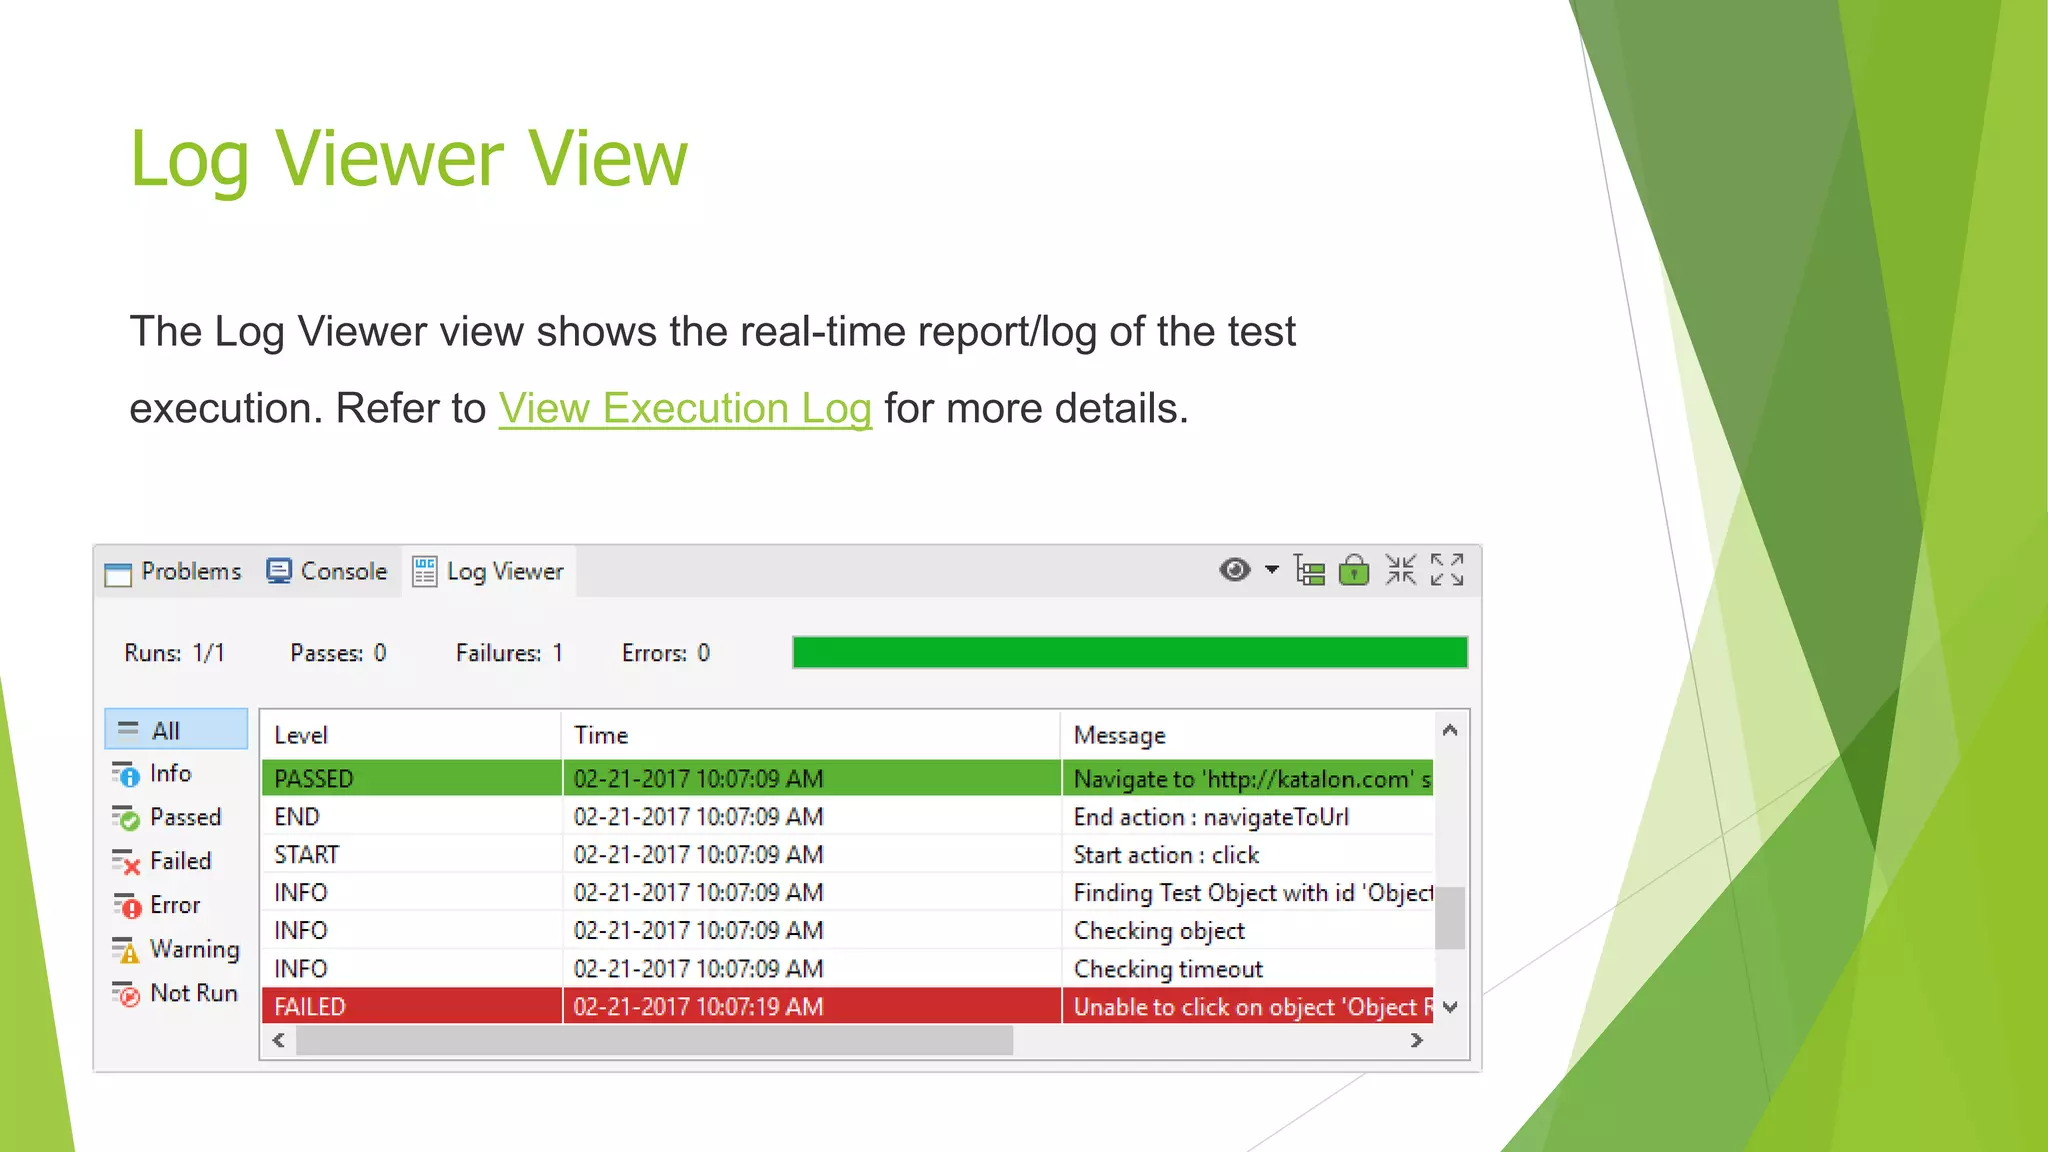


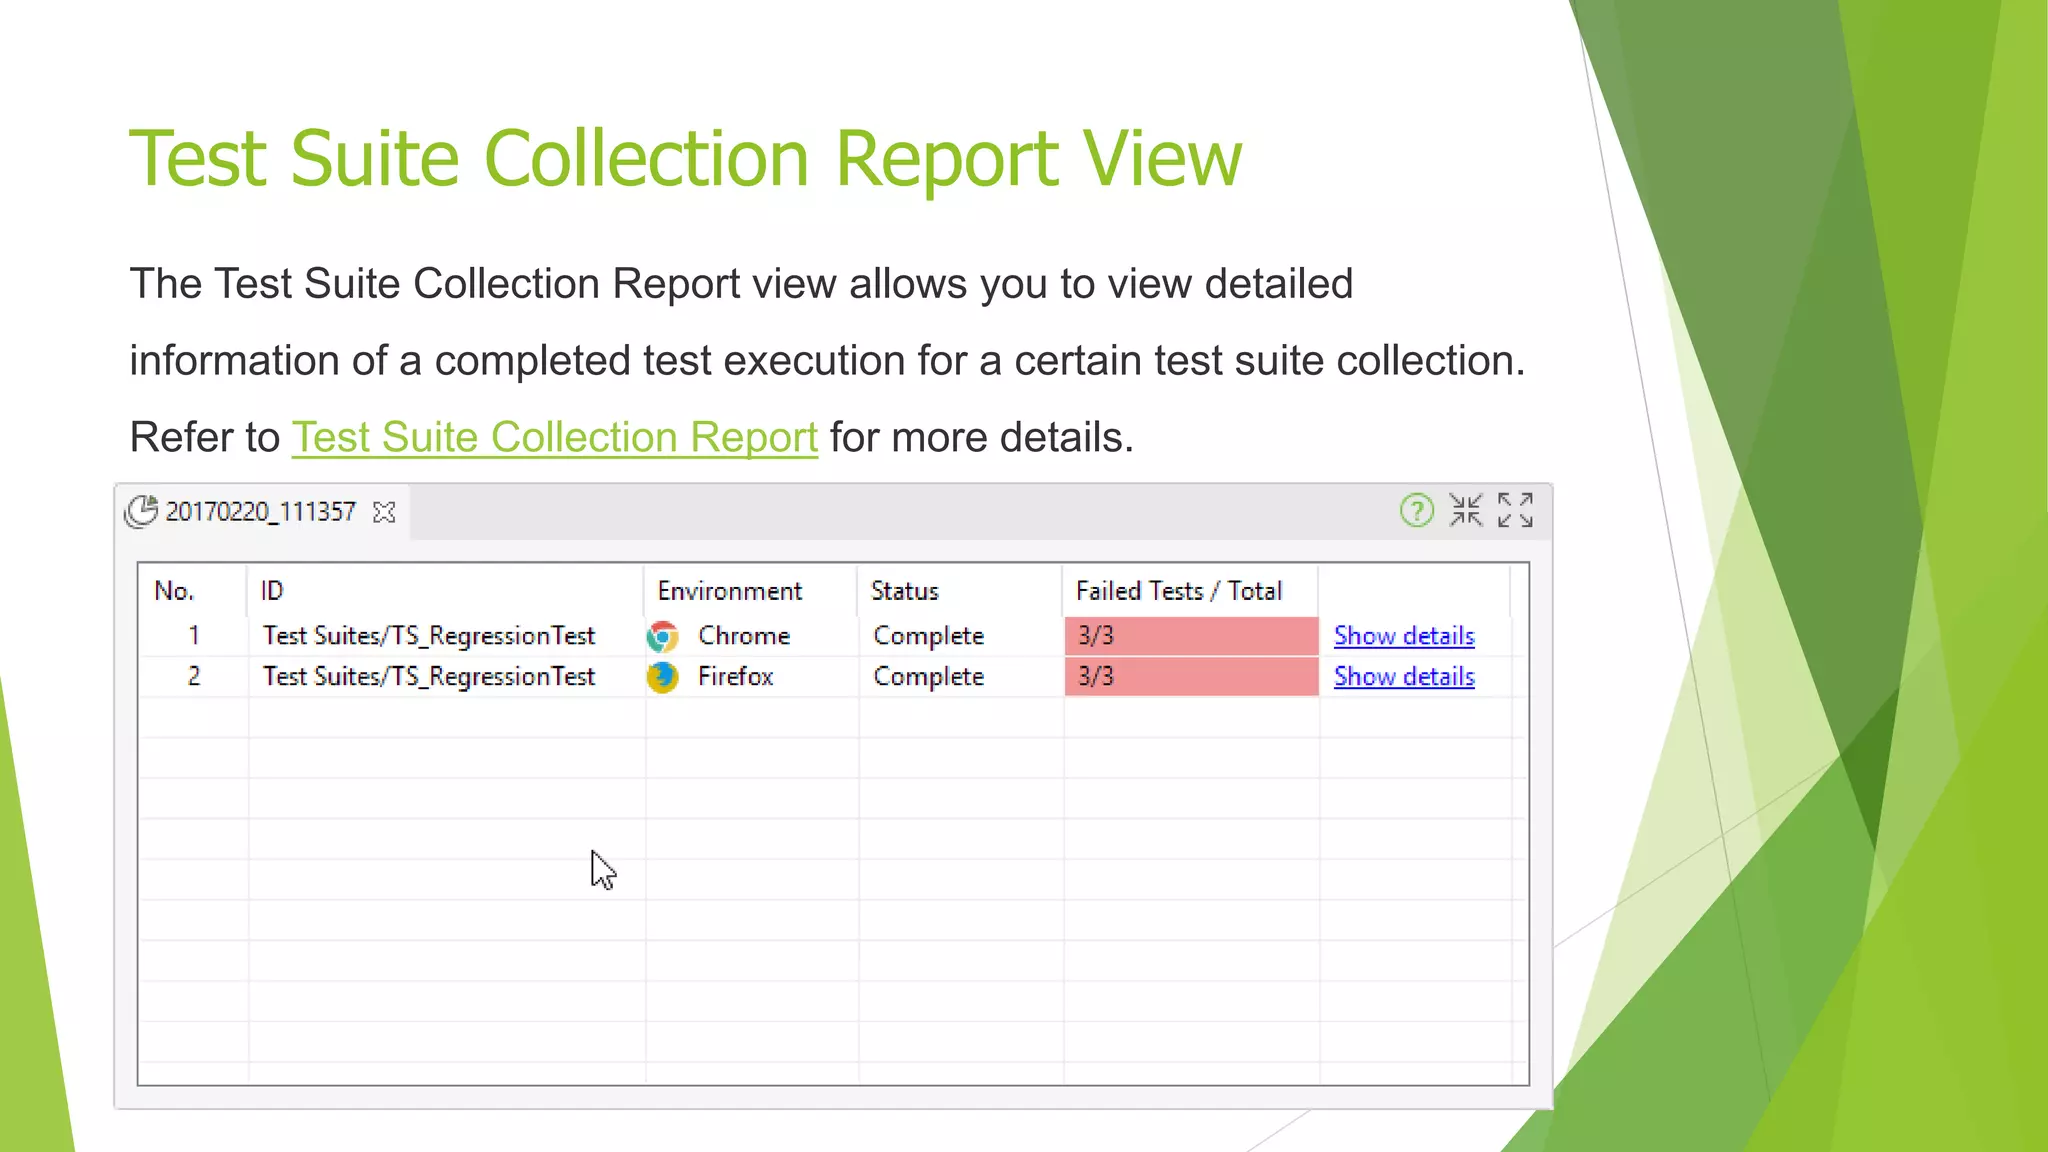

The document provides an overview of the Katalon Studio GUI, detailing the main toolbar, test explorer view, editor types, and the different functionalities available like creating and managing test artifacts, executing tests, and monitoring progress. It outlines the features of various editors such as test case editors and object editors, enumerating the tabs and functionalities within each. Additionally, it describes the views available in Katalon Studio for managing global variables, job progress, error messages, and execution logs.