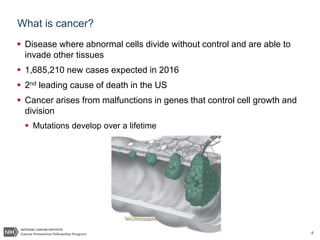
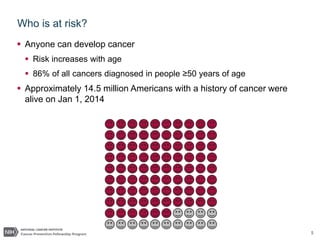
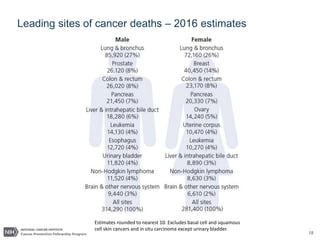
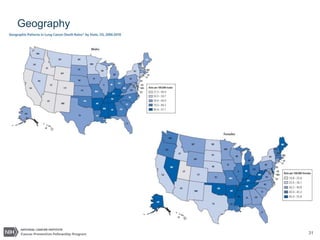
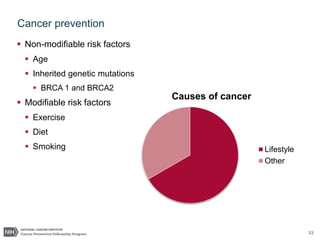
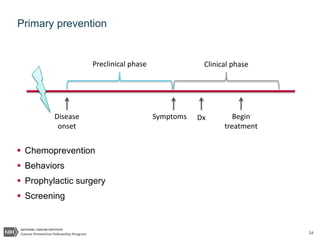
VIP Kolkata Call Girl New Town 👉 8250192130 Available With Room
KaraCancer.pptx cancer epidemiology presentation
1. Cancer Epidemiology
Kara P. Wiseman, MPH, Phd
Tobacco Control Research Branch
Division of Cancer Control and Population Sciences
March 3, 2024
2. 2
1. What is cancer
2. Cancer statistics
3. Cancer disparities
4. Cancer prevention and early
detection
5. Cancer survivorship
6. Cancer research
Outline
4. 4
What is cancer?
Disease where abnormal cells divide without control and are able to
invade other tissues
1,685,210 new cases expected in 2016
2nd leading cause of death in the US
Cancer arises from malfunctions in genes that control cell growth and
division
Mutations develop over a lifetime
5. 5
Who is at risk?
Anyone can develop cancer
Risk increases with age
86% of all cancers diagnosed in people ≥50 years of age
Approximately 14.5 million Americans with a history of cancer were
alive on Jan 1, 2014
7. 7
Where do cancer statistics come from?
Surveillance, Epidemiology, and End Results (SEER) Program
Data collection started in 1973 for 7 states
Now ~ 30% of the US population
National Program of Cancer Registries (NPCR)
Established in 1992 to cover 10 states that did not have a cancer
registry
Now supports cancer registries in 45 states + DC and territories
8. 8
Cancer Incidence
Number of new cases among population at risk
Expressed as number of cases per 100,000 people at risk
10. 10
Estimates rounded to nearest 10. Excludes basal cell and squamous
cell skin cancers and in situ carcinoma except urinary bladder.
Leading sites of new cancer cases – 2016 estimates
12. 12
Cancer prevalence
Who has cancer right now out of everyone in the population
Includes people who are living with cancer
Incidence and survival impact specific cancer prevalence
Incidence
Survival
Prevalence
14. 14
Stage of diagnosis
More localized = better chance of benefiting from treatment
Rates of late-stage (distant) cancers are tracked to monitor the impact
of cancer screening.
More cancers detected at early stages should = fewer detected at late
stages
Clinicians use TNM staging
Tumor (T), lymph node involvement (N), metastases (M)
Stage 0
- Carcinoma
in situ
Stage 1
- Localized
Stage 2
- Regional
early locally
advanced
Stage 3
- Regional
late locally
advanced
Stage 4
- Distant
15. 15
Stage distribution SEER 2000 by cancer site
0%
10%
20%
30%
40%
50%
60%
70%
80%
90%
100%
Colon and
Rectum
Pancreas Lung and
Bronchus
Cervix
Uteri
Female
Breast
Prostate
Unstaged
Distant
Regional
Localized
16. 16
Cancer mortality
Number of deaths caused by cancer in a specified population
Expressed as number of deaths per 100,000 people
18. 18
Leading sites of cancer deaths – 2016 estimates
Estimates rounded to nearest 10. Excludes basal cell and squamous
cell skin cancers and in situ carcinoma except urinary bladder.
19. 19
Cancer survival
Observed survival
Proportion of people alive at a time point after diagnosis
Relative survival
Probability of surviving by a given time (usually 5-years)
% of patients alive within a specific time period after diagnosis
% expected survivors if no cancer based on normal life expectancy
5-year relative survival from 2005-2011 = 69%
From 1975-1977 = 49%
Various factors influence survival
23. 23
Cancer Incidence, 1973-2012 by race and gender
0
50
100
150
200
250
Stomach Colon and
Rectum
Pancreas Urinary
Bladder
Leukemia Cervix Breast Prostate
Incidence
per
100,000
White Male Black Male White Female Black Female
28. 28
Cancer health disparities
Health disparities are differences in incidence, mortality, burden of
disease, prevention, or treatment in specific groups.
Causes of health disparities - complex interaction of factors
Social
Cultural
Economic
Environmental
Health care-related
Groups to identify/examine cancer health disparities
Race/ethnicity
Socioeconomic status
Geographic region
Gender
29. 29
Race/ethnicity
Obstacles to receiving healthcare services
Including cancer prevention, early detection and good quality cancer
treatment
Poverty
Percent living below the poverty line
28% African Americans
25% Hispanics
10% non-Hispanic whites
Discrimination
Cultural/inherited factors
Social
factors
Behaviors
Genetics
30. 30
Socioeconomic status (SES)
People with lower SES have disproportionately higher cancer death
rates than those with higher SES, regardless of demographic factors
such as race/ethnicity.
Cancer mortality rates for men with ≤ high school education is ~ 3 times
higher than those with a college degree, regardless of race
35. 35
Chemoprevention
The use of drugs, vitamins, or other agents to try to reduce the risk of,
or delay the development or recurrence of cancer
Beta-carotene for lung cancer
USPSTF just recommend aspirin for colorectal cancer in adults 50-59
36. 36
Smoking
1/3 of all cancers caused by tobacco smoking and environmental
tobacco smoke exposure
Smoking rates are higher in:
Low SES groups
People with mental health illness
Problems with cessation
Nicotine is addictive
Tobacco marketing
37. 37
Secondary prevention - early detection
Finding cancer at an earlier stage when it is easier to treat
Biomarkers
Screening
Disease
onset
Symptoms Begin
treatment
Dx
Preclinical phase Clinical phase
38. 38
Biomarkers
Molecule found in blood, other body fluids, or tissues that is a sign of a
normal or abnormal process, or of a condition or disease,
Proteins
PSA
Genetic
Circulating cancer cell DNA
Collection of different molecules
41. 41
Cancer survivorship
Definition varies
Survivor from time of diagnosis?
Survivor after completing treatment?
Survivor after surviving 5 years after treatment?
14.5 million cancer survivors in the US in 2014
~ 19 million estimated for 2024
42. 42
Post treatment follow-up care
Monitoring after completion of cancer treatment
Late-effects
Long-term effects
Evidence-based guidelines for post-treatment care exist
National Comprehensive Care Network (NCCN)
American Society of Clinical Oncology (ASCO)
Provider responsible for follow-up is not explicitly stated
Specialist vs. primary care follow-up care
Specialist is traditional source of care
Breast cancer: Two RCTs of oncology vs. primary care follow-up
showed similar outcomes