SlideShare a Scribd company logo
1 of 47
Download to read offline
Western Australian Resources Industry: ENVIRONMENTAL SCANRight PlaceRight AttitudeSkilled WorkforceRight Skills 
June 2010 
The Resources Industry Training Council is a State Government funded; APPEA (www.appea.com.au) and CME (www.cmewa.com) joint venture initiative to represent the training and workforce development needs of the Western Australian resources (mining, gas and oil) and downstream process manufacturing industries.
RESOURCES INDUSTRY ENVIRONMENTAL SCAN 
Note and Declaimer: 
This document is an environmental scan for the Western Australian resources sector and was developed by the Resources Industry Training Council (RITC). Its purpose is to provide the Department of Training and Workforce Development and the State Training Board with an overview of the industry with the intention of being incorporated into a workforce development plan for the petroleum, mining and exploration industries of Western Australia. 
This report is supplied in good faith and reflects the knowledge, expertise and experience of the developer. The information provided is derived from sources believed to be reliable and accurate at the time of publication. 
The use of the information in the environmental scan is at your own risk. The RITC does not warrant the accuracy of any forecast or prediction in the report. The environmental scan is provided solely on the basis that users will be responsible for making their own assessment of the information provided therein and users are advised to verify all representations, statements and information for decisions that concern the conduct of business that involves monetary or operational consequences. Each user waives and releases the Resources Industry Training Council and the State of Western Australia and its servants to the full extent permitted by law from all and any claims relating to the use of the material in the environmental scan. In no event shall the Resources Industry Training Council or the State of Western Australia be liable for any incidental or consequential damages arising from any use or reliance on any material in the environmental scan. 
The Resources Industry Training Council 
7th Floor, 12 St Georges Terrace, 
Locked Bag N984, Perth, WA, 6844 
Phone: +61 8 9325 2955 
Facsimile: +61 8 9221 3701 
For information regarding this report contact: 
Debra Dixon 
Executive Officer 
Resources Industry Training Council 
Telephone: +61 8 9220 8538 
Email: d.dixon@cmewa.com
Contents 
Executive Summary ................................................................................................. 1 
Resources Industry Overview ...................................................................................... 1 
State and National Training Councils ............................................................................ 2 
Industry Organisations/Associations ............................................................................. 2 
Economic Overview of the Resources Industry ................................................................. 2 
Economic Cycles and Conditions ............................................................................... 3 
Political/ Governmental/ Regulatory Influences ............................................................... 4 
Regulations and Legislation Affecting the Industry ......................................................... 4 
Changes in Rules and Regulations ............................................................................. 5 
Certification Requirements ..................................................................................... 7 
Geographic Location of the Industry ............................................................................. 7 
Regional Infrastructure and Availability Of Adequate Local Skills & Labour .......................... 11 
Employment ........................................................................................................ 11 
Construction versus Operational workforce needs ........................................................ 12 
Demands for a Skilled workforce ............................................................................ 12 
Phases of operations ........................................................................................... 13 
Workforce Statistics ............................................................................................ 15 
National Competency Standards and National Training Packages ...................................... 19 
Industry Occupational Overview ............................................................................. 20 
Future Labour Demands ....................................................................................... 22 
Current and Emerging Skill / Labour Gaps ................................................................. 23 
Operation Critical Job Roles .................................................................................. 25 
Emerging Occupations ......................................................................................... 26 
Declining Occupations ......................................................................................... 26 
Workforce Sources ................................................................................................ 26 
Fly In Fly Out (FIFO) ........................................................................................... 27 
Sourcing Employees from Overseas .......................................................................... 28 
Barriers to Employment .......................................................................................... 30 
What makes Employment Less Attractive? ................................................................. 30 
Education and Training ........................................................................................... 32 
Barriers to Training ............................................................................................ 32 
Pre-employment Education and Training ................................................................... 32 
Existing Worker training ....................................................................................... 33 
Industry Qualifications Overview ............................................................................ 34 
University Education ........................................................................................... 35 
Future Directions for Education and Training .............................................................. 36 
Technology ......................................................................................................... 36 
Sustainability ...................................................................................................... 37 
Carbon Emissions ............................................................................................... 38 
Resource Operations .............................................................................................. 38 
Data Sources .................................................................................................... 42
Executive Summary 
The Department of Training and Workforce Development commissioned the Resources Industry Training Council to undertake research and prepare a industry workforce development plan for the Western Australian resources industry which includes the mining, petroleum, drilling and quarrying industries. This environmental scan is a component of that workforce development plan. The purpose of the initial research was to conduct an industry analysis of current and future employment demand, to identify barriers to employment and develop strategies to ensure this demand for skills and labour could be met. 
With more than $88 billion worth of resource development and expansion projects either commenced or committed in Western Australia; labour and skill shortages are already being felt despite the global financial downturn. Large scale petroleum and iron ore projects are employing significant numbers of tradespersons during the construction phase; with most in demand trade being the metals, engineering and electrical trades. Construction phases require around 10 times the number of employees as does the operational phase of the project. The demand for construction skills and labour is having affect on other industries with employees moving from other sectors into resource project construction. 
The request for the development of the environmental scan was a response to the serious labour shortages experiences across all industries prior to the global economic downturn and the knowledge that a resurgence of skills and labour demands in the resources sector has begun. Labour and skills shortages threaten to constrain economic development and prevent Western Australia to reach its full economic potential. The scan has been designed to assist Western Australian State government with developing training policy, establishing VET funding priorities and the development of a workforce development plan for Western Australia. 
Evidence gathering and research in preparation for this scan, included: 
• 
comprehensive analysis of data and reports produced by the Chamber of Minerals and Energy WA (CMEWA); the Australian Petroleum Production and Exploration Assocaition (APPEA), Mining Industry Skills Centres Inc; Energy Skills Queensland, the State Training Board and the WA Department of Mines and Petroleum; 
• 
industry visits by RITC personnel, which involved face-to-face interviews with key enterprise stakeholders; 
• 
review of published and web-based information and data; 
• 
consultation with industry representatives from the various sectors for validation of this environmental scan; 
• 
analysis of data supplied by the Australian Bureau of Statistics, SkillsDMC, Manufacturing Skills Australia (MSA), IBIS World, Australian Industry Group (AIG) and other similar organisations. 
Resources Industry Overview 
The primary activities of the Western Australian resources industry include: 
• 
Exploration and drilling; 
• 
Metal ore and coal mining; 
• 
Oil and gas extraction; 
• 
Non metal ore mining and quarrying; 
• 
Salt production. 
The major products and services of this industry include: 
Iron Ore 
Gold 
Alumina 
Lead 
Silver 
Copper 
Zinc 
Coal 
Oil and gas 
Nickel 
Minerals Sands 
Manganese 
Salt 
Diamonds 
Tin 
Cobalt 
Chromite 
Clays 
Construction Materials 
Dimension Stone 
Gypsum 
Industrial Pegmatite Minerals 
Limestone 
Manganese Ore 
Molybdenum 
Phosphate 
Rare Earths 
Silica - Silica Sand 
Talc 
Tin 
Tantalum 
Lithium 
Vanadium 
Exploration 
Drilling 
Mining Services 
 Page 1
Page 1 
The resources industry includes activities that extract naturally occurring minerals, crude petroleum and natural gas. The term mining is used in very broadest sense to include underground or open cut mining, quarrying, well operations (gas  oil) or evaporation pans (salt), as well as beneficiation activities which may involve crushing, screening, washing and flotation and other preparation work customarily performed at the mine site, or as a part of mining activity. 
Despite the global economic downturn and a fall in commodity prices Western Australia’s resources industry recorded a 19% increase in sales value. Iron ore was the largest individual mineral sector accounting for almost half of the total value of the State’s mineral and petroleum sales. Other commodities to record significant growth in sales value in 2008–09 include LNG, natural gas, gold and salt. The mineral and petroleum sectors contributed 89% ($77.5 billion) to the States exports in 2008-20091. 
Data compiled by Department of Mines and Petroleum (DMP) show that there were 67,865 persons employed in the Western Australian mining sector in June 2009. This represents a 4% decrease compared to June 2008 or a loss of 9,663 jobs compared to October 2008; when Western Australian mining sector employment peaked at 77,528. Despite job losses in the State’s resources industry; the industry continued to be a major employer in Western Australia where it is estimated that one in five employees are either directly or indirectly involved in resource sector activities1. 
In 2008 Chamber of Minerals and Energy’s publication ‘Developing a Growth Outlook for WA’s Minerals and Energy Industry’ predicts the demand for people, water and energy based on proposed developments within the resources sector. The long term outlook for the resources sector is very positive. In summary: 
• 
the resources industry is projected to grow significantly in the period 2008-2014; 
• 
direct labour demand is expected to peak in 2012 at ~ 38,000; 
• 
the highest growth regions are expected to be the Mid-West (6,000); Goldfields/Esperance (3,000) and the Pilbara (14,000) in 2014; 
• 
Additional employees will be FIFO with a peak incremental requirement of 27,000 in 2012 versus a residential workforce requirement of 11,000 in the same period. 
In 2009, the State government introduced an Exploration Incentive Scheme to encourage exploration in unexplored regions of the State. Petroleum exploration for 2008-2009 totalled $2.9 billion which was 35% higher than in 2007-2008. Offshore exploration accounts for 84% of the total expenditure and is located mainly in the Carnarvon and Browse basins. Although minerals exploration experienced a 10% fall in expenditure it still reached $1.2 billion. Iron ore (33%) and uranium (6%) exploration both recorded increases in expenditure. Gold exploration fell by 24% and base metals including nickel experiences a 12% fall. 
In 2008–09, $22.8 billion of new capital expenditure by Western Australia's mining industry represented a 34% increase compared to the previous financial year. Capital expenditure by the mining industry represented 75% of Western Australia’s total new capital expenditure of $30.4 billion in 2008–09. Western Australia also accounted for 64% of national investment expenditure by the mining industry in 2008–091. 
Investment projects in the under-construction category are dominated by iron ore and LNG projects. Projects include 
• 
Woodside’s Pluto Train 1 LNG project ($12 billion); 
• 
BHP Billiton’s Rapid Growth Project 5 iron ore project ($7.4 billion); 
• 
Sino Iron’s Pellet project ($5.2 billion); 
• 
Newmont Mining Corporation’s Boddington gold and copper mine ($3.7 billion); and 
• 
Worsley Alumina’s refinery expansion ($2.5 billion). 
The committed investment projects category is dominated by: 
• 
the Gorgon Joint Venture ($43 billion); 
• 
the Oakajee Port and Rail development ($4 billion); 
• 
Perdamen Chemicals’ Coal to Urea Plant ($3.7 billion); 
• 
Western Areas’ Flying Fox, Spotted Quoll and Lounge Lizard nickel projects ($3.8 billion). 
Despite the outsourcing to overseas companies and facilities the development of the large components of these construction projects (for example LNG trains) this equipment will need to be assembled and installed on arrival in Western Australia. During the construction period the above large scale construction projects will increase demand for metal, electrical, mechanical and other 
1 Department of Mines and Petroleum: Western Australian Minerals and Petroleum Statistics Digest 2008-2009.
Page 2 
construction and commissioning tradespersons. After construction the numbers of workers falls dramatically as maintenance and operating staffing levels are significantly smaller. 
Over the past ten years; royalties received by the Western Australian Government from Western Australian mineral and petroleum producers have increased 280% from $777 million in 1999–2000 to $3.2 billion collected during the 2008–09 financial year. 
In summary Western Australia accounts for approximately 46% of Australia’s total value of mineral and petroleum sales (based on DMP and ABARE published data). DMP and ABARE data show that in the 2008 calendar year Western Australia’s petroleum industry accounted for 66% of national crude oil and condensate production and 71% of natural gas production and in 2008–09 38% of Australia’s total merchandise exports originated from Western Australia. 
State and National Training Councils 
The Resources Industry Training Council (RITC) is one of ten industry advisory bodies established by the State Government to provide strategic, forward looking training advice to the Western Australian State Training Board (STB) and the Department of Training and Workforce Development. A major function of the RITC is to work with industry, training providers and government to develop and implement innovative solutions for skill shortages and changing workforce needs. 
The RITC is a State Government funded joint venture between the Chamber of Minerals and Energy of Western Australia (CMEWA) and the Australian Petroleum Production  Exploration Association Ltd (APPEA). The RITC is the peak body for the development and implementation of a vocational education and training (VET) framework to meet the diverse needs of the industry sectors of minerals, oil and gas and downstream processing. 
SkillsDMC is the national Industry Skills Council for the Resources and Infrastructure sectors with coverage for the manufacturing sector which includes mining, drilling and construction. 
Manufacturing Skills Australia (MSA) is the national Industry Skills Council for the manufacturing sector which covers the petroleum extraction and processing sectors. 
Industry Organisations/Associations 
• 
Australian Petroleum Production and Exploration Association 
• 
Chamber of Minerals and Energy 
• 
Association of Mining and Exploration Companies 
• 
Australian Drilling Industry Association 
• 
Australian Drilling Industry Training Committee 
Economic Overview of the Resources Industry 
The minerals and petroleum industry is a major contributor to the economy. In 2008-2009 the minerals and petroleum exports accounted for almost 90% of the State’s income from total merchandise exports. In 2008-2009 the value of the Western Australian minerals and petroleum industry reached $71.3 billion, an increase of 19% over the previous year2. 
Within the State there are over 513 commercial mineral projects with more than 893 operating mine sites and 64 operating oil and gas fields. More than 50 different minerals are mined. The resources sector employs more than 67,865 persons. 
Western Australia’s mineral and petroleum resources in order of value for 2008–09 are: 
Billion 
$ 
Iron Ore 
$33.56 
Crude Oil and Condensate 
$10.77 
LNG 
$8.54 
Gold 
$5.19 
Alumina 
$4.56 
Nickel 
$2.98 
Others 
$5.71 
2 Department of Mines and Petroleum: Western Australian Minerals and Petroleum Statistics Digest 2008-2009
Over the past ten years, royalties received by the Western Australian Government from mineral and petroleum producers have increased 280% from $777 million in 1999–2000 to $3.2 billion collected during the 2008–09 financial year. This represents royalties paid into the Western Australian Government Consolidated Revenue Fund. It includes Western Australia’s share of royalties paid by petroleum projects, royalties collected in the Territorial Sea subsisting permit areas, Barrow Island and the North West Shelf (where the State receives approximately 65% of royalties) that are shared with the Commonwealth. 
2008-2009 
Output Of Minerals And Energy 2 
Million $ 
WA share of 
% 
(based on value) 
Western Australia 
$71,310 
Australian Minerals and Energy 
48% 
Australia (~ based on ABS data) 
$148,562 
Australian Minerals(excl. coal) 
43% 
WA minerals 
$50,017 
Australian Minerals (incl. coal) 
62% 
WA petroleum 
$21,293 
Australian Energy (incl. coal) 
33% 
Australian Petroleum 
64% 
Major West Australian Commodities 
Exploration 
Iron Ore 
$33,561 million 
Western Australian mineral 
$1,247 million 
Petroleum 
$21,293 million 
Australian mineral 
$2,223 million 
Gold 
$5,190 million 
WA share 
56% 
Alumina 
$4,564 million 
Western Australian petroleum 
$2,945 million 
Nickel 
$2,979 million 
Australian petroleum 
$3,811 million 
WA share 
77% 
Merchandise Exports 
Mineral and Energy Exports 
Western Australia 
$86,790 million 
Western Australia 
$77,470 million 
Australia 
$230,475 million 
Australia 
$160,377 million 
WA share 
38% 
WA share 
48% 
WA exports of minerals and energy as % share of all State Merchandise exports 
89% 
Private New Capital Investment and GDP 
Western Australia 
$30,370 million 
Australian minerals and energy 
$35,675 million 
Australia 
$101,134 million 
WA minerals and energy 
$22,847 million 
WA share 
30% 
WA share 
64% 
Australia GDP 2008-09 
$1,194,496 million 
Western Australian GSP 2008-09 
$156,607 million 
Mining component of WA GSP 
25% 
In 2007/08, the total domestic market for gas was about 950 terajoules per day, representing 53% of gross State energy consumption and 60% of electricity generation. Most gas for domestic use is supplied by the North West Shelf Venture (63%) through the Karratha Gas Plant and the Apache- Operated Harriet and John Brookes joint ventures (33%), through Varanus Island. Domestic gas projects under development or being considered for development include Devil Creek (220TJ/D), Gorgon (300TJ/d), Macedon (170TJ/d), Wheatstone (150 TJ/d) as well as Pluto. Gas is used predominantly for industrial production (58%), in electricity generation (29%) and by households for cooking and heating (4%). More than 75% of this gas is consumed by just six large customers- Alinta, BHP Billiton and Burrup Fertilisers for industrial purposes; Verve Energy, ERM and Alinta for electricity generation and gas supply to small customers. 
ECONOMIC CYCLES AND CONDITIONS 
The levels of commodities produced by the resources sector and the sectors profitability rely on global commodity prices and demand. If commodity prices or demand fall too low resource operations will stop operating and go into care and maintenance until commodity prices and demand improve. This reaction to the global economy is reflected in the number of projects that were put on hold after the global economic downturn. Prior to the down turn severe skill shortages existed in most Western Australian industries as the resource sector drew labour from all other industries. After global economic downturn the resources sector made a significant number of employees redundant, this had a dramatic flow on into the supporting industries. 
 Page 3
Despite the global economic downturn at an aggregate level, the value of Western Australian mineral and petroleum sales recorded a 19% increase to reach $71.3 billion in 2008–09. Iron ore was the largest individual mineral sector by value and accounted for almost half of the total value of the State’s mineral and petroleum sales. Other commodities to record significant growth in sales value in 2008–09 include LNG, natural gas, gold and salt. 
The following table lists the overall average commodity price movements in 2008–09. As shown; commodity prices were adversely affected by the global financial crisis. 
Commodity 
$ 
Iron Ore 
Up 74% 
Gold 
Up 28% 
Alumina 
Steady 
Tin 
Down 4% 
Crude Oil 
Down 16% 
Copper 
Down 26% 
Cobalt 
Down 34% 
Zinc 
Down 36% 
Lead 
Down 40% 
Nickel 
Down 45% 
The shortage of labour and the need for an appropriately skilled workforce are regularly identified as key impediments to the growth of Australia’s resources sector. While this is undoubtedly true, to precisely what extent and what actions are required is much less certain. Given the number of variables that will affect the future growth of the industry, including Australia’s investment competitiveness, the economic climate and international demand for Australian resources, it is impossible to forecast the industry’s skill and labour needs into the future with a high degree of accuracy. Planning for uncertainty underscores the importance of a strong partnership between the industry and government, both of whom have very significant, though different, roles to play. 
Industry costs generally have doubled around the world in recent years (industry costs in Australia increased more than the global average) and local factors like the increased remoteness of the fields, in deeper water, with drier gas and higher impurities, are also contributing to higher development costs. The higher the industry costs the less competitive the industry is in the global market. 
Political/ Governmental/ Regulatory Influences 
REGULATIONS AND LEGISLATION AFFECTING THE INDUSTRY 
• 
Atomic Energy Act 1953 (Cwth) 
• 
Australian Radiation Protection and Nuclear Safety Act 1998 (Cwth) 
• 
Environment Protection and biodiversity Conservation Act 1999 (Cwth) 
• 
Environmental Protection (Impact of Proposals) Act 1974 (Cwth) 
• 
Conservation and Land Management Act 1984 (WA) 
• 
Customs (Prohibited Exports) Regulations 1958 (Cwth) 
• 
Customs Act 1901 (Cwth) 
• 
Dangerous Goods Safety Act 2004 (WA) 
• 
Dangerous Goods Safety Regulations 2007 (WA) 
• 
Environmental Protection Act 1986 (WA) 
• 
Environmental Protection and Biodiversity Conservation Act 1999 (Cwlth) 
• 
Mines Safety and Inspection Act 1994 (WA) and Mines Safety and Inspection Regulations 1995 (WA). 
• 
Mining Act 1978 (WA) 
• 
Native Title Act 1993 (Cwth); 
• 
Nuclear Activities Regulations Act 1978 (WA) 
• 
Nuclear Non-Proliferation (Safeguards) Act 1987 (Cwth). 
• 
Nuclear Non-Proliferation Treaty 
• 
Offshore Petroleum and Greenhouse Gas Storage Act 2006 (Cwth) 
• 
Petroleum (Submerged Lands) Act 1982 (WA) 
• Petroleum and Geothermal Energy Resources Act 1967 (WA) 
• Petroleum Legislation Amendment and Repeal Act 2005 (WA) 
 Page 4
• Petroleum Pipelines Act 1969 (WA) 
• 
Radiation Protection and Control Act 1982 (SA) 
• 
Radiation Safety Act 1985 (WA) 
• 
Radioactive Ores and Concentrates (packaging and transport ) Act 1980 (NT) 
• 
Rights in Water and Irrigation Act 1914 (WA) 
• 
Wildlife Conservation Act 1950 (WA) 
CHANGES IN RULES AND REGULATIONS 
Carbon Emissions 
Carbon emissions legislation will have an effect on the resources sector. 
Royalties and Taxes 
Tax and royalty rates are an important factor when companies make decisions about developing resource projects, as well as determining which States and countries provide the best operating environment for new investments in resources projects. 
The Federal Government’s proposed introduction of a new $9 billion tax on the resources sector, called the “Resource Super Profits Tax” (RSPT) will take some time to evaluate in terms of their overall net impact on the WA resources sector. 
The State Government collected $3.2 billion in resource royalties in 2008-09. Much of the revenue received from royalties is invested in infrastructure projects and as the basis of the Royalties for Regions program which is returning 25% of all royalties to regional Western Australia. 
Mineral and petroleum resources are owned by the Crown, and either the Federal Government (in the case of offshore operations) or the State and Territory Governments (in the case of onshore operations) levy royalties or taxes. 
The level and nature of royalties varies between both States and commodities. Royalty systems include specific rate royalties, ad valorem royalties and profit-related royalties. The bulk of the royalties paid by the Mining division goes to Federal and State Governments, but some royalties are also paid to others. The proposed Centralised Royalty Revenue needs to ensure equitable distribution and not disadvantage Western Australia. 
Oil and gas accounted for about 47% of the royalty payments, coal mining for about 27%, metal ore mining for nearly 23% and other minerals for the remaining 3%. 
A number of specific taxes apply to the Oil and Gas Extraction industry. With the exception of various North West Shelf project; Petroleum Resource Rent Taxes (PRRT) apply to most offshore petroleum projects. PRRT is levied on net revenues at the rate of 40%. Where PRRT applies, it replaces the excise and royalties that would otherwise have been levied. 
Resource Rent Royalties (RRR) may be applied to onshore petroleum projects by State Governments. There is provision for the Federal Government to waive its crude oil excise where RRR is applied, provided that the State Government negotiates an acceptable agreement with the producers and agrees to a satisfactory revenue sharing arrangement with the Federal Government. Resource Rent Royalties are levied at a rate of between 10% and 12.5% of the net well-head value of all petroleum produced. 
Crude Oil Excises are levied as a percentage of the realised price received by producers and are based on the annual level of crude oil sales from individual productions areas. The level of excise varies with the size and discovery date of the field. In general, most states levy royalties of between 10% and 12.5% of the net well-head value of the petroleum produced. Excises apply to crude oil production onshore and in coastal waters (with the exception of Barrow Island where a RRR applies). They also apply to the North West Shelf projects. 
Commonwealth royalties are levied on offshore petroleum production from the North West Shelf project and the proceeds are split between the Federal Government and the Western Australian Government. 
A GST applied at the rate of 10% benefits the Mining sector, as it is able to claim GST paid on business inputs, and is not required to charge GST to its overseas customers. 
Replacing State mineral royalties with a new Federal tax could see Western Australia miss out on its fair share of the income derived from resource projects in the State according to the CME. 
 Page 5
Royalties derived from resource projects are an essential part of State revenue and are required to deliver important services and infrastructure for all Western Australians and this revenue must not be threatened by the advent of the RSPT. It is acknowledged that the Federal Government also contributes significantly to the infrastructure requirements of the State and to increase the contribution made by companies to a sustainable level could assist in the provision of improved services and development in regional and metropolitan areas. 
Skilled Migration 
The resources industry is a global industry, with many multinational companies having workforces in several countries; hence, resources industry skills are internationally transferrable. A State workforce development strategy needs to factor in this global movement of employees. Skilled migrants on temporary (457) skilled migration programs, particularly in critical professional roles are a key component of the minerals sector’s response to overcoming skills capacity constraints and maintaining the resources sector’s productivity. 
Australia’s skilled migration program provides a critical source of skilled workers for the resources sector. During the recent commodity market surge the minerals industry workforce grew by 90 % in the five years to November 2008 and skilled migrants comprised a critical 3 % of that labour force. 
The 2009 review of the Migration Occupations in Demand List (MODL) review found that the MODL needed to be revoked and replaced by a more targeted skilled occupations list to better meet the demands of Australia’s labour market. Also announced was the replacement of the current Skilled Occupation List (SOL) in the second half of 2010, with a new list of targeted occupations determined by the independent body, ‘Skills Australia’. While industry has supported the change to an industry driven model of program targets being set against medium-long term skill needs rather than the more cyclical nature of labour demand that characterises many Australian industries; the minerals industry being one of those. The Government’s labour market forecasts of the minerals industry have consistently underestimated the skills shortages in occupations with small numbers of employees such as mining engineering and metallurgy. In particular the industry supports the need to target skills of high economic value across all skilled migration programs. 
A skilled migration program with integrity that doesn’t compromise the working conditions of the migrants, nor work opportunities for Australians and which is not overly bureaucratic and facilitates employer participation must be maintained within the national workforce development strategy. The system must be responsive to genuine employers and timely in delivering outcomes to match investment decisions. 
The nation’s population alone cannot meet the anticipated skills demand of the resources sector in a timely manner. Therefore, the skilled migration system should complement the continuing development of the skills of the state by providing highly skilled migrant workers where those skills are not currently available in sufficient quantities in the Australian workforce. 
VET Act 
The September 2009 amendments to the Vocational Education and Training Act 1996 made widespread changes to the operation and administration of training in WA, particularly affecting trade training and issuing of trade papers. 
The shortening of some apprenticeship terms to three and a half years has not been met with universal approval of the Industry. Many employers believe that the increasing complexity of some work skills require more rather than less time in training. This has lead to some employers retaining the Apprentice after the indenture period to ensure the workplace competency is fully developed. 
The removal of the need to issue both a Trade qualification and trade papers has raised concerns in industry in that there may be a tendency by training providers to not ensure an apprentice is competent in the workplace to trades level. Previously this was a two-stage procedure where the RTO and the ApprentiCentre issued two separate documents when all the assessments were completed and signed off by all parties – training provider and employer. 
The lack of trade papers will be further confounded if institutionalised trade training occurs as employers have not been educated to look for the wording ‘achieved through Australian Apprenticeship arrangements’ on a qualification. Employers will need to look for the statement to determine if the trade skills were acquired through an employment contract (apprenticeship) or fully institutionalised.  Page 6
CERTIFICATION REQUIREMENTS 
• 
Authorised Mine Surveyor’s certificate grades 1 and 2 
• 
Dangerous Goods Safety (Explosives) Regulations 2007 
• 
Dangerous Goods Safety (Security Risk Substances) Regulations 2007 
• 
Dangerous Goods Security Card 
• 
Deputy’s certificate 
• 
Exploration Licence 
• 
Explosives Import / Export Licence 
• 
Explosives Manufacture (Mobile Processing Unit) Licence 
• 
Explosives Storage Licence 
• 
Explosives Transport Licence 
• 
Fireworks Contractor Licence 
• 
Fireworks Event Permit 
• 
Fireworks Operator Licence 
• 
First Class Mine Manager’s Certificate Of Competency 
• 
Issue Of A Test Permit 
• 
Mine surveyor’s certificate 
• 
National Standard For Licensing Persons Performing High Risk Work 
• 
Pyrotechnics (Special Use) Licence 
• 
Quarry Manager’s Certificate Of Competency 
• 
Restricted quarry manager Certificate Of Competency 
• 
Shotfiring Licence 
• 
SRS Fertiliser Licence 
• 
SRS Import / Export Licence 
• 
SRS Manufacture Licence 
• 
SRS Storage Licence 
• 
SRS Supply Licence 
• 
SRS Transport Licence 
• 
Tenement Licence 
• 
Underground Supervisor’s Certificate Of Competency 
• 
Ventilation Officer – Diploma or above 
• 
Water Well Drilling Licence 
• 
Winding Engine Driver’s certificate 
Geographic Location of the Industry 
The majority of the industry is conducted in remote and regional Western Australia with the majority occurring in the Pilbara and the Kalgoorlie Esperance regions with the Mid West becoming a region of growth. 
Large resource companies typically have a head office located one of the large cities rather than the operations site. Head Office functions typically include setting production targets, corporate standards, strategic planning and corporate compliance and reporting. Often the head office will develop and drive the graduate and leadership programs across the sites.  Page 7
Source: http://www.dmp.wa.gov.au/documents/map09.pdf 
Most of Australia’s petroleum resources are located on the coast of Western Australia, the Northern Territory and Victoria. Western Australia has 64% of Australia’s economic demonstrated resources of crude oil, 75% of condensate resources and 57% of LPG resources. Geoscience Australia 2008, Oil and gas resources of Australia showed that WA’s Petroleum resources include 121 GL of crude oil, 255 GL of condensate, 98 GL of LPG, and 2592 bcm of Conventional Gas.  Page 8
Page 9 
Australia’s existing, committed and proposed LNG plants. 
DMP data3 shows regions in Western Australia produce minerals and/or gas and oil. The Pilbara is the major mineral and petroleum centre for Western Australia with 47% of the resources value being generated by minerals (mainly iron ore but along with gold, manganese, copper and salt) and around 28% by petroleum. The Goldfields – Esperance region generates 11% of the State’s mineral wealth mainly through gold, nickel cobalt and base metals. Currently the Mid West generates 4% through gold, base metals, iron ore as well as gas and oil but this region is expected to grow with the ramping up of iron mines in the region. The Peel region generates 6% of the value through alumina and gold production. The Kimberly produces diamonds, nickel, gold and iron ore and reflects 1% of the value resources produced in Western Australia. The Southwest is known for its coal mines, mineral sands. 
3 http://www.dmp.wa.gov.au/1521.aspx#7873: Quantity and value 2009 47% 28% 11% 6% 4% 2%1% 1% $ Value of Minerals and Petroleum by RegionPilbara RegionOffshore PetroleumGoldfields Esperance Peel RegionMid West RegionWheatbelt RegionKimberley RegionOther
Page 10 
2009 Sales Value of Resources Produced by Region 
Pilbara Region 
Wheatbelt Region 
Iron Ore 
$26,820,026,183 
Iron Ore, Feldspar and Gold 
$844,544,660 
Gold 
$717,755,331 
Gypsum and Heavy Mineral Sands 
$201,888,238 
Copper 
$599,738,263 
Nickel, Cobalt and Salt 
$166,012,639 
Manganese and Salt 
$550,352,096 
Other 
$8,719,078 
Other 
$107,822,954 
Total 
$1,221,164,615 
Total 
$28,795,694,827 
Kimberley Region 
Offshore Petroleum 
Nickel, Cobalt and Diamonds 
$394,450,678 
Crude Oil and Condensate 
$8,699,005,967 
Iron Ore and Gold 
$300,577,833 
Liquefied Natural Gas 
$6,327,686,818 
Copper, Silver and Crude Oil 
$31,408,329 
Natural Gas 
$1,133,326,096 
Other 
$5,200,523 
LPG Butane and Propane 
$612,776,966 
Total 
$731,637,363 
Total 
$16,772,795,847 
South West Region 
Goldfields Esperance Region 
Coal 
$308,156,873 
Gold 
$3,747,156,752 
Heavy Mineral Sands 
$146,944,680 
Nickel, Platinum and Palladium 
$2,654,202,367 
Tin, Tantalum and Spodumene 
$92,741,498 
Cobalt 
$151,750,856 
Other 
$226,041 
Copper and zinc 
$142,711,787 
Total 
$548,069,092 
Silver 
$15,756,175 
Construction Materials 
$3,461,378 
Gascoyne Region 
Other 
$2,858,443 
Salt and Gems 
$91,321,783 
Total 
$6,717,897,758 
Gypsum and Limesand-Limestone 
$8,714,659 
Other 
$25,230 
Peel Region 
Total 
$100,061,672 
Alumina 
$3,593,456,264 
Gold and Copper 
$105,985,416 
Perth Metropolitan Region 
Total 
$3,699,441,680 
Construction Materials, Silica Sand, 
Limesand-Limestone 
$25,194,012 
Mid West Region 
Gold 
$896,142,642 
Great Southern Region 
Copper, Lead and Zinc 
$386,540,055 
Limesand, Silica Sand and Spongolite 
$3,774,149 
Nickel, Cobalt and Talc 
$349,203,352 
Iron Ore and Gypsum 
$341,123,623 
Heavy Mineral Sands 
$276,727,462 
Chromite, Manganese and Silver 
$69,351,026 
Crude Oil and Condensate 
$36,349,155 
Natural Gas 
$22,909,246 
Other 
$3,480,140 
Total 
$2,381,826,701 Condensate19% Natural Gas7% Crude Oil33% LPG ‐ Butane  Propane4% LNG37% $ Value ByPetroleum Products
REGIONAL INFRASTRUCTURE AND AVAILABILITY OF ADEQUATE LOCAL SKILLS  LABOUR 
Due to a number of factors including inadequate regional infrastructure and local skilled labour the majority of employment in the resources sector is fly-in fly-out (FIFO). This enables employees to be sourced from across Australia focussing on the major cities. The majority of FIFO employees are recruited from Perth. 
The reliance on FIFO has: 
• 
placed an additional burden on airports and airlines; 
• 
increased the demand for temporary accommodation. 
State-wide demand for water; electricity and gas from the minerals and energy sector is projected to grow significantly in the period 2010-2014. The majority of this growth is expected in the Pilbara and Mid West regions where new and expanding projects in particular iron ore are planned. 
Anticipated State-wide demand from the minerals and energy sector for water; electricity and gas include: 
• 
water demand is projected to grow at a compounded annual growth rate (CAGR) of 5.4% to 1129 Giga litres per annum (GL/a) by 2014; 
• 
electricity demand from the Pilbara is 13766 GWh/a. This constitutes a 82% of incremental growth; 
• 
State gas is anticipated to grow at a CAGR of 6.7% to 286 PJ/a by 2014. The Pilbara region is expected to account for 82%; or 78 PJ/annum incremental gas requirements in 2010. 
Other issues related to the remote location of the resource operations include: 
• 
lack of affordable housing; 
• 
inadequacy of public transportation; 
• 
inadequacy health care in respect to doctors and hospitals including emergency, maternity, paediatrics, psychiatric and geriatric care; 
• 
lack of 24 hours 7 days a week childcare; 
• 
lack of availability of quality schools, TAFE and tertiary institutions and the quality of teachers; 
• 
fuel prices average 30 cents per litre more than the Perth area; and 
• 
desirability of geographic areas as places to live. 
Employment 
This environmental scan relies on data provided by the Department of Mines and Petroleum (DMP) which collects mining employment data from compulsory monthly accident reporting which are submitted by all operating mines and companies carrying out exploration on mineral and mining leases. The DMP’s Resources Safety Division’s AXTAT reporting system identifies the number of direct employees and contractors (including exploration personnel) working on operating mining leases. In March 2008 legislation was introduced to capture exploration personnel working on greenfield sites. The DMP collects petroleum employment data by contacting each operating company who provide both direct and contract personnel data. 
Employment data collected and published by the Australian Bureau of Statistics (ABS) is classified using reference to the Australian and New Zealand Standard Industrial Classification (ANZSIC). This data is therefore not directly comparable with that collected by DMP. Under ANZSIC guidelines not all mining employment is reflected in ABS’s Mining industry classification. For example: 
• 
Catering personnel working on mine sites are reflected in the Accommodation and Food Services classification and transport personnel (truck and train drivers) working on mine sites are reflected in the Postal and Warehousing industries. 
• 
Contractors employed in site preparation and removing overburden at a mine site on a contract or fee basis are listed under Site Preparation Services. 
• 
Employees engaged in liquefying natural gas, production of pig iron, hot briquetted iron, alumina, the smelting and refining of metals are included in Manufacturing. 
• 
Employees providing geophysical surveying services on a contract or fee basis are included in Surveying and Mapping Services.  Page 11
CONSTRUCTION VERSUS OPERATIONAL WORKFORCE NEEDS 
It is important to note that employment numbers and required skills in the resources sector differ dramatically between construction phase and operational phase. Construction typically required large numbers of traditional tradespersons to build and install the necessary infrastructure to enable the operation to produce and process its commodity. The operational phase requires significantly less trades persons (usually limited to maintenance personnel) and an introduction of extraction operators, process technicians. Construction phases normally have around 4 times the number of employees as the operational phase. 
Both the construction and operational phases contribute significantly to the economy. The industry has strong linkages with other sectors, so its impacts on the economy go further than the direct contribution of construction and operation. The level of additional economic activity generated by a source industry is referred to as a multiplier. There are two types of multipliers: 
1 
. Production induced made up of first round effect: which is all outputs and employment required to produce the inputs for construction and operations and an industrial support effect; which is the induced extra output and employment from all industries to support the production of the first round effect. 
2 
. Consumption induced: which relates to the demand for additional goods and services due to increased spending by the wage and salary earners across all industries arising from employment. 
Clements et al (2006) suggested basic employment multipliers for construction and metals mining were 2.93 and 4.13 respectively. This means each construction position generates 1.93 jobs in a supporting industry therefore demand for 1 additional construction job required the availability of 2.93 employees. Once the project is in operation for each additional employee 4.13 jobs will be created in an allied industry. 
DEMANDS FOR A SKILLED WORKFORCE 
A variety of operations, maintenance, engineering, science and managerial career paths exist across the exploration, production, transport and processing sectors of the industry. Career paths extend from manual fieldwork, through skilled operators and maintenance technicians, to professional engineering, science and managerial positions. 
There is a growing demand for skilled, safety conscience people with initiative and team-working skills across the industry. Other personal attributes required include the ability to work in a team, communicate ideas, and have the resourcefulness to deliver results in remote, challenging situations. Pathways into the industry can commence through an apprenticeship, from TAFE, university and existing employment in a relevant industry. Entry level may be relevant work experience such as mobile equipment operating, trade certificate, technical diploma or a degree. 
The Australian Qualification Framework (AQF) has been adopted by the industry with the RII and PMA Training Packages being the focus for operators and technicians, MEM for maintenance workers and university qualifications for the professional engineering and science professionals. 
Employers encourage life-long learning and are supporters of career advancement. Consequently, career progression, multi-skilling and opportunities to gain experience in other vocational streams or industry sectors are common. 
 Page 12
PHASES OF OPERATIONS 
The types of skills required by a resources company depends on the life stage of the site. 
Exploration Phase 
This is the phase when exploration of land and ocean floor formation occurs and making of predictions of where mineral, oil or gas may be found. Prospectors and exploration geologists use geological aerial and satellite surveys to identify rocks, faults and basins. They conduct geophysical studies of below-ground formations using seismic surveys and 3D simulations. 
Minerals sector skills requirement: 
Oil  Gas skills requirement: 
Prospectors and Exploration Geologists etc. 
Geoscientist, Geophysicists, Pilots, Maritime Crews etc. 
Drilling Phase 
In this phase drilling occurs to delineate ore bodies, oil and gas fields. Numerous drill holes are made and samples are analysed for mineral or oil bearing formations. The analysis of these samples will indicate if the project is commercially viable and the potential life of the operation. 
Minerals sector skills requirement: 
Oil  Gas skills requirement: 
Drillers, Drillers’ Assistants, Drill Supervisors, Geologists, etc. 
Geoscientist, Geophysicists, Drillers, Toolpushers, Installation Managers, Field Supervisors etc. 
Investment Decision Phase 
A business case for developing the reserve is made. Costs of constructions, extraction, processing and delivering to market are weighed against the current and predicated commodity prices and global demand. 
Skills required: Engineers, Business Analysts, Finance Analysts, Accountants, Board of Management, Lawyers, Community Liaison / media etc. 
Construction Phase 
Construction prepares the site and builds the infrastructure required for the operation to meet its objectives. On a mine site this is typically involves the clearing of land and the building of process plants, offices, change rooms, cribs and roads as required. 
For Oil and Gas extraction this phase involves the drilling of production wells to develop fields and produce oil and gas and through to well completions and the installation of valves and pipes to control pressure and flows. The constructions of production platforms and associated pipelines and land processing and storage facilities. 
In both cases the construction of airports, harbour/port facilities and residential camps may be involved. Occasionally the construction of power stations as well as significant roads and railways infrastructure are required. 
Minerals sector skills requirement: 
Oil  Gas skills requirement: 
Engineers (Civil, Structural, Mining), Construction Managers, Surveyors, Draftspersons, Metal Trades, Electricians, Instrumentation Fitters, Truck Drivers, Mobile Plant Operators, Carpenters, Plumbers, Coded Welders, Steel Fixers, And Grano Workers/Concrete Finishers, Etc. 
Drillers, Engineers (Structural, Subsea, Reservoir), Draftspersons, Metal Trades, Electricians, Instrumentation Fitters, Plumbers, Coded Welders, ROV Operators Etc. 
LNG Plant Development Condensate Tanks- Mobile Plant Operators, Labourers, Grano Workers/Concrete Finishers, Steel Fixers, Carpenters, Electricians, Welders, Riggers, Pipe Fitters, Plasterers/Boilermakers, Support Trades. 
Jetty development - Operators/Labourers, Grano Workers/Concrete Finishers, Steel Fixers, Carpenters, Electricians, Welders, Riggers, Pipe Fitters, Plasterers/Boilermakers, Support Trades. 
Camp and airport development – Civil Engineers, Draftspersons, Surveyors, Mobile Plant Operators, Plumbers, Carpenters, Electricians, Metal Trades, Grano Workers, Labourers.  Page 13
Production Phase 
The phase of operation that begins the produce an income for the operation by extracting minerals, oil or gas. 
Extraction 
Minerals sector skills requirement: 
Oil  Gas skills requirement: 
Mining Engineers, Mining Managers, Quarry Managers, Geologists, Surveyors, Core Technicians, Production Drillers, Development Drillers, Blasthole Drillers, Service Crew, Truck Drivers, Blast Technicians, Mobile Plant Operators, Warehouse  Logistics, Cleaners, Catering, Heavy Diesel Mechanics, Light Vehicle Mechanics, High Voltage Electricians, Environmentalists, Safety  Health Advisors etc. 
Reservoir Engineers, Process Technicians, Mechanical Maintenance Technicians, Safety  Health Advisors, Marine Biologists/ Environmentalists, Corrosion Control Operators etc. 
Processing 
In mineral mining this phase typically coincides with production and involves the removing of impurities and/concentrating of commercial commodities. 
In petroleum extraction this phase typically coincides with production and involves the removing of impurities and/or liquefying gas products. The separation of oil from gas and the light oil condensate formed naturally from gas. 
Minerals sector skills requirement: 
Oil  Gas skills requirement: 
Metallurgists, Process Technicians, Crusher Operators, Electricians, Instrumentation Fitters, Maintenance Technicians, Laboratory Technicians, Corrosion Control Technicians etc. 
Reservoir Engineers, Process Technicians, ROV Operators, Control Room Technicians, Maintenance Technicians etc. 
Transporting 
Moving the commodity from the site of extraction to the end user. Minerals are typically transported by truck or train to a port for transportation by ship to clients overseas. 
Oil and gas is either transported to shore by pipeline or loaded directly onto ships for transport to overseas refineries and clients. 
Minerals sector skills requirement: 
Oil  Gas skills requirement: 
Truck drivers, Train Drivers, Loader Operators, Heavy Diesel Mechanics, Railway Line Maintenance Crew, Ship Loaders, Hatch Operators, Harbour Master, Reclaimer Operators etc. 
Control Room Technicians, Process Technicians, Pipeline Technicians etc. 
Care and Maintenance Phase 
This phase usually occurs when it is not economical to run the operations. This may be due to poor commodity prices or lack of demand for the commodity. The operation ceases production and processing but machinery is maintained and mines are kept free of water so that it can become operational at some time in the future. 
Minerals sector skills requirement: 
Oil  Gas skills requirement: 
Maintenance Technicians and Mechanical Fitters 
Process Technicians and Maintenance Technicians 
Closure and Rehabilitation Phase 
This phase occurs when the decision is made to close the operation permanently. All buildings and infrastructure are removed and the site is rehabilitated to return it to as close to natural state as practicable.  Page 14
Minerals sector skills requirement: 
Oil  Gas skills requirement: 
Mobile Plant Operators, Environment Officers, Environmental Drillers, etc. 
Environmental Drillers, Environmental/Marine Officers 
WORKFORCE STATISTICS 
The DMP reported employment in the mining sector peaking in October 2008 with a monthly average of 77,528. The global economic downturn led to a fall with a 2008–09 employment average of 71,329. 
In November 2008 many expansions projects were shelved and projects were downsized; deferred or placed on care and maintenance. By January 2009, average mining employment numbers had fallen to 68,692 (31,951 employees and 36,741 contractors), a decline of around 11% from October 2008. Between the peak in October 2008 and June 2009, total employment fell by approximately 9,100 jobs. However, employment in June 2009 was only 2,924 below July 2008 levels. 
Exploration employment for personnel working on greenfield sites for 2008–09 averaged 2338. 
31% of WA mining employees work in the Iron Ore sector, 19% in Gold mining, 18% in Nickel and 14% in Bauxite. 
. 0500010000150002000025000 Base MetalsBauxite ‐AluminaChromiteClaysCoalConstruction MaterialsDiamondsDimension StoneGoldHeavy Mineral SandsIndustrial Pegmatite … Iron OreLimestone –Lime sandManganese OreMineral/CompanyMolybdenumNickelPetroleum ProductsPhosphateRare EarthsSaltSilica ‐Silica SandSilverTalcTin ‐Tantalum ‐LithiumVanadiumVarious PortsAll Other Materials Average Number of Employees In The WA Minerals And Petroleum Industries2007 2008 
Employment in 5 commodities was not greatly affected by the global economic downturn and these included iron ore, gold, alumina, coal and petroleum extraction.  Page 15
Page 16 
. 
Workforce Demographics 
In 2008 the minerals sector workforce comprised 36 % tradespersons and related workers, 35 % semi-skilled workers (principally machinery operators and drivers), 10 % professionals, 9 % labourers, 5 % technicians and 5 % managers and administrators4. Over recent years the greatest growth has been in the technician and trades category. 
The majority of employees work full time, and their median age is 40 years compared with a median age for all industries of 37 years. However, coal sector employees are older on average than those in the metalliferous sector. 
Women comprise around 18% of the resource sector workforce compared to a national participation rate of 46%5 . However, women only represent 3% of all employees at mine sites, oil rigs and minerals processing operations. Some of the reasons for the industry not being attractive to females are the requirement by many companies to work away from families for extended periods of time (FIFO) and the perception that the work is hard and dirty. In the drilling sector the percentage of females is less than 1% which may be due to the additional issues of working with very small teams in isolated locations for long period of time. 
The minerals industry is the largest private sector employer of Indigenous people, with 5% of its direct workforce identifying as Indigenous. Most operations in remote and regional locations prefer 
4 NILS (2008). The Labour Force Outlook in the Australian Minerals Sector: 2009 to 2020. 
5 ABS (November 2009). 6291.0.55.003. Labour force Australia. 050001000015000200002500030000Employees By MineralAug‐07Jan‐08Feb‐08Mar‐08Apr‐08May‐08Jun‐08Jul‐08Aug‐08Sep‐08Oct‐08Nov‐080.050.0100.0150.0200.0 Feb‐2006Jun‐2006Oct‐2006Feb‐2007Jun‐2007Oct‐2007Feb‐2008Jun‐2008Oct‐2008Feb‐2009Employees (000) Gender Mix of WA Resources IndustryMalesFemalesTotal
Page 17 
local workers and are committed to increased employment of local Indigenous people who can meet their employability requirements. However, many Indigenous people located in these areas have low levels of literacy, numeracy and fitness for work attributes which precludes them from taking up training opportunities. 
With regards to age the minerals and petroleum industry tend to recruit mature age employees as there is a perception that age and safety behaviour are linked. With the exception of apprentices employees are typically 18 or more years old. As significant number (32%) are in the 25-34 year bracket and a similar number in the 35-44 years bracket. With 21.2% in the 45-54 year bracket and 11.3% in over 55 group. With the duration of training required for a petroleum process technician being around 5 years and an Engineer being 4 years (after 20012 UWA Engineering students may need 7 years) there is a need to plan ahead to cater for the 32.5% that can be expected to retire within the next 10 years 
Anecdotally, employee turnover in the minerals and energy sector is high. At some FIFO sites the turnover was as high as 30 % at the height of the last mining boom. The Australian Bureau of Statistics (ABS) reported that at February 2008 12% of mining workers had changed their employer in the previous 12 months. Unfortunately, data on the amount of labour “churn” as compared to labour moving to other industries or out of the workforce is very limited. 
In drilling employee turnover is high in companies, but personnel often stay within the industry once they pass the threshold of around four months. This is partly a reflection of the contractor role, as well as the nature of work. Much drilling is undertaken by drilling contractors and the contracts with resource companies can be short or long term contracts. Where contracts offered by the principal (usually a mine) are longer – e.g. where the drilling contractor has a 2-3 year contract, turnover of personnel is much lower as employers prefer to maintain people they have trained, and personnel prefer to stay on where the employer and the work suits them. 
Recording workforce demographics is not as wide spread in the resources sector as in the government sector and therefore the data provided is sourced from the ABS 6291.0.55.003 Labour Force, Australia, Detailed, Quarterly, Table 06 Employed persons by Industry Subdivision and Sex. 
Workforce Education Levels 
The 2006 ABS census data reports post school qualifications for the Western Australian mining employees as 48% having a Certificate I-IV level qualification, compared to 27% with a Bachelor degree and only 6% with a Postgraduate Degree. 
NCVER 2007 data shows that at a national level around 30% of minerals sector employees hold a diploma or above qualification (around 20 % have a bachelor degree or higher); 28 % hold a Certificate level III or IV qualification; 5 % hold a Certificate I or II level qualification; and 37 % have no identified qualification6. 
Since 2006 there has been effort made in promoting and the taking up of nationally recognised training and traineeships. This along with the increase in recruitment of interstate fly in fly personnel (not reflected as ABS data as data is based on State of residence) may mean that the following do not truly represent the industry in 2010. 
6 NCVER (2007). Mining: Industry  Training 2007; exploring the relationship between industry and the VET system. 0% 5% 10% 15% 20% 25% 30% 35% 15‐2425‐3435‐4445‐5455‐6465  OverAge Ditribution of Oil  Gas Employees and National Average June 2008NationalOil  Gas
02,0004,0006,0008,00010,00012,00014,000Qualifications held by WA Mining Employees 
Source: ABS Cat. 2068.0 0% 10% 20% 30% 40% 50% 60% Postgraduate DegreeGraduate Diploma  Graduate CertificateBachelor DegreeAdvanced Dip  DiplomaCertificateNot stated% of Personnel Reporting a Qualifcation 
Source: ABS Cat. 2068.0 
Current Trends in Staffing Patterns 
There is a distinction to be drawn between ‘labour shortage’, or a lack of new entry level recruits, and a ‘skills shortage’ or lack of qualified trades, technicians and professional people. The resources sector has suffered from skills shortages rather than labour shortages due to their ability to pay wages that will draw employees from other industries. On the other hand the drilling sector compete with mining, construction and defence for new entrants and does experience labour shortages. 
Accurate labour demand forecasts are difficult to obtain due to a number of factors, including the reluctance of enterprises to release commercially sensitive data and the potential for ‘double counting’ if there is overlap between contractors’ and mining companies’ data.  Page 18
01000020000300004000050000 1987198819891990199119921993199419951996199719981999200020012002200320042005200620072008 Mining EmploymentEmployeesContractors 
Short term contracting is the norm in the construction phase of a project. Contracting is strategy to provide workforce flexibility for projects with finite start and end dates, different workforce needs at different stages of the construction process. 
Resource sector project construction and ‘shut down maintenance’ work requires particular skills and flexibility which has resulted in experienced individuals being particularly sought by both service companies. 
There has been an increase in the use of contractors even during operational phases with mining services being contracted out. Post global economic downturn the use of contractors fell in some industry sectors reflecting the dynamic nature of this employment method. 0% 10% 20% 30% 40% 50% 60% 70% % of Contractors 
NATIONAL COMPETENCY STANDARDS AND NATIONAL TRAINING PACKAGES 
Competency based training has been utilised by the resources industry for many years with many companies providing ongoing in-house training to operators and university graduates. 
For many years the national competency standards have been recognised as a benchmark and much in-house (non-nationally recognised) training is aligned to the national standards. Industry’s understanding of the training package and its associated units of competency, qualification structure and assessment guidelines continues to grow. Experience with and the utilisation of the VET sector and nationally recognised training is also growing. 
The attainment of qualifications is not seen as a major focus for the resources industry but rather training occurs with the aim of achieving an increase in safe work practices, improvements in production rates and staff retention. 
Generally the resources industry does not access the public funding for training; some of this relates to the perceived inflexibility of the training system; the industry mainly operates out of remote and regional areas and a large part of the resources industry is focussed on skill sets as opposed to full qualifications; this has resulted in the need to fund their own development programs. 
 Page 19
Page 20 
Industry supported the recent rationalisation of the BCC03; RII06; MNM05; DRT03; MNC04 and MNQ03 training packages to form the Resources and Infrastructure (RII09) training package. 
INDUSTRY OCCUPATIONAL OVERVIEW 
The following are typical job roles found in the resources sector (P=petroleum, M=mining, C=construction). 
Job Role 
Qualifications 
P 
M 
C 
Miners – 
Open Cut or Surface Mining# 
Certificate II in Surface Extraction Operations 
Certificate III in Surface Extraction Operations 
Certificate IV in Surface Extraction Operations 
Diploma of Surface Operations Management 
9 
Miners – 
Underground Mining# 
Certificate II in Underground Metalliferous Mining 
Certificate III in Underground Metalliferous Mining 
Certificate IV in Metalliferous Mining Operations (Underground) 
Diploma of Underground Metalliferous Mining Management 
9 
Miners – 
Coal Mining# 
Certificate III in Surface Extraction Operations 
Certificate IV in Surface Extraction Operations 
Diploma of Surface Operations Management 
Certificate IV in Surface Coal Mining (Open Cut Examiner 
9 
Mining - Managers and Supervisors# 
Advanced Diploma of Metalliferous Mining 
Advanced Diploma of Extractive Industries Management 
Advanced Diploma of Surface Coal Mining 
9 
Process Operators# 
Certificate II in Resource Processing 
Certificate III in Resource Processing 
Certificate IV in Resource Processing 
Diploma of Minerals Processing 
9 
Production Technicians# 
Certificate III in Process Plant Operations + skill sets 
Certificate IV in Process Plant Technology 
Diploma of Process Plant Technology 
Advanced Diploma of Process Plant Technology 
Maintenance Technicians and Mechanical Trades* 
Certificate III in Engineering – Mechanical (Maintenance Diesel Fitting) 
9 
Metal Trades* 
9 
Electrical And Instrumentation Trades* 
Certificate III in Instrumentation and Control 
Certificate III in Engineering – Electrical/Electronic Trade 
Diploma of Engineering – Advanced Trade (Mechanical and Electrical) 
Certificate III in Electrotechnology Electrician 
Certificate III in Instrumentation and Control 
Certificate IV in Electrical Instrumentation 
9 
9 
Pipeline Technicians# 
9 
Control Room Technicians/Operators# 
Certificate IV in Processing 
9 
Administration* 
Certificate III  IV in Business 
9 
9 
Draftspersons* 
Engineering Drafting 
9 
Drillers, Drillers’ Assistants, 
Certificate II in Mining Field/Exploration Operations 
Certificate II in Drilling Operations 
Certificate III in Drilling Operations 
Certificate IV in Drilling Operations 
9 
Offshore Driller, Roustabout, Derrickman, Floorman 
Certificate II in Drilling Oil/Gas (Off shore) 
Certificate II in Drilling Oil/Gas (On shore) 
Certificate III in Drilling Oil/Gas (Off shore). 
Certificate III in Drilling Oil/Gas (On shore) 
Certificate IV in Drilling Oil/Gas (Off shore). 
9
Certificate IV in Drilling Oil/Gas (On shore). 
Drill Supervisors 
Advanced Diploma of Drilling Management 
Diploma of Drilling Operations 
Advanced Diploma of Drilling Management 
9 
9 
Offshore Driller Supervisors, Toolpusher 
Diploma of Drilling Oil/Gas (Off shore) 
Diploma of Drilling Oil/Gas (On shore) 
Hospitality – Catering and Cleaning* 
Certificate III in Commercial Cookery 
9 
9 
Laboratory Technicians* 
Certificate IV in Laboratory Operations 
9 
9 
Medics  Paramedics 
Bachelor of Nursing 
Bachelor of Health Science - Paramedic 
9 
9 
Mobile Plant Operators* 
Front End Loader, Crane, Forklift, Skid-steer, Bogger, IT Carrier, Backhoe 
9 
9 
Hoist Operator, Winder Driver (underground mines only) 
Winding Engine Driver’s Certificate Class I  II examinations by DMP 
9 
9 
Truck Drivers*# 
HC and/or MC class licences 
9 
9 
Project Managers* 
Diploma in Project Management 
9 
9 
9 
Front line supervisors 
Certificate IV in Frontline Management 
9 
9 
9 
Warehousing and Logistics* 
Certificate III in Transport and Logistics 
Certificate IV in Warehousing and Logistics 
Bachelor of Business - Logistics and Supply Chain Management * 
9 
9 
9 
Surveyors* 
Bachelor of Applied Science - Surveying 
9 
9 
Mines Rescue Team Member# 
Certificate III in Mine Emergency Response and Rescue 
9 
OHS Advisors and Managers 
Certificate IV in Occupational Health and Safety 
9 
9 
9 
Environmentalists* 
Bachelor of Applied Science - Environmental Management 
Bachelor of Applied Science - Marine Environment 
9 
9 
9 
Geologists and Geophysicists* 
Bachelor of Applied Science - Geology 
Bachelor of Applied Geographical Information Systems 
9 
9 
Metallurgists* 
Metallurgical Technician* 
Bachelor of Applied Science - Metallurgy 
9 
Core/Corefarm Technicians* 
9 
9 
Commercial Analysts / Accountants* 
Bachelor of Arts / Bachelor of Business - Accounting 
9 
9 
9 
Ballast Controller 
Bachelor of Arts / Bachelor of Business - Accounting 
9 
Deep Sea Diver 
9 
Integrated Rating 
Integrated Rating Certificate, Offshore crane operators licence, Scaffolding, dogging and rigging 
9 
Radio Operator* 
Radio Operator Licence, Sea Rescue, 
9 
Remote Operated Vehicle (ROV) Operator 
ROV Operator Certificate 
9 
Human resources * 
Bachelor of Business - Human Resource Management 
9 
9 
9 
Marketing * 
Bachelor of Business - Marketing 
9 
9 
Public and Media Relations * 
Bachelor of Business - Public Relations 
Bachelor of Media and Communication 
9 
9 
 Page 21
Page 22 
Lawyers  Contracts Management * 
Bachelor of Laws 
9 
9 
Engineers  Scientists General 
Bachelor of Civil and Environmental Engineering 
Bachelor of Civil Engineering 
Bachelor of Engineering 
Bachelor of Engineering – Chemical 
Bachelor of Engineering - Civil - Geotechnical 
Bachelor of Engineering - Civil – Project Engineering and Management 
Bachelor of Engineering - Surveying and Geoinformation Systems 
Bachelor of Science - Geology and Geophysics 
9 
9 
Engineers Mining 
Bachelor of Engineering - Mining 
Bachelor of Science - Extractive Metallurgy 
9 
Engineers Petroleum 
Bachelor of Engineering - Petroleum 
Bachelor of Engineering – Subsea 
9 
Radiation Safety Officers 
Bachelor of Science degree 
9 
Ventilation Officers (Underground mines) 
Surface Ventilation Technicians Course 
Certificate IV in Surface Ventilation Officer 
Advanced Diploma in Mine Ventilation 
9 
Underground Supervisor 
Underground supervisor’s certificate examination by DMP 
Passed both the mining practice and the mining law examinations set by the DMP or 
Degree, Diploma or Associate Diploma in Mining Engineering 
Quarry Manager 
Quarry manager’s certificate examination by DMP 
Diploma in Mining or Engineering 
Associate Diploma in Surface Mining 
Degree or Diploma in Geology 
Bachelor of Engineering in Mining 
Mine Manager 
First class mine manager’s certificate - examination by DMP 
Bachelor of Engineering in Mining 
#denotes job roles which training as traditionally been provided on the job. 
*denotes job roles which are not seen as areas of skill shortage either because the sector can successfully recruit from other industries or there is adequate supply. 
FUTURE LABOUR DEMANDS 
The Pilbara Industry's Community Council’s April 2010 report ‘Planning for resources growth in the Pilbara: revised employment  population projections to 2020’ has estimated the growth in employment in the mining sector for the Pilbara region up to 2020. 
Based on information available as at March 2010, total operational resource related employment in the Pilbara is projected to grow from some 19,000 in 2008 to some 47,000 in 2015, reaching 53,000+ by 2020. These totals include local jobs required to support direct employment in the Pilbara and FIFO positions but exclude construction workforce numbers which are shown separately. Residential employment increases by 28% between 2010 and 2015, from 15,900 to some 20,300, with growth moderating thereafter7. 
FIFO projections for the Pilbara region grow at a faster rate, increasing by 83% between 2010 and 2015 and by a further 23% to 2020. 
7 This moderation may be partly explained by company estimates not including expansion plans for later in the projection period.
01000020000300004000050000600002008201020152020Pilbara Resource Related Employment 2008‐2020ResidentalFIFOTotal 
In 2008 there was a majority of people employed under residential conditions but in 2010 the percentage of residential and FIFO employees is close to equal by 2020 it is expected that 66% of the workforce will be FIFO. By 2015 92% of FIFO workers will be in the iron ore sector. 
Residential 
FIFO 
2008 
66% 
34% 
2010 
51% 
49% 
2015 
42% 
58% 
2020 
38% 
62% 
Projected construction employment in the Pilbara is over 22,000 in 2010, peaking at some 28,000 in 2012 and dropping sharply away from 2015 onwards. These numbers are likely to be conservative because a number of companies have only chosen to include expansion/new projects at an advanced planning or approvals stage. Nearly all of these workers can be expected to be FIFO. 
CURRENT AND EMERGING SKILL / LABOUR GAPS 
Mineral and petroleum companies were asked to identify job roles which are hard to recruit due to an including: 
• S 
kills shortage prior to economic downturn, or 
• C 
urrent skills shortage; or 
• 
Inadequate sized pool of suitable candidates; or 
• 
Forecast strong demand which will likely lead to a skill shortage. 
Job Title 
Relevant Qualifications 
PROFESSIONAL ROLES 
Engineering and Science 
Engineers (all disciplines) 
Bachelor of Engineering 
Geologists 
Bachelor of Geology 
Geophysicists 
Bachelor of Geophysics 
Petrophysicists 
Bachelor of Geology, Bachelor of Geophysics or Petroleum Engineering 
Process Engineers 
Bachelor of Engineering 
Petroleum Engineer 
Bachelor of Engineering 
MSc degree in Reservoir or Petroleum Engineering 
Reservoir Engineer 
MSc degree in Reservoir or Petroleum Engineering 
Risk Engineer 
Bachelor of Engineering 
Master of Science Degree in Safety Engineering and Risk Management  Page 23
TECHNICAL ROLES 
Exploration and Drilling 
Drillers 
Certificate III in Drilling Operations 
Certificate III in Drilling Oil/Gas (Off shore). 
Certificate III in Drilling Oil/Gas (On shore) 
Certificate IV in Drilling Operations 
Certificate IV in Drilling Oil/Gas (Off shore). 
Certificate IV in Drilling Oil/Gas (On shore). 
Drillers’ assistants 
Certificate II in Drilling 
Certificate II in Drilling Operations 
Certificate II in Drilling Oil/Gas (Off shore) 
Certificate II in Drilling Oil/Gas (On shore) 
MAINTENANCE ROLES 
Maintenance Planners 
Maintenance Technicians and Mechanical Trade 
Certificate III in Engineering – Mechanical (Maintenance Diesel Fitting) 
Maintenance Engineer (on and offshore) 
Metal Trades* 
Metal Trades Apprentices 
Electrical And Instrumentation Trades* 
Electrical and Instrumentation Technicians 
Electrician 
Electricians (duel Trade) 
Instrumentation Electricians/ Fitters 
Certificate III in Instrumentation and Control 
Certificate III in engineering – Electrical/Electronic. 
Certificate III in Engineering – Electrical/Electronic Trade 
Diploma of Engineering – Advanced Trade (Mechanical and Electrical) 
Certificate III in Electrotechnology Electrician 
Certificate III in Instrumentation and Control 
Certificate IV in Electrical Instrumentation 
Electrical Team leaders  Supervisors 
Plant Mechanic 
PARAPROFESSIONAL ROLES 
Business Improvement Manager 
Contract Managers and Specialists 
Health and Safety Advisors and Specialists 
Certificate IV in Occupational Health and Safety 
Group Leaders (ie Front Line Supervisors) 
MARITIME ROLES 
Marine 1st Engineer 
Marine Engineer 
SPECIALIST ROLES 
Powerhouse Controllers 
Diploma of ESI Generation (Systems Operation) 
PROCESS CONTROL ROOM ROLES 
Production Area Central Control Room Role 
Production Area Process Role 
Production Area Utilities Role 
PRODUCTION TECHNICIANS 
Minerals Process Plant Operator 
Certificate III in Process Plant Operations + skill sets 
Process Technicians (Gas  Oil) 
Production Technicians# 
Certificate III in Process Plant Operations + skill sets 
Certificate IV in Process Plant Technology 
Diploma of Process Plant Technology 
Advanced Diploma of Process Plant Technology 
NON TECHNICAL ROLES 
Purchasing, Transport and Logistics 
Warehousing and Logistics Technicians 
Procurement Officers 
Miscellaneous 
 Page 24
Facility Security Officer Role 
Certificate III in Security Operations 
Road Train - Truck Drivers 
HC and/or MC class licences 
Train Drivers 
Certificate IV in Transport and Distribution (Rail Operations) 
Energy Skills Queensland identified six critical issues which they link to meeting skills and labour demand. 
Issue 
Affected Occupational Groups 
1 
. Critical shortfall in labour supply 
Professional, technical and non technical or unskilled groups. 
2 
. Critical shortfall in skills supply 
Professional, technical and non technical or unskilled groups. 
3. 
Potential for graduates not to be competent in meeting workplace requirements - occurs in bother the professional and technical occupational groupings. 
Professional and technical 
4. 
Inadequate capacity and capability of education and training organisation to respond to growth in demand for graduates. 
Professional and technical 
5. 
Off the shelf generic competency based training packages misaligned with industry needs. 
Technical 
6. 
Replacement demand – loss of skills, experience and knowledge dues to aging workforce. 
Professional and technical 
OPERATION CRITICAL JOB ROLES 
Mineral and petroleum companies were asked to identify job roles which if not filled would cause disruption to the meeting of core business - the following where identified. 
Maritime Skills 
Coxswain Role 
Maintenance Roles 
Marine 1st Engineer Role 
Crane Operator Role 
Marine Chief Engineer/Officer Role 
Electrical Supervisor 
Marine Engine Room Watchkeeper Role 
Electricians 
Marine Engineer Watchkeeper Role 
Instrumentation Electricians/ Fitters 
Marine Integrated Ratings Role 
Mechanical Role 
Marine Master Role 
Permit Control Officer Role 
Marine Navigation Officer Role 
Recognised Person Electrical Role 
Marine Navigational Watchkeeper Role 
Senior Electrical Officer Role 
Medical and Emergency Response Roles 
Management and Planning 
Medic Assistant Role 
Mine / Quarry Manager 
Medic Role 
Petro physicist 
Emergency Coordinator Role 
Reservoir Engineer 
Emergency Team Leader Role 
Powerhouse Controller 
Emergency Team Member Role 
Emergency Commander Role 
Control Room Operators 
CCR Scribe Role 
Refinery Process Controller 
Facility Security Officer Role 
Mineral Central Control Room Role 
Fast Rescue Craft Role 
Fire  Rescue 
Operator Technician Roles 
Muster Checker Role 
Mineral Processing Technician / Plant Operator 
Muster Coordinator Role 
Refinery Process Technician 
Production Area Utilities Role 
Port and Shiploading Roles 
Hatch Officer 
Miscellaneous Roles 
Shiploader Operator 
Helicopter Landing Officer Role 
Train Drivers 
 Page 25
Page 26 
EMERGING OCCUPATIONS 
Uranium mining will require Radiation Safety Officers, who monitor radiation at mine sites and individuals must have a Bachelor of Science degree. 
With the increase in automation of mining activities one likely emerging occupation is that of Automation Technician. The most likely VET qualifications to provide some of the foundation skills and knowledge for this occupation are: 
• U 
EE30807 Certificate III in Electrotechnology Electrician 
• U 
EE31207 Certificate III in instrumentation and Control 
• 
MEM30405 Certificate III in Engineering – Electrical / Electronics 
• 
UEE30207 Certificate III in Computer Systems Equipment 
• 
UEE30907 Certificate III in Electronics and Communication 
• 
UEE40607 Certificate IV in Electrotechnology Systems Electrician 
• 
UEE40207 Certificate IV in Electrical Data and Voice Communication 
• 
UEE40907 Certificate IV in Industrial Electronics and Control 
• 
UEE40407 Certificate IV in Electrical Instrumentation 
• 
MMEM40105 Certificate IV in Engineering 
• 
UEE40107 Certificate IV in Computer Systems 
• 
UEE40707 Certificate IV in Electronics and Communication 
LNG is a relatively new industry to Australia (in large scale terms) with high technology and therefore a skills capability gap exists at a highly technical and senior level. 
DECLINING OCCUPATIONS 
• 
No declining occupations have been identified. 
Workforce Sources 
Prior to the 2008 global economic downturn the minerals and exploration sectors of Western Australia has experienced some difficulty in recruiting and retaining skilled personnel and this was impacting on expansion projects and immediate productivity.8 
The Petroleum industry has traditionally drawn on the national and global pool of petroleum and offshore drilling professionals to recruit personnel. Countries such as Norway, the UK, the Middle East and the USA are used to source professionals. 
The resources sector has a number of large development projects underway or planned. The construction phase of these projects will require significant number of skilled tradespersons and labours. 
Major investment projects in the under-construction category are dominated by iron ore and LNG projects. Major Western Australia projects include 
Project 
Investment 
Status 
Construction Workforce 
Operational Workforce 
Gorgon Joint Venture 
$43 billion 
Committed 
3500 
300 
Kimberley Browse LNG Precinct 
$20 billion 
Committed 
3500 
360 
Woodside’s Pluto Train 1 LNG Plant 
$12 billion 
Commenced 
4200 
200 
BHP Billiton’s Rapid Growth Project 5 
$5.3 billion 
Commenced 
Sino Iron’s Pellet Project 
$5.2 billion 
Commenced 
4000 
500 
Oakajee Port and Rail development 
$4 billion 
Committed 
Western Areas’ Flying Fox; Spotted Quoll and Lounge Lizard nickel projects 
$3.8 billion 
Committed 
Perdamen Chemical’s Coal to Urea Plant 
$3.7 billion 
Committed 
1500 
200 
Newmont’s Boddington gold  copper mine 
$3.7 billion 
Commenced 
1500 
650 
8 Chamber of Minerals and Energy, 2005, Sustainable Minerals Sector Workforce
Chevron’s Wheatstone LNG 
$3 billion 
Committed 
3000 
300 
BHP Billiton’s Rapid Growth Project 4 
$2.1 billion 
Committed 
3500 
Worsley Alumina’s refinery expansion 
$2.5 billion 
Commenced 
1500 
200 
Australia is a highly urbanised country with approximately 89% of the population living in towns of 1000 people or more. Over half of the population live in the five large coastal cities. Australian also has a relatively mobile population with 17% of the population moving on average each year. 
The combination of a preference for urban living and population mobility has led to migration away from the regional and remote areas. 
Much of Australia’s mineral wealth in located in the North West and Eastern Goldfields regions which are remote and considered harsh environments. While in the past mining companies have constructed residential towns in these locations it has become uneconomic to do so. Current practice has seen a reliance on long distance commuting (LDC), fly in fly out (FIFO), ship in ship out (SISO) and drive in drive out (DIDO), all of which have replaced township development with residential camp development. Residential camps and townships differ in that camps are used solely for the purpose of accommodating and feeding the workforce where as townships provided the buildings and social infrastructure for not only employees but their families and service providers. 
FLY IN FLY OUT (FIFO) 
Fly-in, fly-out (FIFO) began in the offshore petroleum industry in the late 1940s. There was a rapid grown in FIFO in the 1970 and is largely driven by the expansion of remote resource projects. 
Whilst there is a strong business case for resource companies to employ local labour, FIFO employment is likely to be an increasing feature of resource sector operations. The high proportion of FIFO workers is due to a number of factors, including the lack of suitably skilled local people; lack of family accommodation either available in the local community or provided by companies; and the desire of many mine personnel and their families to live in areas with greater amenities such as cities. 
From the beginning of the resources industry to the 1950s numerous small mining towns were established. These towns were built as a response to the poor capacity and reliability of the transportation systems to delivery employees; goods and services. 
Historically, mining operations employed a township model. In the 1960s to mid 1980s the States mineral boom relied on residential workforces. The development and management of many of these town sites were funded by the resource companies. Late in this period company towns became part of the local government structure. From the mid 1980s to the present economic reform and a response to global competiveness pressures the establishment of town sites was replaced by FIFO practices. 
Throughout the world FIFO has replaced the development of residential townships as a means of accommodating employees (professional, skilled and unskilled) for remote resource operations. The last residential mining town constructed in Australia was Olympic Dam in South Australia in the mid 1980s. 
In the mid 1980s FIFO began to emerge as a cost-effective way to address skills shortages, to increase efficiency, and to avoid some of the social problems that can arise from developing a ‘mining town’. The growth of the resources sector since that time and the attendant pressure on local housing supply has led to an increasing reliance on long-distance commuting. 
It must also be recognised that FIFO provides opportunities for jobseekers living in communities where there are few local employment opportunities, thus contributing to the economy of those communities as well as the communities at the mine sites. FIFO is also appropriate for construction and expansion projects that initially require large numbers of people for a limited period of time. 
About 50 % of the mining operations in Western Australia use FIFO. Drive-in; drive-out (DIDO) is a factor of the relative proximity of resource sector operations to large regional centres with pre- existing levels of social infrastructure, providing the necessary amenity for relatively large populations to develop with necessary economic stimulus from government and employment growth from industry. 
 Page 27
FIFO rosters vary but common patterns are two weeks on, one week off, or nine days on with five days off. Domestic commute rosters are typically 2 days, 2 nights and 5 days off. 12 hour shifts are the common practice. Whilst many workers enjoy FIFO and the benefits it brings, there is also a higher than normal turnover in the FIFO workforce as some workers find the lifestyle difficult to maintain as family commitments increase. 
FIFO will continue to be a response to local skills shortages. In reality, even if the issues relating to increasing participation of all unemployed and underemployed people, including women, Indigenous people, and older workers, are addressed, many remote and regional areas where the minerals and energy sector operates do not have a large enough local population of working age to meet the needs of the minerals and energy sector. In a nation with a diversity of regional growth, it is imperative that there be a balanced approach between FIFO and local community development. 
In 2001 Professor Keith Storey identified factors inhibiting the development of new townships in remote locations including: 
• 
Costs of building and operating new resource towns; 
• 
Absence of government financial support for township development; 
• 
Longer lead time for new town approvals and construction; 
• 
Environmental implications of new town construction; 
• 
Administrative implications of managing a town; 
• 
Increased costs associated with town closure once the resources have been exhausted or the operation is no longer viable. 
Professor storey also identified the following as factors encouraging FIFO: 
• 
Improved quality if communications; 
• 
Improvements in the safety; reliability and cost of air travel; 
• 
Lover turnover and absenteeism levels in FIFO personnel; 
• 
Preference for metropolitan over rural living by workers and their families 
With inadequate manpower within Western Australia’s regional areas most remote mine sites rely on fly in fly out. Employees who participate in fly in fly out are sourced primarily from Perth and Geraldton with others being sourced from around Australia’s major centres. 
Public awareness campaigns are required to raise awareness of lifestyle, job and career opportunities in the minerals and energy sector, especially in Western Australia where east to west migration is problematic. However, there are some key factors which mitigate against mobility to areas of minerals and energy operation, including housing affordability, for example in Perth and regional Western Australia; housing availability, for example in the Pilbara and other regional centres; regional infrastructure issues; schooling and childcare availability; and concerns or lack of knowledge about family and social impacts of intra/interstate migration or a FIFO lifestyle. 
Increased labour mobility for apprentices requires additional infrastructure and on-site support, particularly for young apprentices working away from home. In addition, apprenticeship training models must be structured to take account of rosters and travel while maintaining the requirements of on and off-the-job training within operational imperatives of enterprises. 
SOURCING EMPLOYEES FROM OVERSEAS 
The resources industry has experienced difficulty in recruiting qualified and experienced professional in a number of areas and has relied on Subclass 457 BUSINESS (LONG STAY) Visas to recruit personnel from overseas. The traditional source countries for migrants in the minerals industry have been the United Kingdom, North America, New Zealand and South Africa. Professionals that have been sourced from overseas include geologists, mining engineers, geophysics, mechanical engineering technician, engineering manager, civil engineer, mechanical engineer and metal fabricators. 
The petroleum industry sources its professional migrants from Scotland, Norway and other petroleum producing counties. Professions sought include petroleum engineer, reservoir engineers, subsea engineers and ship's engineers. 
The Department of Immigrations and Citizenship reports the current number of 457 visa holders in Western Australia as: 
• 
3300 in the mining 
• 
290 transport and warehousing  Page 28
• 
40 professional; scientific and technical 
• 
980 accommodation and food services 
There has been a reduction in the number of Subclass 457 Business (Long Stay) visa applications during the last six months but the following number of applications have occurs. 
Sponsor Industry 
2009-10 to 31 /01/10 
Mining 
810 
Professional; Scientific and Technical 
20 
Accommodation and Food Services 
100 
Engineering - Civil 
80 
Primary visa applications lodged in November 2009 were 46% lower than November 2008. However; applications were 14% higher than October 2009. 
Application rates are steadily rising towards the levels prior to 14 September 2009 when the Migration Legislation Amendment (Worker Protection) Act 2008 was introduced. Primary visa grants in November 2009 were 43% lower than November 2008. However; grants were 21% higher than October 2009. 
The number of primary visa holders in Australia was 12% lower at the end of November 2009 compared to February 2009; when there was a peak of Subclass 457 primary visa holders in Australia. 
Application rates in the Subclass 457 Business (Long Stay) Visa at the end of the 2008-09 program year have been significantly lower than those of the corresponding period in the 2007-08 program year; reflecting the different economic conditions of the 2008-09 program year compared to the previous year. 
The number of primary Subclass 457 visa applications lodged in June 2009 was 45% lower than June 2008; when there was a peak of 6270 primary applications lodged. Applications in June 2009 were 38% lower than September 2008. There was a slight increase (6%) in the total number of primary Subclass 457 visa applications lodged in June 2009 compared to May 2009. 
The number of Subclass 457 primary visa applications lodged in November 2009 was 46% lower than November 2008; but was 14% higher than October 2009. 
There was a decline in visa application rates in September and October 2009 compared with previous months due in part to the introduction of the Migration Legislation Amendment (Worker Protection) Act 2008 on 14 September 2009 and the new requirements. However; on a week-by week basis; application rates have been steadily increasing throughout October and November 2009 as employers become familiar with the new requirements. The following table contains Migration Program Outcomes for 2005-06 to 2008-09 and Planning Levels for 2009-10. 
Employer Sponsored 
15,230 
16,590 
23,760 
38,030 
35,000 
Skilled Independent 
49,860 
54,180 
5, 890 
44,590 
41,600 
State/Territory Sponsored 
8,020 
6,930 
7,530 
14, 060 
11,200 
Skilled Australian Sponsored 
19,060 
1,4170 
14,580 
10,500 
12,300 
Distinguished Talent 
100 
230 
210 
200 
200 
Business Skills 
5,060 
5,840 
6,570 
7,400 
7,800 
Total 
97,340 
97,920 
108,540 
114,780 
108,100 
Employer Sponsored Immigration 
Demand in the Employer Sponsored immigration increased from 21,023 lodgements in 2006-07; to 28,866 in 2007-08 and 42,049 in 2008-09. 
The Employer Sponsored category outcome for 2008-09 was 38,026 an increase of 60.0% (14,264 places) on 2007-2008 year. 
This outcome is comprised of three components: 
1 
. Employer Nomination Scheme (ENS) with an outcome of 27,150. 
2 
. Regional Sponsored Migration Scheme (RSMS) with an outcome of 8,811. 
3. 
Labour Agreement (LA) with an outcome of 2,065.  Page 29
The 2008-09 Employer Sponsored outcomes now comprises 33.1% of the Skill Stream compared to 21.9% in 2007-08 and 16.9% in 2006-07. 
Demand in this category is high and; accordingly; the planning level for 2008-09 was increased from an initial level of 28,000 to a revised level of 37,080. This compares to 22,800 in 2007-08. As at 30 June 2009; there were 12,287 on hand applications for visas in the Employer Sponsored category; with an average of 3,500 applications received every month (2,400 applications per month in 2007- 08). The continuation of this high number of applications is crucial to the delivery of the 2009-10 planning level of 35,000. 
Barriers to Employment 
For many unemployed, underemployed, females and indigenous individuals the barriers to employment in the minerals and energy sector include the lack of foundation language, literacy and numeracy skills; the lack of employability skills such as communication skills, teamwork, problem- solving, planning and self-management as well as a general lack of fitness for work. For many the lack of basic education or lack of local training opportunities reduces their ability to gain the skills needed for the minerals sector workforce 
To work in the resources sector the following are pre-requite and therefore may be considered by many as barriers to entry into the industry. 
1. 
Fit for work – a pre-employment medical fitness examination is usually required as is a drug screen. 
2. 
The ability to read and write English 
3. 
Colour blindness may limit employment opportunities 
4. 
Minimum age of 18 years unless an apprentice. 
Many prescription drugs are not allowed to be used by resource employees and this along with ongoing drug and alcohol testing may prohibit an individual from obtaining or retention of employment. 
The lack of an industry recognised national entry-level qualification impacts on the ability to identify pathways into the sector, resulting in examples of training being undertaken with no employment outcome. This is sometimes due to the lack of industry relevant work experience and working conditions during training. The lack of employment outcomes frustrates jobseekers, training providers and employers. An understanding of the way the minerals and energy sector operate, their skills needs and their recruitment practices is necessary for any entry level training to be considered as relevant and appropriate by employers. 
Although mine sites prefer qualified and experienced personnel; during skills shortages most will take on unskilled personnel and train them as equipment operators, miners or process plant operators. Individuals who have obtained mobile plant and heavy vehicle licences as well as WorkSafe tickets for conducting high risk work are often looked favourably upon over persons without relevant tickets. 
WHAT MAKES EMPLOYMENT LESS ATTRACTIVE? 
Many people choose not to seek employment in the resources sector, particularly if it involves relocating from a metropolitan area to a regional area or Interstate or if moving from another industry sector. There are financial barriers to relocation to remote and regional areas and concerns over return on investment and affects on the family. 
The minerals sector has a culture of full-time work and long hours also impacts on its ability to attract and retain people. Ten to twelve hour days and rosters for anywhere from 5 days to 3 weeks can be found. 
Fly in fly out (FIFO) employment is becoming the main method of employment for many remote operations and this requires employees to be transported to the exploration site, mine site or platform for the duration of their swing. A swing may consist from 5 to 21 days onsite followed by a period of time when employees are transported back to a major centre/airport for a period of rest and recreation with their family. 
Some conditions at fly in fly out sites make working in the industry unattractive. 
• F 
ear of flying 
Helicopters and small planes are often used to transport personnel to site.  Page 30
WA Resources Industry Environmental Scan Outlines Skills & Labour Demands

More Related Content

Similar to WA Resources Industry Environmental Scan Outlines Skills & Labour Demands

November 2010 ritc exploration and drilling industry workforce development plan
November 2010 ritc exploration and drilling industry workforce development planNovember 2010 ritc exploration and drilling industry workforce development plan
November 2010 ritc exploration and drilling industry workforce development planRITCWA
 
November 2010 ritc gas and oil industry workforce development plan
November 2010 ritc gas and oil industry workforce development planNovember 2010 ritc gas and oil industry workforce development plan
November 2010 ritc gas and oil industry workforce development planRITCWA
 
Laboratory operations workforce development plan oct 2010
Laboratory operations workforce development plan oct 2010Laboratory operations workforce development plan oct 2010
Laboratory operations workforce development plan oct 2010RITCWA
 
100430 ps ritc process manufacturing environmental scan
100430 ps ritc process manufacturing environmental scan100430 ps ritc process manufacturing environmental scan
100430 ps ritc process manufacturing environmental scanRITCWA
 
Lithium Valley - Main Report
Lithium Valley - Main Report Lithium Valley - Main Report
Lithium Valley - Main Report Johnny Ioannou
 
130103 final report - rise of the machines ritc view final jan 2013
130103 final report - rise of the machines ritc view final jan 2013130103 final report - rise of the machines ritc view final jan 2013
130103 final report - rise of the machines ritc view final jan 2013RITCWA
 
Non metallic mineral products workforce development plan oct 2010 (1)
Non metallic mineral products  workforce development plan oct 2010 (1)Non metallic mineral products  workforce development plan oct 2010 (1)
Non metallic mineral products workforce development plan oct 2010 (1)RITCWA
 
Non metallic mineral products workforce development plan oct 2010
Non metallic mineral products  workforce development plan oct 2010Non metallic mineral products  workforce development plan oct 2010
Non metallic mineral products workforce development plan oct 2010RITCWA
 
Petroleum refining chemical fertiliser explosives workforce development plan ...
Petroleum refining chemical fertiliser explosives workforce development plan ...Petroleum refining chemical fertiliser explosives workforce development plan ...
Petroleum refining chemical fertiliser explosives workforce development plan ...RITCWA
 
Work-related traumatic injury fatalities in Western Australia 2011-12 to 2020...
Work-related traumatic injury fatalities in Western Australia 2011-12 to 2020...Work-related traumatic injury fatalities in Western Australia 2011-12 to 2020...
Work-related traumatic injury fatalities in Western Australia 2011-12 to 2020...myosh team
 
Polymer and rubber manufacturing workforce development plan oct 2010
Polymer and rubber manufacturing workforce development plan oct 2010Polymer and rubber manufacturing workforce development plan oct 2010
Polymer and rubber manufacturing workforce development plan oct 2010RITCWA
 
Sheepmeat-National-RD-and-E-Strategy
Sheepmeat-National-RD-and-E-StrategySheepmeat-National-RD-and-E-Strategy
Sheepmeat-National-RD-and-E-StrategyAngus Hobson
 
100601 ps nrset final report - resourcing the future july 2010
100601 ps nrset final report - resourcing the future july 2010100601 ps nrset final report - resourcing the future july 2010
100601 ps nrset final report - resourcing the future july 2010RITCWA
 
Solar powering your community, a guide for local governments
Solar powering your community, a guide for local governmentsSolar powering your community, a guide for local governments
Solar powering your community, a guide for local governmentsJustin Bean
 

Similar to WA Resources Industry Environmental Scan Outlines Skills & Labour Demands (20)

November 2010 ritc exploration and drilling industry workforce development plan
November 2010 ritc exploration and drilling industry workforce development planNovember 2010 ritc exploration and drilling industry workforce development plan
November 2010 ritc exploration and drilling industry workforce development plan
 
November 2010 ritc gas and oil industry workforce development plan
November 2010 ritc gas and oil industry workforce development planNovember 2010 ritc gas and oil industry workforce development plan
November 2010 ritc gas and oil industry workforce development plan
 
Laboratory operations workforce development plan oct 2010
Laboratory operations workforce development plan oct 2010Laboratory operations workforce development plan oct 2010
Laboratory operations workforce development plan oct 2010
 
100430 ps ritc process manufacturing environmental scan
100430 ps ritc process manufacturing environmental scan100430 ps ritc process manufacturing environmental scan
100430 ps ritc process manufacturing environmental scan
 
Crcif - Irrigation futures
Crcif  - Irrigation futuresCrcif  - Irrigation futures
Crcif - Irrigation futures
 
Lithium Valley - Main Report
Lithium Valley - Main Report Lithium Valley - Main Report
Lithium Valley - Main Report
 
130103 final report - rise of the machines ritc view final jan 2013
130103 final report - rise of the machines ritc view final jan 2013130103 final report - rise of the machines ritc view final jan 2013
130103 final report - rise of the machines ritc view final jan 2013
 
Non metallic mineral products workforce development plan oct 2010 (1)
Non metallic mineral products  workforce development plan oct 2010 (1)Non metallic mineral products  workforce development plan oct 2010 (1)
Non metallic mineral products workforce development plan oct 2010 (1)
 
Non metallic mineral products workforce development plan oct 2010
Non metallic mineral products  workforce development plan oct 2010Non metallic mineral products  workforce development plan oct 2010
Non metallic mineral products workforce development plan oct 2010
 
Petroleum refining chemical fertiliser explosives workforce development plan ...
Petroleum refining chemical fertiliser explosives workforce development plan ...Petroleum refining chemical fertiliser explosives workforce development plan ...
Petroleum refining chemical fertiliser explosives workforce development plan ...
 
CSIRO Energy Resources Report
CSIRO Energy Resources ReportCSIRO Energy Resources Report
CSIRO Energy Resources Report
 
CSIRO Energy Resources Report
CSIRO Energy Resources ReportCSIRO Energy Resources Report
CSIRO Energy Resources Report
 
CSIRO: Australian attitudes toward mining
CSIRO: Australian attitudes toward miningCSIRO: Australian attitudes toward mining
CSIRO: Australian attitudes toward mining
 
Work-related traumatic injury fatalities in Western Australia 2011-12 to 2020...
Work-related traumatic injury fatalities in Western Australia 2011-12 to 2020...Work-related traumatic injury fatalities in Western Australia 2011-12 to 2020...
Work-related traumatic injury fatalities in Western Australia 2011-12 to 2020...
 
Polymer and rubber manufacturing workforce development plan oct 2010
Polymer and rubber manufacturing workforce development plan oct 2010Polymer and rubber manufacturing workforce development plan oct 2010
Polymer and rubber manufacturing workforce development plan oct 2010
 
Grants in Australia
Grants in AustraliaGrants in Australia
Grants in Australia
 
Shipbreaking
ShipbreakingShipbreaking
Shipbreaking
 
Sheepmeat-National-RD-and-E-Strategy
Sheepmeat-National-RD-and-E-StrategySheepmeat-National-RD-and-E-Strategy
Sheepmeat-National-RD-and-E-Strategy
 
100601 ps nrset final report - resourcing the future july 2010
100601 ps nrset final report - resourcing the future july 2010100601 ps nrset final report - resourcing the future july 2010
100601 ps nrset final report - resourcing the future july 2010
 
Solar powering your community, a guide for local governments
Solar powering your community, a guide for local governmentsSolar powering your community, a guide for local governments
Solar powering your community, a guide for local governments
 

More from RITCWA

140627 ps-ritc-seares final report submissionv0.2
140627 ps-ritc-seares final report submissionv0.2140627 ps-ritc-seares final report submissionv0.2
140627 ps-ritc-seares final report submissionv0.2RITCWA
 
Ritc submission to awpa august 2012
Ritc submission to awpa august 2012Ritc submission to awpa august 2012
Ritc submission to awpa august 2012RITCWA
 
130103 executive summary - rise of the machines ritc view final jan 2013
130103 executive summary - rise of the machines ritc view final jan 2013130103 executive summary - rise of the machines ritc view final jan 2013
130103 executive summary - rise of the machines ritc view final jan 2013RITCWA
 
140128 ps-ritc final reference guide
140128 ps-ritc final reference guide140128 ps-ritc final reference guide
140128 ps-ritc final reference guideRITCWA
 
120829 ps-ritc vet stakeholder map v6
120829 ps-ritc vet stakeholder map v6120829 ps-ritc vet stakeholder map v6
120829 ps-ritc vet stakeholder map v6RITCWA
 
110906 ps-ritc-skills australia interim report resources industry
110906 ps-ritc-skills australia interim report resources industry110906 ps-ritc-skills australia interim report resources industry
110906 ps-ritc-skills australia interim report resources industryRITCWA
 
110503 ps-skills prosperity roadmap report
110503 ps-skills prosperity roadmap report110503 ps-skills prosperity roadmap report
110503 ps-skills prosperity roadmap reportRITCWA
 
110905 ps-ritc-apprenticeshipsforthe21st centuryexpertpanel
110905 ps-ritc-apprenticeshipsforthe21st centuryexpertpanel110905 ps-ritc-apprenticeshipsforthe21st centuryexpertpanel
110905 ps-ritc-apprenticeshipsforthe21st centuryexpertpanelRITCWA
 
110906 ps-ritc-2010 australian workforce futures
110906 ps-ritc-2010 australian workforce futures110906 ps-ritc-2010 australian workforce futures
110906 ps-ritc-2010 australian workforce futuresRITCWA
 
110916 ps-ritc-skilling wa exec summary
110916 ps-ritc-skilling wa exec summary110916 ps-ritc-skilling wa exec summary
110916 ps-ritc-skilling wa exec summaryRITCWA
 
110905 ps-ritc-training wa
110905 ps-ritc-training wa110905 ps-ritc-training wa
110905 ps-ritc-training waRITCWA
 
110916 ps-ritc-wa skilled migration strategy
110916 ps-ritc-wa skilled migration strategy110916 ps-ritc-wa skilled migration strategy
110916 ps-ritc-wa skilled migration strategyRITCWA
 
110916 ps-ritc-mining the truth
110916 ps-ritc-mining the truth110916 ps-ritc-mining the truth
110916 ps-ritc-mining the truthRITCWA
 
098 eslake rba_productivity_august-2011
098 eslake rba_productivity_august-2011098 eslake rba_productivity_august-2011
098 eslake rba_productivity_august-2011RITCWA
 
110906 ps-ritc-skills australia interim report resources industry
110906 ps-ritc-skills australia interim report resources industry110906 ps-ritc-skills australia interim report resources industry
110906 ps-ritc-skills australia interim report resources industryRITCWA
 
110503 ps-skills prosperity roadmap report
110503 ps-skills prosperity roadmap report110503 ps-skills prosperity roadmap report
110503 ps-skills prosperity roadmap reportRITCWA
 
Skills utilisation-research-report-15-may-2012
Skills utilisation-research-report-15-may-2012Skills utilisation-research-report-15-may-2012
Skills utilisation-research-report-15-may-2012RITCWA
 
Future focus-australias-skills-and-workforce-development-needs-discussion-paper
Future focus-australias-skills-and-workforce-development-needs-discussion-paperFuture focus-australias-skills-and-workforce-development-needs-discussion-paper
Future focus-australias-skills-and-workforce-development-needs-discussion-paperRITCWA
 

More from RITCWA (18)

140627 ps-ritc-seares final report submissionv0.2
140627 ps-ritc-seares final report submissionv0.2140627 ps-ritc-seares final report submissionv0.2
140627 ps-ritc-seares final report submissionv0.2
 
Ritc submission to awpa august 2012
Ritc submission to awpa august 2012Ritc submission to awpa august 2012
Ritc submission to awpa august 2012
 
130103 executive summary - rise of the machines ritc view final jan 2013
130103 executive summary - rise of the machines ritc view final jan 2013130103 executive summary - rise of the machines ritc view final jan 2013
130103 executive summary - rise of the machines ritc view final jan 2013
 
140128 ps-ritc final reference guide
140128 ps-ritc final reference guide140128 ps-ritc final reference guide
140128 ps-ritc final reference guide
 
120829 ps-ritc vet stakeholder map v6
120829 ps-ritc vet stakeholder map v6120829 ps-ritc vet stakeholder map v6
120829 ps-ritc vet stakeholder map v6
 
110906 ps-ritc-skills australia interim report resources industry
110906 ps-ritc-skills australia interim report resources industry110906 ps-ritc-skills australia interim report resources industry
110906 ps-ritc-skills australia interim report resources industry
 
110503 ps-skills prosperity roadmap report
110503 ps-skills prosperity roadmap report110503 ps-skills prosperity roadmap report
110503 ps-skills prosperity roadmap report
 
110905 ps-ritc-apprenticeshipsforthe21st centuryexpertpanel
110905 ps-ritc-apprenticeshipsforthe21st centuryexpertpanel110905 ps-ritc-apprenticeshipsforthe21st centuryexpertpanel
110905 ps-ritc-apprenticeshipsforthe21st centuryexpertpanel
 
110906 ps-ritc-2010 australian workforce futures
110906 ps-ritc-2010 australian workforce futures110906 ps-ritc-2010 australian workforce futures
110906 ps-ritc-2010 australian workforce futures
 
110916 ps-ritc-skilling wa exec summary
110916 ps-ritc-skilling wa exec summary110916 ps-ritc-skilling wa exec summary
110916 ps-ritc-skilling wa exec summary
 
110905 ps-ritc-training wa
110905 ps-ritc-training wa110905 ps-ritc-training wa
110905 ps-ritc-training wa
 
110916 ps-ritc-wa skilled migration strategy
110916 ps-ritc-wa skilled migration strategy110916 ps-ritc-wa skilled migration strategy
110916 ps-ritc-wa skilled migration strategy
 
110916 ps-ritc-mining the truth
110916 ps-ritc-mining the truth110916 ps-ritc-mining the truth
110916 ps-ritc-mining the truth
 
098 eslake rba_productivity_august-2011
098 eslake rba_productivity_august-2011098 eslake rba_productivity_august-2011
098 eslake rba_productivity_august-2011
 
110906 ps-ritc-skills australia interim report resources industry
110906 ps-ritc-skills australia interim report resources industry110906 ps-ritc-skills australia interim report resources industry
110906 ps-ritc-skills australia interim report resources industry
 
110503 ps-skills prosperity roadmap report
110503 ps-skills prosperity roadmap report110503 ps-skills prosperity roadmap report
110503 ps-skills prosperity roadmap report
 
Skills utilisation-research-report-15-may-2012
Skills utilisation-research-report-15-may-2012Skills utilisation-research-report-15-may-2012
Skills utilisation-research-report-15-may-2012
 
Future focus-australias-skills-and-workforce-development-needs-discussion-paper
Future focus-australias-skills-and-workforce-development-needs-discussion-paperFuture focus-australias-skills-and-workforce-development-needs-discussion-paper
Future focus-australias-skills-and-workforce-development-needs-discussion-paper
 

Recently uploaded

Lowrate Call Girls In Sector 18 Noida ❤️8860477959 Escorts 100% Genuine Servi...
Lowrate Call Girls In Sector 18 Noida ❤️8860477959 Escorts 100% Genuine Servi...Lowrate Call Girls In Sector 18 Noida ❤️8860477959 Escorts 100% Genuine Servi...
Lowrate Call Girls In Sector 18 Noida ❤️8860477959 Escorts 100% Genuine Servi...lizamodels9
 
Catalogue ONG NUOC PPR DE NHAT .pdf
Catalogue ONG NUOC PPR DE NHAT      .pdfCatalogue ONG NUOC PPR DE NHAT      .pdf
Catalogue ONG NUOC PPR DE NHAT .pdfOrient Homes
 
Regression analysis: Simple Linear Regression Multiple Linear Regression
Regression analysis:  Simple Linear Regression Multiple Linear RegressionRegression analysis:  Simple Linear Regression Multiple Linear Regression
Regression analysis: Simple Linear Regression Multiple Linear RegressionRavindra Nath Shukla
 
The CMO Survey - Highlights and Insights Report - Spring 2024
The CMO Survey - Highlights and Insights Report - Spring 2024The CMO Survey - Highlights and Insights Report - Spring 2024
The CMO Survey - Highlights and Insights Report - Spring 2024christinemoorman
 
Grateful 7 speech thanking everyone that has helped.pdf
Grateful 7 speech thanking everyone that has helped.pdfGrateful 7 speech thanking everyone that has helped.pdf
Grateful 7 speech thanking everyone that has helped.pdfPaul Menig
 
Keppel Ltd. 1Q 2024 Business Update Presentation Slides
Keppel Ltd. 1Q 2024 Business Update  Presentation SlidesKeppel Ltd. 1Q 2024 Business Update  Presentation Slides
Keppel Ltd. 1Q 2024 Business Update Presentation SlidesKeppelCorporation
 
Pharma Works Profile of Karan Communications
Pharma Works Profile of Karan CommunicationsPharma Works Profile of Karan Communications
Pharma Works Profile of Karan Communicationskarancommunications
 
Vip Dewas Call Girls #9907093804 Contact Number Escorts Service Dewas
Vip Dewas Call Girls #9907093804 Contact Number Escorts Service DewasVip Dewas Call Girls #9907093804 Contact Number Escorts Service Dewas
Vip Dewas Call Girls #9907093804 Contact Number Escorts Service Dewasmakika9823
 
Insurers' journeys to build a mastery in the IoT usage
Insurers' journeys to build a mastery in the IoT usageInsurers' journeys to build a mastery in the IoT usage
Insurers' journeys to build a mastery in the IoT usageMatteo Carbone
 
Vip Female Escorts Noida 9711199171 Greater Noida Escorts Service
Vip Female Escorts Noida 9711199171 Greater Noida Escorts ServiceVip Female Escorts Noida 9711199171 Greater Noida Escorts Service
Vip Female Escorts Noida 9711199171 Greater Noida Escorts Serviceankitnayak356677
 
/:Call Girls In Jaypee Siddharth - 5 Star Hotel New Delhi ➥9990211544 Top Esc...
/:Call Girls In Jaypee Siddharth - 5 Star Hotel New Delhi ➥9990211544 Top Esc.../:Call Girls In Jaypee Siddharth - 5 Star Hotel New Delhi ➥9990211544 Top Esc...
/:Call Girls In Jaypee Siddharth - 5 Star Hotel New Delhi ➥9990211544 Top Esc...lizamodels9
 
Call Girls In Panjim North Goa 9971646499 Genuine Service
Call Girls In Panjim North Goa 9971646499 Genuine ServiceCall Girls In Panjim North Goa 9971646499 Genuine Service
Call Girls In Panjim North Goa 9971646499 Genuine Serviceritikaroy0888
 
Enhancing and Restoring Safety & Quality Cultures - Dave Litwiller - May 2024...
Enhancing and Restoring Safety & Quality Cultures - Dave Litwiller - May 2024...Enhancing and Restoring Safety & Quality Cultures - Dave Litwiller - May 2024...
Enhancing and Restoring Safety & Quality Cultures - Dave Litwiller - May 2024...Dave Litwiller
 
Call Girls Pune Just Call 9907093804 Top Class Call Girl Service Available
Call Girls Pune Just Call 9907093804 Top Class Call Girl Service AvailableCall Girls Pune Just Call 9907093804 Top Class Call Girl Service Available
Call Girls Pune Just Call 9907093804 Top Class Call Girl Service AvailableDipal Arora
 
VIP Kolkata Call Girl Howrah 👉 8250192130 Available With Room
VIP Kolkata Call Girl Howrah 👉 8250192130  Available With RoomVIP Kolkata Call Girl Howrah 👉 8250192130  Available With Room
VIP Kolkata Call Girl Howrah 👉 8250192130 Available With Roomdivyansh0kumar0
 
A DAY IN THE LIFE OF A SALESMAN / WOMAN
A DAY IN THE LIFE OF A  SALESMAN / WOMANA DAY IN THE LIFE OF A  SALESMAN / WOMAN
A DAY IN THE LIFE OF A SALESMAN / WOMANIlamathiKannappan
 
Call Girls Navi Mumbai Just Call 9907093804 Top Class Call Girl Service Avail...
Call Girls Navi Mumbai Just Call 9907093804 Top Class Call Girl Service Avail...Call Girls Navi Mumbai Just Call 9907093804 Top Class Call Girl Service Avail...
Call Girls Navi Mumbai Just Call 9907093804 Top Class Call Girl Service Avail...Dipal Arora
 
Call Girls In Connaught Place Delhi ❤️88604**77959_Russian 100% Genuine Escor...
Call Girls In Connaught Place Delhi ❤️88604**77959_Russian 100% Genuine Escor...Call Girls In Connaught Place Delhi ❤️88604**77959_Russian 100% Genuine Escor...
Call Girls In Connaught Place Delhi ❤️88604**77959_Russian 100% Genuine Escor...lizamodels9
 

Recently uploaded (20)

Lowrate Call Girls In Sector 18 Noida ❤️8860477959 Escorts 100% Genuine Servi...
Lowrate Call Girls In Sector 18 Noida ❤️8860477959 Escorts 100% Genuine Servi...Lowrate Call Girls In Sector 18 Noida ❤️8860477959 Escorts 100% Genuine Servi...
Lowrate Call Girls In Sector 18 Noida ❤️8860477959 Escorts 100% Genuine Servi...
 
Catalogue ONG NUOC PPR DE NHAT .pdf
Catalogue ONG NUOC PPR DE NHAT      .pdfCatalogue ONG NUOC PPR DE NHAT      .pdf
Catalogue ONG NUOC PPR DE NHAT .pdf
 
Regression analysis: Simple Linear Regression Multiple Linear Regression
Regression analysis:  Simple Linear Regression Multiple Linear RegressionRegression analysis:  Simple Linear Regression Multiple Linear Regression
Regression analysis: Simple Linear Regression Multiple Linear Regression
 
The CMO Survey - Highlights and Insights Report - Spring 2024
The CMO Survey - Highlights and Insights Report - Spring 2024The CMO Survey - Highlights and Insights Report - Spring 2024
The CMO Survey - Highlights and Insights Report - Spring 2024
 
Grateful 7 speech thanking everyone that has helped.pdf
Grateful 7 speech thanking everyone that has helped.pdfGrateful 7 speech thanking everyone that has helped.pdf
Grateful 7 speech thanking everyone that has helped.pdf
 
Keppel Ltd. 1Q 2024 Business Update Presentation Slides
Keppel Ltd. 1Q 2024 Business Update  Presentation SlidesKeppel Ltd. 1Q 2024 Business Update  Presentation Slides
Keppel Ltd. 1Q 2024 Business Update Presentation Slides
 
Pharma Works Profile of Karan Communications
Pharma Works Profile of Karan CommunicationsPharma Works Profile of Karan Communications
Pharma Works Profile of Karan Communications
 
Vip Dewas Call Girls #9907093804 Contact Number Escorts Service Dewas
Vip Dewas Call Girls #9907093804 Contact Number Escorts Service DewasVip Dewas Call Girls #9907093804 Contact Number Escorts Service Dewas
Vip Dewas Call Girls #9907093804 Contact Number Escorts Service Dewas
 
Forklift Operations: Safety through Cartoons
Forklift Operations: Safety through CartoonsForklift Operations: Safety through Cartoons
Forklift Operations: Safety through Cartoons
 
Insurers' journeys to build a mastery in the IoT usage
Insurers' journeys to build a mastery in the IoT usageInsurers' journeys to build a mastery in the IoT usage
Insurers' journeys to build a mastery in the IoT usage
 
Vip Female Escorts Noida 9711199171 Greater Noida Escorts Service
Vip Female Escorts Noida 9711199171 Greater Noida Escorts ServiceVip Female Escorts Noida 9711199171 Greater Noida Escorts Service
Vip Female Escorts Noida 9711199171 Greater Noida Escorts Service
 
/:Call Girls In Jaypee Siddharth - 5 Star Hotel New Delhi ➥9990211544 Top Esc...
/:Call Girls In Jaypee Siddharth - 5 Star Hotel New Delhi ➥9990211544 Top Esc.../:Call Girls In Jaypee Siddharth - 5 Star Hotel New Delhi ➥9990211544 Top Esc...
/:Call Girls In Jaypee Siddharth - 5 Star Hotel New Delhi ➥9990211544 Top Esc...
 
Call Girls In Panjim North Goa 9971646499 Genuine Service
Call Girls In Panjim North Goa 9971646499 Genuine ServiceCall Girls In Panjim North Goa 9971646499 Genuine Service
Call Girls In Panjim North Goa 9971646499 Genuine Service
 
Enhancing and Restoring Safety & Quality Cultures - Dave Litwiller - May 2024...
Enhancing and Restoring Safety & Quality Cultures - Dave Litwiller - May 2024...Enhancing and Restoring Safety & Quality Cultures - Dave Litwiller - May 2024...
Enhancing and Restoring Safety & Quality Cultures - Dave Litwiller - May 2024...
 
Call Girls Pune Just Call 9907093804 Top Class Call Girl Service Available
Call Girls Pune Just Call 9907093804 Top Class Call Girl Service AvailableCall Girls Pune Just Call 9907093804 Top Class Call Girl Service Available
Call Girls Pune Just Call 9907093804 Top Class Call Girl Service Available
 
VIP Kolkata Call Girl Howrah 👉 8250192130 Available With Room
VIP Kolkata Call Girl Howrah 👉 8250192130  Available With RoomVIP Kolkata Call Girl Howrah 👉 8250192130  Available With Room
VIP Kolkata Call Girl Howrah 👉 8250192130 Available With Room
 
A DAY IN THE LIFE OF A SALESMAN / WOMAN
A DAY IN THE LIFE OF A  SALESMAN / WOMANA DAY IN THE LIFE OF A  SALESMAN / WOMAN
A DAY IN THE LIFE OF A SALESMAN / WOMAN
 
KestrelPro Flyer Japan IT Week 2024 (English)
KestrelPro Flyer Japan IT Week 2024 (English)KestrelPro Flyer Japan IT Week 2024 (English)
KestrelPro Flyer Japan IT Week 2024 (English)
 
Call Girls Navi Mumbai Just Call 9907093804 Top Class Call Girl Service Avail...
Call Girls Navi Mumbai Just Call 9907093804 Top Class Call Girl Service Avail...Call Girls Navi Mumbai Just Call 9907093804 Top Class Call Girl Service Avail...
Call Girls Navi Mumbai Just Call 9907093804 Top Class Call Girl Service Avail...
 
Call Girls In Connaught Place Delhi ❤️88604**77959_Russian 100% Genuine Escor...
Call Girls In Connaught Place Delhi ❤️88604**77959_Russian 100% Genuine Escor...Call Girls In Connaught Place Delhi ❤️88604**77959_Russian 100% Genuine Escor...
Call Girls In Connaught Place Delhi ❤️88604**77959_Russian 100% Genuine Escor...
 

WA Resources Industry Environmental Scan Outlines Skills & Labour Demands

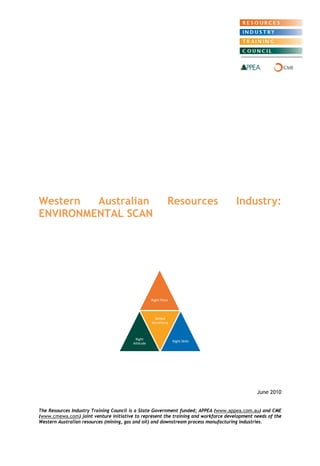
  • 1. Western Australian Resources Industry: ENVIRONMENTAL SCANRight PlaceRight AttitudeSkilled WorkforceRight Skills June 2010 The Resources Industry Training Council is a State Government funded; APPEA (www.appea.com.au) and CME (www.cmewa.com) joint venture initiative to represent the training and workforce development needs of the Western Australian resources (mining, gas and oil) and downstream process manufacturing industries.
  • 2. RESOURCES INDUSTRY ENVIRONMENTAL SCAN Note and Declaimer: This document is an environmental scan for the Western Australian resources sector and was developed by the Resources Industry Training Council (RITC). Its purpose is to provide the Department of Training and Workforce Development and the State Training Board with an overview of the industry with the intention of being incorporated into a workforce development plan for the petroleum, mining and exploration industries of Western Australia. This report is supplied in good faith and reflects the knowledge, expertise and experience of the developer. The information provided is derived from sources believed to be reliable and accurate at the time of publication. The use of the information in the environmental scan is at your own risk. The RITC does not warrant the accuracy of any forecast or prediction in the report. The environmental scan is provided solely on the basis that users will be responsible for making their own assessment of the information provided therein and users are advised to verify all representations, statements and information for decisions that concern the conduct of business that involves monetary or operational consequences. Each user waives and releases the Resources Industry Training Council and the State of Western Australia and its servants to the full extent permitted by law from all and any claims relating to the use of the material in the environmental scan. In no event shall the Resources Industry Training Council or the State of Western Australia be liable for any incidental or consequential damages arising from any use or reliance on any material in the environmental scan. The Resources Industry Training Council 7th Floor, 12 St Georges Terrace, Locked Bag N984, Perth, WA, 6844 Phone: +61 8 9325 2955 Facsimile: +61 8 9221 3701 For information regarding this report contact: Debra Dixon Executive Officer Resources Industry Training Council Telephone: +61 8 9220 8538 Email: d.dixon@cmewa.com
  • 3. Contents Executive Summary ................................................................................................. 1 Resources Industry Overview ...................................................................................... 1 State and National Training Councils ............................................................................ 2 Industry Organisations/Associations ............................................................................. 2 Economic Overview of the Resources Industry ................................................................. 2 Economic Cycles and Conditions ............................................................................... 3 Political/ Governmental/ Regulatory Influences ............................................................... 4 Regulations and Legislation Affecting the Industry ......................................................... 4 Changes in Rules and Regulations ............................................................................. 5 Certification Requirements ..................................................................................... 7 Geographic Location of the Industry ............................................................................. 7 Regional Infrastructure and Availability Of Adequate Local Skills & Labour .......................... 11 Employment ........................................................................................................ 11 Construction versus Operational workforce needs ........................................................ 12 Demands for a Skilled workforce ............................................................................ 12 Phases of operations ........................................................................................... 13 Workforce Statistics ............................................................................................ 15 National Competency Standards and National Training Packages ...................................... 19 Industry Occupational Overview ............................................................................. 20 Future Labour Demands ....................................................................................... 22 Current and Emerging Skill / Labour Gaps ................................................................. 23 Operation Critical Job Roles .................................................................................. 25 Emerging Occupations ......................................................................................... 26 Declining Occupations ......................................................................................... 26 Workforce Sources ................................................................................................ 26 Fly In Fly Out (FIFO) ........................................................................................... 27 Sourcing Employees from Overseas .......................................................................... 28 Barriers to Employment .......................................................................................... 30 What makes Employment Less Attractive? ................................................................. 30 Education and Training ........................................................................................... 32 Barriers to Training ............................................................................................ 32 Pre-employment Education and Training ................................................................... 32 Existing Worker training ....................................................................................... 33 Industry Qualifications Overview ............................................................................ 34 University Education ........................................................................................... 35 Future Directions for Education and Training .............................................................. 36 Technology ......................................................................................................... 36 Sustainability ...................................................................................................... 37 Carbon Emissions ............................................................................................... 38 Resource Operations .............................................................................................. 38 Data Sources .................................................................................................... 42
  • 4. Executive Summary The Department of Training and Workforce Development commissioned the Resources Industry Training Council to undertake research and prepare a industry workforce development plan for the Western Australian resources industry which includes the mining, petroleum, drilling and quarrying industries. This environmental scan is a component of that workforce development plan. The purpose of the initial research was to conduct an industry analysis of current and future employment demand, to identify barriers to employment and develop strategies to ensure this demand for skills and labour could be met. With more than $88 billion worth of resource development and expansion projects either commenced or committed in Western Australia; labour and skill shortages are already being felt despite the global financial downturn. Large scale petroleum and iron ore projects are employing significant numbers of tradespersons during the construction phase; with most in demand trade being the metals, engineering and electrical trades. Construction phases require around 10 times the number of employees as does the operational phase of the project. The demand for construction skills and labour is having affect on other industries with employees moving from other sectors into resource project construction. The request for the development of the environmental scan was a response to the serious labour shortages experiences across all industries prior to the global economic downturn and the knowledge that a resurgence of skills and labour demands in the resources sector has begun. Labour and skills shortages threaten to constrain economic development and prevent Western Australia to reach its full economic potential. The scan has been designed to assist Western Australian State government with developing training policy, establishing VET funding priorities and the development of a workforce development plan for Western Australia. Evidence gathering and research in preparation for this scan, included: • comprehensive analysis of data and reports produced by the Chamber of Minerals and Energy WA (CMEWA); the Australian Petroleum Production and Exploration Assocaition (APPEA), Mining Industry Skills Centres Inc; Energy Skills Queensland, the State Training Board and the WA Department of Mines and Petroleum; • industry visits by RITC personnel, which involved face-to-face interviews with key enterprise stakeholders; • review of published and web-based information and data; • consultation with industry representatives from the various sectors for validation of this environmental scan; • analysis of data supplied by the Australian Bureau of Statistics, SkillsDMC, Manufacturing Skills Australia (MSA), IBIS World, Australian Industry Group (AIG) and other similar organisations. Resources Industry Overview The primary activities of the Western Australian resources industry include: • Exploration and drilling; • Metal ore and coal mining; • Oil and gas extraction; • Non metal ore mining and quarrying; • Salt production. The major products and services of this industry include: Iron Ore Gold Alumina Lead Silver Copper Zinc Coal Oil and gas Nickel Minerals Sands Manganese Salt Diamonds Tin Cobalt Chromite Clays Construction Materials Dimension Stone Gypsum Industrial Pegmatite Minerals Limestone Manganese Ore Molybdenum Phosphate Rare Earths Silica - Silica Sand Talc Tin Tantalum Lithium Vanadium Exploration Drilling Mining Services Page 1
  • 5. Page 1 The resources industry includes activities that extract naturally occurring minerals, crude petroleum and natural gas. The term mining is used in very broadest sense to include underground or open cut mining, quarrying, well operations (gas oil) or evaporation pans (salt), as well as beneficiation activities which may involve crushing, screening, washing and flotation and other preparation work customarily performed at the mine site, or as a part of mining activity. Despite the global economic downturn and a fall in commodity prices Western Australia’s resources industry recorded a 19% increase in sales value. Iron ore was the largest individual mineral sector accounting for almost half of the total value of the State’s mineral and petroleum sales. Other commodities to record significant growth in sales value in 2008–09 include LNG, natural gas, gold and salt. The mineral and petroleum sectors contributed 89% ($77.5 billion) to the States exports in 2008-20091. Data compiled by Department of Mines and Petroleum (DMP) show that there were 67,865 persons employed in the Western Australian mining sector in June 2009. This represents a 4% decrease compared to June 2008 or a loss of 9,663 jobs compared to October 2008; when Western Australian mining sector employment peaked at 77,528. Despite job losses in the State’s resources industry; the industry continued to be a major employer in Western Australia where it is estimated that one in five employees are either directly or indirectly involved in resource sector activities1. In 2008 Chamber of Minerals and Energy’s publication ‘Developing a Growth Outlook for WA’s Minerals and Energy Industry’ predicts the demand for people, water and energy based on proposed developments within the resources sector. The long term outlook for the resources sector is very positive. In summary: • the resources industry is projected to grow significantly in the period 2008-2014; • direct labour demand is expected to peak in 2012 at ~ 38,000; • the highest growth regions are expected to be the Mid-West (6,000); Goldfields/Esperance (3,000) and the Pilbara (14,000) in 2014; • Additional employees will be FIFO with a peak incremental requirement of 27,000 in 2012 versus a residential workforce requirement of 11,000 in the same period. In 2009, the State government introduced an Exploration Incentive Scheme to encourage exploration in unexplored regions of the State. Petroleum exploration for 2008-2009 totalled $2.9 billion which was 35% higher than in 2007-2008. Offshore exploration accounts for 84% of the total expenditure and is located mainly in the Carnarvon and Browse basins. Although minerals exploration experienced a 10% fall in expenditure it still reached $1.2 billion. Iron ore (33%) and uranium (6%) exploration both recorded increases in expenditure. Gold exploration fell by 24% and base metals including nickel experiences a 12% fall. In 2008–09, $22.8 billion of new capital expenditure by Western Australia's mining industry represented a 34% increase compared to the previous financial year. Capital expenditure by the mining industry represented 75% of Western Australia’s total new capital expenditure of $30.4 billion in 2008–09. Western Australia also accounted for 64% of national investment expenditure by the mining industry in 2008–091. Investment projects in the under-construction category are dominated by iron ore and LNG projects. Projects include • Woodside’s Pluto Train 1 LNG project ($12 billion); • BHP Billiton’s Rapid Growth Project 5 iron ore project ($7.4 billion); • Sino Iron’s Pellet project ($5.2 billion); • Newmont Mining Corporation’s Boddington gold and copper mine ($3.7 billion); and • Worsley Alumina’s refinery expansion ($2.5 billion). The committed investment projects category is dominated by: • the Gorgon Joint Venture ($43 billion); • the Oakajee Port and Rail development ($4 billion); • Perdamen Chemicals’ Coal to Urea Plant ($3.7 billion); • Western Areas’ Flying Fox, Spotted Quoll and Lounge Lizard nickel projects ($3.8 billion). Despite the outsourcing to overseas companies and facilities the development of the large components of these construction projects (for example LNG trains) this equipment will need to be assembled and installed on arrival in Western Australia. During the construction period the above large scale construction projects will increase demand for metal, electrical, mechanical and other 1 Department of Mines and Petroleum: Western Australian Minerals and Petroleum Statistics Digest 2008-2009.
  • 6. Page 2 construction and commissioning tradespersons. After construction the numbers of workers falls dramatically as maintenance and operating staffing levels are significantly smaller. Over the past ten years; royalties received by the Western Australian Government from Western Australian mineral and petroleum producers have increased 280% from $777 million in 1999–2000 to $3.2 billion collected during the 2008–09 financial year. In summary Western Australia accounts for approximately 46% of Australia’s total value of mineral and petroleum sales (based on DMP and ABARE published data). DMP and ABARE data show that in the 2008 calendar year Western Australia’s petroleum industry accounted for 66% of national crude oil and condensate production and 71% of natural gas production and in 2008–09 38% of Australia’s total merchandise exports originated from Western Australia. State and National Training Councils The Resources Industry Training Council (RITC) is one of ten industry advisory bodies established by the State Government to provide strategic, forward looking training advice to the Western Australian State Training Board (STB) and the Department of Training and Workforce Development. A major function of the RITC is to work with industry, training providers and government to develop and implement innovative solutions for skill shortages and changing workforce needs. The RITC is a State Government funded joint venture between the Chamber of Minerals and Energy of Western Australia (CMEWA) and the Australian Petroleum Production Exploration Association Ltd (APPEA). The RITC is the peak body for the development and implementation of a vocational education and training (VET) framework to meet the diverse needs of the industry sectors of minerals, oil and gas and downstream processing. SkillsDMC is the national Industry Skills Council for the Resources and Infrastructure sectors with coverage for the manufacturing sector which includes mining, drilling and construction. Manufacturing Skills Australia (MSA) is the national Industry Skills Council for the manufacturing sector which covers the petroleum extraction and processing sectors. Industry Organisations/Associations • Australian Petroleum Production and Exploration Association • Chamber of Minerals and Energy • Association of Mining and Exploration Companies • Australian Drilling Industry Association • Australian Drilling Industry Training Committee Economic Overview of the Resources Industry The minerals and petroleum industry is a major contributor to the economy. In 2008-2009 the minerals and petroleum exports accounted for almost 90% of the State’s income from total merchandise exports. In 2008-2009 the value of the Western Australian minerals and petroleum industry reached $71.3 billion, an increase of 19% over the previous year2. Within the State there are over 513 commercial mineral projects with more than 893 operating mine sites and 64 operating oil and gas fields. More than 50 different minerals are mined. The resources sector employs more than 67,865 persons. Western Australia’s mineral and petroleum resources in order of value for 2008–09 are: Billion $ Iron Ore $33.56 Crude Oil and Condensate $10.77 LNG $8.54 Gold $5.19 Alumina $4.56 Nickel $2.98 Others $5.71 2 Department of Mines and Petroleum: Western Australian Minerals and Petroleum Statistics Digest 2008-2009
  • 7. Over the past ten years, royalties received by the Western Australian Government from mineral and petroleum producers have increased 280% from $777 million in 1999–2000 to $3.2 billion collected during the 2008–09 financial year. This represents royalties paid into the Western Australian Government Consolidated Revenue Fund. It includes Western Australia’s share of royalties paid by petroleum projects, royalties collected in the Territorial Sea subsisting permit areas, Barrow Island and the North West Shelf (where the State receives approximately 65% of royalties) that are shared with the Commonwealth. 2008-2009 Output Of Minerals And Energy 2 Million $ WA share of % (based on value) Western Australia $71,310 Australian Minerals and Energy 48% Australia (~ based on ABS data) $148,562 Australian Minerals(excl. coal) 43% WA minerals $50,017 Australian Minerals (incl. coal) 62% WA petroleum $21,293 Australian Energy (incl. coal) 33% Australian Petroleum 64% Major West Australian Commodities Exploration Iron Ore $33,561 million Western Australian mineral $1,247 million Petroleum $21,293 million Australian mineral $2,223 million Gold $5,190 million WA share 56% Alumina $4,564 million Western Australian petroleum $2,945 million Nickel $2,979 million Australian petroleum $3,811 million WA share 77% Merchandise Exports Mineral and Energy Exports Western Australia $86,790 million Western Australia $77,470 million Australia $230,475 million Australia $160,377 million WA share 38% WA share 48% WA exports of minerals and energy as % share of all State Merchandise exports 89% Private New Capital Investment and GDP Western Australia $30,370 million Australian minerals and energy $35,675 million Australia $101,134 million WA minerals and energy $22,847 million WA share 30% WA share 64% Australia GDP 2008-09 $1,194,496 million Western Australian GSP 2008-09 $156,607 million Mining component of WA GSP 25% In 2007/08, the total domestic market for gas was about 950 terajoules per day, representing 53% of gross State energy consumption and 60% of electricity generation. Most gas for domestic use is supplied by the North West Shelf Venture (63%) through the Karratha Gas Plant and the Apache- Operated Harriet and John Brookes joint ventures (33%), through Varanus Island. Domestic gas projects under development or being considered for development include Devil Creek (220TJ/D), Gorgon (300TJ/d), Macedon (170TJ/d), Wheatstone (150 TJ/d) as well as Pluto. Gas is used predominantly for industrial production (58%), in electricity generation (29%) and by households for cooking and heating (4%). More than 75% of this gas is consumed by just six large customers- Alinta, BHP Billiton and Burrup Fertilisers for industrial purposes; Verve Energy, ERM and Alinta for electricity generation and gas supply to small customers. ECONOMIC CYCLES AND CONDITIONS The levels of commodities produced by the resources sector and the sectors profitability rely on global commodity prices and demand. If commodity prices or demand fall too low resource operations will stop operating and go into care and maintenance until commodity prices and demand improve. This reaction to the global economy is reflected in the number of projects that were put on hold after the global economic downturn. Prior to the down turn severe skill shortages existed in most Western Australian industries as the resource sector drew labour from all other industries. After global economic downturn the resources sector made a significant number of employees redundant, this had a dramatic flow on into the supporting industries. Page 3
  • 8. Despite the global economic downturn at an aggregate level, the value of Western Australian mineral and petroleum sales recorded a 19% increase to reach $71.3 billion in 2008–09. Iron ore was the largest individual mineral sector by value and accounted for almost half of the total value of the State’s mineral and petroleum sales. Other commodities to record significant growth in sales value in 2008–09 include LNG, natural gas, gold and salt. The following table lists the overall average commodity price movements in 2008–09. As shown; commodity prices were adversely affected by the global financial crisis. Commodity $ Iron Ore Up 74% Gold Up 28% Alumina Steady Tin Down 4% Crude Oil Down 16% Copper Down 26% Cobalt Down 34% Zinc Down 36% Lead Down 40% Nickel Down 45% The shortage of labour and the need for an appropriately skilled workforce are regularly identified as key impediments to the growth of Australia’s resources sector. While this is undoubtedly true, to precisely what extent and what actions are required is much less certain. Given the number of variables that will affect the future growth of the industry, including Australia’s investment competitiveness, the economic climate and international demand for Australian resources, it is impossible to forecast the industry’s skill and labour needs into the future with a high degree of accuracy. Planning for uncertainty underscores the importance of a strong partnership between the industry and government, both of whom have very significant, though different, roles to play. Industry costs generally have doubled around the world in recent years (industry costs in Australia increased more than the global average) and local factors like the increased remoteness of the fields, in deeper water, with drier gas and higher impurities, are also contributing to higher development costs. The higher the industry costs the less competitive the industry is in the global market. Political/ Governmental/ Regulatory Influences REGULATIONS AND LEGISLATION AFFECTING THE INDUSTRY • Atomic Energy Act 1953 (Cwth) • Australian Radiation Protection and Nuclear Safety Act 1998 (Cwth) • Environment Protection and biodiversity Conservation Act 1999 (Cwth) • Environmental Protection (Impact of Proposals) Act 1974 (Cwth) • Conservation and Land Management Act 1984 (WA) • Customs (Prohibited Exports) Regulations 1958 (Cwth) • Customs Act 1901 (Cwth) • Dangerous Goods Safety Act 2004 (WA) • Dangerous Goods Safety Regulations 2007 (WA) • Environmental Protection Act 1986 (WA) • Environmental Protection and Biodiversity Conservation Act 1999 (Cwlth) • Mines Safety and Inspection Act 1994 (WA) and Mines Safety and Inspection Regulations 1995 (WA). • Mining Act 1978 (WA) • Native Title Act 1993 (Cwth); • Nuclear Activities Regulations Act 1978 (WA) • Nuclear Non-Proliferation (Safeguards) Act 1987 (Cwth). • Nuclear Non-Proliferation Treaty • Offshore Petroleum and Greenhouse Gas Storage Act 2006 (Cwth) • Petroleum (Submerged Lands) Act 1982 (WA) • Petroleum and Geothermal Energy Resources Act 1967 (WA) • Petroleum Legislation Amendment and Repeal Act 2005 (WA) Page 4
  • 9. • Petroleum Pipelines Act 1969 (WA) • Radiation Protection and Control Act 1982 (SA) • Radiation Safety Act 1985 (WA) • Radioactive Ores and Concentrates (packaging and transport ) Act 1980 (NT) • Rights in Water and Irrigation Act 1914 (WA) • Wildlife Conservation Act 1950 (WA) CHANGES IN RULES AND REGULATIONS Carbon Emissions Carbon emissions legislation will have an effect on the resources sector. Royalties and Taxes Tax and royalty rates are an important factor when companies make decisions about developing resource projects, as well as determining which States and countries provide the best operating environment for new investments in resources projects. The Federal Government’s proposed introduction of a new $9 billion tax on the resources sector, called the “Resource Super Profits Tax” (RSPT) will take some time to evaluate in terms of their overall net impact on the WA resources sector. The State Government collected $3.2 billion in resource royalties in 2008-09. Much of the revenue received from royalties is invested in infrastructure projects and as the basis of the Royalties for Regions program which is returning 25% of all royalties to regional Western Australia. Mineral and petroleum resources are owned by the Crown, and either the Federal Government (in the case of offshore operations) or the State and Territory Governments (in the case of onshore operations) levy royalties or taxes. The level and nature of royalties varies between both States and commodities. Royalty systems include specific rate royalties, ad valorem royalties and profit-related royalties. The bulk of the royalties paid by the Mining division goes to Federal and State Governments, but some royalties are also paid to others. The proposed Centralised Royalty Revenue needs to ensure equitable distribution and not disadvantage Western Australia. Oil and gas accounted for about 47% of the royalty payments, coal mining for about 27%, metal ore mining for nearly 23% and other minerals for the remaining 3%. A number of specific taxes apply to the Oil and Gas Extraction industry. With the exception of various North West Shelf project; Petroleum Resource Rent Taxes (PRRT) apply to most offshore petroleum projects. PRRT is levied on net revenues at the rate of 40%. Where PRRT applies, it replaces the excise and royalties that would otherwise have been levied. Resource Rent Royalties (RRR) may be applied to onshore petroleum projects by State Governments. There is provision for the Federal Government to waive its crude oil excise where RRR is applied, provided that the State Government negotiates an acceptable agreement with the producers and agrees to a satisfactory revenue sharing arrangement with the Federal Government. Resource Rent Royalties are levied at a rate of between 10% and 12.5% of the net well-head value of all petroleum produced. Crude Oil Excises are levied as a percentage of the realised price received by producers and are based on the annual level of crude oil sales from individual productions areas. The level of excise varies with the size and discovery date of the field. In general, most states levy royalties of between 10% and 12.5% of the net well-head value of the petroleum produced. Excises apply to crude oil production onshore and in coastal waters (with the exception of Barrow Island where a RRR applies). They also apply to the North West Shelf projects. Commonwealth royalties are levied on offshore petroleum production from the North West Shelf project and the proceeds are split between the Federal Government and the Western Australian Government. A GST applied at the rate of 10% benefits the Mining sector, as it is able to claim GST paid on business inputs, and is not required to charge GST to its overseas customers. Replacing State mineral royalties with a new Federal tax could see Western Australia miss out on its fair share of the income derived from resource projects in the State according to the CME. Page 5
  • 10. Royalties derived from resource projects are an essential part of State revenue and are required to deliver important services and infrastructure for all Western Australians and this revenue must not be threatened by the advent of the RSPT. It is acknowledged that the Federal Government also contributes significantly to the infrastructure requirements of the State and to increase the contribution made by companies to a sustainable level could assist in the provision of improved services and development in regional and metropolitan areas. Skilled Migration The resources industry is a global industry, with many multinational companies having workforces in several countries; hence, resources industry skills are internationally transferrable. A State workforce development strategy needs to factor in this global movement of employees. Skilled migrants on temporary (457) skilled migration programs, particularly in critical professional roles are a key component of the minerals sector’s response to overcoming skills capacity constraints and maintaining the resources sector’s productivity. Australia’s skilled migration program provides a critical source of skilled workers for the resources sector. During the recent commodity market surge the minerals industry workforce grew by 90 % in the five years to November 2008 and skilled migrants comprised a critical 3 % of that labour force. The 2009 review of the Migration Occupations in Demand List (MODL) review found that the MODL needed to be revoked and replaced by a more targeted skilled occupations list to better meet the demands of Australia’s labour market. Also announced was the replacement of the current Skilled Occupation List (SOL) in the second half of 2010, with a new list of targeted occupations determined by the independent body, ‘Skills Australia’. While industry has supported the change to an industry driven model of program targets being set against medium-long term skill needs rather than the more cyclical nature of labour demand that characterises many Australian industries; the minerals industry being one of those. The Government’s labour market forecasts of the minerals industry have consistently underestimated the skills shortages in occupations with small numbers of employees such as mining engineering and metallurgy. In particular the industry supports the need to target skills of high economic value across all skilled migration programs. A skilled migration program with integrity that doesn’t compromise the working conditions of the migrants, nor work opportunities for Australians and which is not overly bureaucratic and facilitates employer participation must be maintained within the national workforce development strategy. The system must be responsive to genuine employers and timely in delivering outcomes to match investment decisions. The nation’s population alone cannot meet the anticipated skills demand of the resources sector in a timely manner. Therefore, the skilled migration system should complement the continuing development of the skills of the state by providing highly skilled migrant workers where those skills are not currently available in sufficient quantities in the Australian workforce. VET Act The September 2009 amendments to the Vocational Education and Training Act 1996 made widespread changes to the operation and administration of training in WA, particularly affecting trade training and issuing of trade papers. The shortening of some apprenticeship terms to three and a half years has not been met with universal approval of the Industry. Many employers believe that the increasing complexity of some work skills require more rather than less time in training. This has lead to some employers retaining the Apprentice after the indenture period to ensure the workplace competency is fully developed. The removal of the need to issue both a Trade qualification and trade papers has raised concerns in industry in that there may be a tendency by training providers to not ensure an apprentice is competent in the workplace to trades level. Previously this was a two-stage procedure where the RTO and the ApprentiCentre issued two separate documents when all the assessments were completed and signed off by all parties – training provider and employer. The lack of trade papers will be further confounded if institutionalised trade training occurs as employers have not been educated to look for the wording ‘achieved through Australian Apprenticeship arrangements’ on a qualification. Employers will need to look for the statement to determine if the trade skills were acquired through an employment contract (apprenticeship) or fully institutionalised. Page 6
  • 11. CERTIFICATION REQUIREMENTS • Authorised Mine Surveyor’s certificate grades 1 and 2 • Dangerous Goods Safety (Explosives) Regulations 2007 • Dangerous Goods Safety (Security Risk Substances) Regulations 2007 • Dangerous Goods Security Card • Deputy’s certificate • Exploration Licence • Explosives Import / Export Licence • Explosives Manufacture (Mobile Processing Unit) Licence • Explosives Storage Licence • Explosives Transport Licence • Fireworks Contractor Licence • Fireworks Event Permit • Fireworks Operator Licence • First Class Mine Manager’s Certificate Of Competency • Issue Of A Test Permit • Mine surveyor’s certificate • National Standard For Licensing Persons Performing High Risk Work • Pyrotechnics (Special Use) Licence • Quarry Manager’s Certificate Of Competency • Restricted quarry manager Certificate Of Competency • Shotfiring Licence • SRS Fertiliser Licence • SRS Import / Export Licence • SRS Manufacture Licence • SRS Storage Licence • SRS Supply Licence • SRS Transport Licence • Tenement Licence • Underground Supervisor’s Certificate Of Competency • Ventilation Officer – Diploma or above • Water Well Drilling Licence • Winding Engine Driver’s certificate Geographic Location of the Industry The majority of the industry is conducted in remote and regional Western Australia with the majority occurring in the Pilbara and the Kalgoorlie Esperance regions with the Mid West becoming a region of growth. Large resource companies typically have a head office located one of the large cities rather than the operations site. Head Office functions typically include setting production targets, corporate standards, strategic planning and corporate compliance and reporting. Often the head office will develop and drive the graduate and leadership programs across the sites. Page 7
  • 12. Source: http://www.dmp.wa.gov.au/documents/map09.pdf Most of Australia’s petroleum resources are located on the coast of Western Australia, the Northern Territory and Victoria. Western Australia has 64% of Australia’s economic demonstrated resources of crude oil, 75% of condensate resources and 57% of LPG resources. Geoscience Australia 2008, Oil and gas resources of Australia showed that WA’s Petroleum resources include 121 GL of crude oil, 255 GL of condensate, 98 GL of LPG, and 2592 bcm of Conventional Gas. Page 8
  • 13. Page 9 Australia’s existing, committed and proposed LNG plants. DMP data3 shows regions in Western Australia produce minerals and/or gas and oil. The Pilbara is the major mineral and petroleum centre for Western Australia with 47% of the resources value being generated by minerals (mainly iron ore but along with gold, manganese, copper and salt) and around 28% by petroleum. The Goldfields – Esperance region generates 11% of the State’s mineral wealth mainly through gold, nickel cobalt and base metals. Currently the Mid West generates 4% through gold, base metals, iron ore as well as gas and oil but this region is expected to grow with the ramping up of iron mines in the region. The Peel region generates 6% of the value through alumina and gold production. The Kimberly produces diamonds, nickel, gold and iron ore and reflects 1% of the value resources produced in Western Australia. The Southwest is known for its coal mines, mineral sands. 3 http://www.dmp.wa.gov.au/1521.aspx#7873: Quantity and value 2009 47% 28% 11% 6% 4% 2%1% 1% $ Value of Minerals and Petroleum by RegionPilbara RegionOffshore PetroleumGoldfields Esperance Peel RegionMid West RegionWheatbelt RegionKimberley RegionOther
  • 14. Page 10 2009 Sales Value of Resources Produced by Region Pilbara Region Wheatbelt Region Iron Ore $26,820,026,183 Iron Ore, Feldspar and Gold $844,544,660 Gold $717,755,331 Gypsum and Heavy Mineral Sands $201,888,238 Copper $599,738,263 Nickel, Cobalt and Salt $166,012,639 Manganese and Salt $550,352,096 Other $8,719,078 Other $107,822,954 Total $1,221,164,615 Total $28,795,694,827 Kimberley Region Offshore Petroleum Nickel, Cobalt and Diamonds $394,450,678 Crude Oil and Condensate $8,699,005,967 Iron Ore and Gold $300,577,833 Liquefied Natural Gas $6,327,686,818 Copper, Silver and Crude Oil $31,408,329 Natural Gas $1,133,326,096 Other $5,200,523 LPG Butane and Propane $612,776,966 Total $731,637,363 Total $16,772,795,847 South West Region Goldfields Esperance Region Coal $308,156,873 Gold $3,747,156,752 Heavy Mineral Sands $146,944,680 Nickel, Platinum and Palladium $2,654,202,367 Tin, Tantalum and Spodumene $92,741,498 Cobalt $151,750,856 Other $226,041 Copper and zinc $142,711,787 Total $548,069,092 Silver $15,756,175 Construction Materials $3,461,378 Gascoyne Region Other $2,858,443 Salt and Gems $91,321,783 Total $6,717,897,758 Gypsum and Limesand-Limestone $8,714,659 Other $25,230 Peel Region Total $100,061,672 Alumina $3,593,456,264 Gold and Copper $105,985,416 Perth Metropolitan Region Total $3,699,441,680 Construction Materials, Silica Sand, Limesand-Limestone $25,194,012 Mid West Region Gold $896,142,642 Great Southern Region Copper, Lead and Zinc $386,540,055 Limesand, Silica Sand and Spongolite $3,774,149 Nickel, Cobalt and Talc $349,203,352 Iron Ore and Gypsum $341,123,623 Heavy Mineral Sands $276,727,462 Chromite, Manganese and Silver $69,351,026 Crude Oil and Condensate $36,349,155 Natural Gas $22,909,246 Other $3,480,140 Total $2,381,826,701 Condensate19% Natural Gas7% Crude Oil33% LPG ‐ Butane Propane4% LNG37% $ Value ByPetroleum Products
  • 15. REGIONAL INFRASTRUCTURE AND AVAILABILITY OF ADEQUATE LOCAL SKILLS LABOUR Due to a number of factors including inadequate regional infrastructure and local skilled labour the majority of employment in the resources sector is fly-in fly-out (FIFO). This enables employees to be sourced from across Australia focussing on the major cities. The majority of FIFO employees are recruited from Perth. The reliance on FIFO has: • placed an additional burden on airports and airlines; • increased the demand for temporary accommodation. State-wide demand for water; electricity and gas from the minerals and energy sector is projected to grow significantly in the period 2010-2014. The majority of this growth is expected in the Pilbara and Mid West regions where new and expanding projects in particular iron ore are planned. Anticipated State-wide demand from the minerals and energy sector for water; electricity and gas include: • water demand is projected to grow at a compounded annual growth rate (CAGR) of 5.4% to 1129 Giga litres per annum (GL/a) by 2014; • electricity demand from the Pilbara is 13766 GWh/a. This constitutes a 82% of incremental growth; • State gas is anticipated to grow at a CAGR of 6.7% to 286 PJ/a by 2014. The Pilbara region is expected to account for 82%; or 78 PJ/annum incremental gas requirements in 2010. Other issues related to the remote location of the resource operations include: • lack of affordable housing; • inadequacy of public transportation; • inadequacy health care in respect to doctors and hospitals including emergency, maternity, paediatrics, psychiatric and geriatric care; • lack of 24 hours 7 days a week childcare; • lack of availability of quality schools, TAFE and tertiary institutions and the quality of teachers; • fuel prices average 30 cents per litre more than the Perth area; and • desirability of geographic areas as places to live. Employment This environmental scan relies on data provided by the Department of Mines and Petroleum (DMP) which collects mining employment data from compulsory monthly accident reporting which are submitted by all operating mines and companies carrying out exploration on mineral and mining leases. The DMP’s Resources Safety Division’s AXTAT reporting system identifies the number of direct employees and contractors (including exploration personnel) working on operating mining leases. In March 2008 legislation was introduced to capture exploration personnel working on greenfield sites. The DMP collects petroleum employment data by contacting each operating company who provide both direct and contract personnel data. Employment data collected and published by the Australian Bureau of Statistics (ABS) is classified using reference to the Australian and New Zealand Standard Industrial Classification (ANZSIC). This data is therefore not directly comparable with that collected by DMP. Under ANZSIC guidelines not all mining employment is reflected in ABS’s Mining industry classification. For example: • Catering personnel working on mine sites are reflected in the Accommodation and Food Services classification and transport personnel (truck and train drivers) working on mine sites are reflected in the Postal and Warehousing industries. • Contractors employed in site preparation and removing overburden at a mine site on a contract or fee basis are listed under Site Preparation Services. • Employees engaged in liquefying natural gas, production of pig iron, hot briquetted iron, alumina, the smelting and refining of metals are included in Manufacturing. • Employees providing geophysical surveying services on a contract or fee basis are included in Surveying and Mapping Services. Page 11
  • 16. CONSTRUCTION VERSUS OPERATIONAL WORKFORCE NEEDS It is important to note that employment numbers and required skills in the resources sector differ dramatically between construction phase and operational phase. Construction typically required large numbers of traditional tradespersons to build and install the necessary infrastructure to enable the operation to produce and process its commodity. The operational phase requires significantly less trades persons (usually limited to maintenance personnel) and an introduction of extraction operators, process technicians. Construction phases normally have around 4 times the number of employees as the operational phase. Both the construction and operational phases contribute significantly to the economy. The industry has strong linkages with other sectors, so its impacts on the economy go further than the direct contribution of construction and operation. The level of additional economic activity generated by a source industry is referred to as a multiplier. There are two types of multipliers: 1 . Production induced made up of first round effect: which is all outputs and employment required to produce the inputs for construction and operations and an industrial support effect; which is the induced extra output and employment from all industries to support the production of the first round effect. 2 . Consumption induced: which relates to the demand for additional goods and services due to increased spending by the wage and salary earners across all industries arising from employment. Clements et al (2006) suggested basic employment multipliers for construction and metals mining were 2.93 and 4.13 respectively. This means each construction position generates 1.93 jobs in a supporting industry therefore demand for 1 additional construction job required the availability of 2.93 employees. Once the project is in operation for each additional employee 4.13 jobs will be created in an allied industry. DEMANDS FOR A SKILLED WORKFORCE A variety of operations, maintenance, engineering, science and managerial career paths exist across the exploration, production, transport and processing sectors of the industry. Career paths extend from manual fieldwork, through skilled operators and maintenance technicians, to professional engineering, science and managerial positions. There is a growing demand for skilled, safety conscience people with initiative and team-working skills across the industry. Other personal attributes required include the ability to work in a team, communicate ideas, and have the resourcefulness to deliver results in remote, challenging situations. Pathways into the industry can commence through an apprenticeship, from TAFE, university and existing employment in a relevant industry. Entry level may be relevant work experience such as mobile equipment operating, trade certificate, technical diploma or a degree. The Australian Qualification Framework (AQF) has been adopted by the industry with the RII and PMA Training Packages being the focus for operators and technicians, MEM for maintenance workers and university qualifications for the professional engineering and science professionals. Employers encourage life-long learning and are supporters of career advancement. Consequently, career progression, multi-skilling and opportunities to gain experience in other vocational streams or industry sectors are common. Page 12
  • 17. PHASES OF OPERATIONS The types of skills required by a resources company depends on the life stage of the site. Exploration Phase This is the phase when exploration of land and ocean floor formation occurs and making of predictions of where mineral, oil or gas may be found. Prospectors and exploration geologists use geological aerial and satellite surveys to identify rocks, faults and basins. They conduct geophysical studies of below-ground formations using seismic surveys and 3D simulations. Minerals sector skills requirement: Oil Gas skills requirement: Prospectors and Exploration Geologists etc. Geoscientist, Geophysicists, Pilots, Maritime Crews etc. Drilling Phase In this phase drilling occurs to delineate ore bodies, oil and gas fields. Numerous drill holes are made and samples are analysed for mineral or oil bearing formations. The analysis of these samples will indicate if the project is commercially viable and the potential life of the operation. Minerals sector skills requirement: Oil Gas skills requirement: Drillers, Drillers’ Assistants, Drill Supervisors, Geologists, etc. Geoscientist, Geophysicists, Drillers, Toolpushers, Installation Managers, Field Supervisors etc. Investment Decision Phase A business case for developing the reserve is made. Costs of constructions, extraction, processing and delivering to market are weighed against the current and predicated commodity prices and global demand. Skills required: Engineers, Business Analysts, Finance Analysts, Accountants, Board of Management, Lawyers, Community Liaison / media etc. Construction Phase Construction prepares the site and builds the infrastructure required for the operation to meet its objectives. On a mine site this is typically involves the clearing of land and the building of process plants, offices, change rooms, cribs and roads as required. For Oil and Gas extraction this phase involves the drilling of production wells to develop fields and produce oil and gas and through to well completions and the installation of valves and pipes to control pressure and flows. The constructions of production platforms and associated pipelines and land processing and storage facilities. In both cases the construction of airports, harbour/port facilities and residential camps may be involved. Occasionally the construction of power stations as well as significant roads and railways infrastructure are required. Minerals sector skills requirement: Oil Gas skills requirement: Engineers (Civil, Structural, Mining), Construction Managers, Surveyors, Draftspersons, Metal Trades, Electricians, Instrumentation Fitters, Truck Drivers, Mobile Plant Operators, Carpenters, Plumbers, Coded Welders, Steel Fixers, And Grano Workers/Concrete Finishers, Etc. Drillers, Engineers (Structural, Subsea, Reservoir), Draftspersons, Metal Trades, Electricians, Instrumentation Fitters, Plumbers, Coded Welders, ROV Operators Etc. LNG Plant Development Condensate Tanks- Mobile Plant Operators, Labourers, Grano Workers/Concrete Finishers, Steel Fixers, Carpenters, Electricians, Welders, Riggers, Pipe Fitters, Plasterers/Boilermakers, Support Trades. Jetty development - Operators/Labourers, Grano Workers/Concrete Finishers, Steel Fixers, Carpenters, Electricians, Welders, Riggers, Pipe Fitters, Plasterers/Boilermakers, Support Trades. Camp and airport development – Civil Engineers, Draftspersons, Surveyors, Mobile Plant Operators, Plumbers, Carpenters, Electricians, Metal Trades, Grano Workers, Labourers. Page 13
  • 18. Production Phase The phase of operation that begins the produce an income for the operation by extracting minerals, oil or gas. Extraction Minerals sector skills requirement: Oil Gas skills requirement: Mining Engineers, Mining Managers, Quarry Managers, Geologists, Surveyors, Core Technicians, Production Drillers, Development Drillers, Blasthole Drillers, Service Crew, Truck Drivers, Blast Technicians, Mobile Plant Operators, Warehouse Logistics, Cleaners, Catering, Heavy Diesel Mechanics, Light Vehicle Mechanics, High Voltage Electricians, Environmentalists, Safety Health Advisors etc. Reservoir Engineers, Process Technicians, Mechanical Maintenance Technicians, Safety Health Advisors, Marine Biologists/ Environmentalists, Corrosion Control Operators etc. Processing In mineral mining this phase typically coincides with production and involves the removing of impurities and/concentrating of commercial commodities. In petroleum extraction this phase typically coincides with production and involves the removing of impurities and/or liquefying gas products. The separation of oil from gas and the light oil condensate formed naturally from gas. Minerals sector skills requirement: Oil Gas skills requirement: Metallurgists, Process Technicians, Crusher Operators, Electricians, Instrumentation Fitters, Maintenance Technicians, Laboratory Technicians, Corrosion Control Technicians etc. Reservoir Engineers, Process Technicians, ROV Operators, Control Room Technicians, Maintenance Technicians etc. Transporting Moving the commodity from the site of extraction to the end user. Minerals are typically transported by truck or train to a port for transportation by ship to clients overseas. Oil and gas is either transported to shore by pipeline or loaded directly onto ships for transport to overseas refineries and clients. Minerals sector skills requirement: Oil Gas skills requirement: Truck drivers, Train Drivers, Loader Operators, Heavy Diesel Mechanics, Railway Line Maintenance Crew, Ship Loaders, Hatch Operators, Harbour Master, Reclaimer Operators etc. Control Room Technicians, Process Technicians, Pipeline Technicians etc. Care and Maintenance Phase This phase usually occurs when it is not economical to run the operations. This may be due to poor commodity prices or lack of demand for the commodity. The operation ceases production and processing but machinery is maintained and mines are kept free of water so that it can become operational at some time in the future. Minerals sector skills requirement: Oil Gas skills requirement: Maintenance Technicians and Mechanical Fitters Process Technicians and Maintenance Technicians Closure and Rehabilitation Phase This phase occurs when the decision is made to close the operation permanently. All buildings and infrastructure are removed and the site is rehabilitated to return it to as close to natural state as practicable. Page 14
  • 19. Minerals sector skills requirement: Oil Gas skills requirement: Mobile Plant Operators, Environment Officers, Environmental Drillers, etc. Environmental Drillers, Environmental/Marine Officers WORKFORCE STATISTICS The DMP reported employment in the mining sector peaking in October 2008 with a monthly average of 77,528. The global economic downturn led to a fall with a 2008–09 employment average of 71,329. In November 2008 many expansions projects were shelved and projects were downsized; deferred or placed on care and maintenance. By January 2009, average mining employment numbers had fallen to 68,692 (31,951 employees and 36,741 contractors), a decline of around 11% from October 2008. Between the peak in October 2008 and June 2009, total employment fell by approximately 9,100 jobs. However, employment in June 2009 was only 2,924 below July 2008 levels. Exploration employment for personnel working on greenfield sites for 2008–09 averaged 2338. 31% of WA mining employees work in the Iron Ore sector, 19% in Gold mining, 18% in Nickel and 14% in Bauxite. . 0500010000150002000025000 Base MetalsBauxite ‐AluminaChromiteClaysCoalConstruction MaterialsDiamondsDimension StoneGoldHeavy Mineral SandsIndustrial Pegmatite … Iron OreLimestone –Lime sandManganese OreMineral/CompanyMolybdenumNickelPetroleum ProductsPhosphateRare EarthsSaltSilica ‐Silica SandSilverTalcTin ‐Tantalum ‐LithiumVanadiumVarious PortsAll Other Materials Average Number of Employees In The WA Minerals And Petroleum Industries2007 2008 Employment in 5 commodities was not greatly affected by the global economic downturn and these included iron ore, gold, alumina, coal and petroleum extraction. Page 15
  • 20. Page 16 . Workforce Demographics In 2008 the minerals sector workforce comprised 36 % tradespersons and related workers, 35 % semi-skilled workers (principally machinery operators and drivers), 10 % professionals, 9 % labourers, 5 % technicians and 5 % managers and administrators4. Over recent years the greatest growth has been in the technician and trades category. The majority of employees work full time, and their median age is 40 years compared with a median age for all industries of 37 years. However, coal sector employees are older on average than those in the metalliferous sector. Women comprise around 18% of the resource sector workforce compared to a national participation rate of 46%5 . However, women only represent 3% of all employees at mine sites, oil rigs and minerals processing operations. Some of the reasons for the industry not being attractive to females are the requirement by many companies to work away from families for extended periods of time (FIFO) and the perception that the work is hard and dirty. In the drilling sector the percentage of females is less than 1% which may be due to the additional issues of working with very small teams in isolated locations for long period of time. The minerals industry is the largest private sector employer of Indigenous people, with 5% of its direct workforce identifying as Indigenous. Most operations in remote and regional locations prefer 4 NILS (2008). The Labour Force Outlook in the Australian Minerals Sector: 2009 to 2020. 5 ABS (November 2009). 6291.0.55.003. Labour force Australia. 050001000015000200002500030000Employees By MineralAug‐07Jan‐08Feb‐08Mar‐08Apr‐08May‐08Jun‐08Jul‐08Aug‐08Sep‐08Oct‐08Nov‐080.050.0100.0150.0200.0 Feb‐2006Jun‐2006Oct‐2006Feb‐2007Jun‐2007Oct‐2007Feb‐2008Jun‐2008Oct‐2008Feb‐2009Employees (000) Gender Mix of WA Resources IndustryMalesFemalesTotal
  • 21. Page 17 local workers and are committed to increased employment of local Indigenous people who can meet their employability requirements. However, many Indigenous people located in these areas have low levels of literacy, numeracy and fitness for work attributes which precludes them from taking up training opportunities. With regards to age the minerals and petroleum industry tend to recruit mature age employees as there is a perception that age and safety behaviour are linked. With the exception of apprentices employees are typically 18 or more years old. As significant number (32%) are in the 25-34 year bracket and a similar number in the 35-44 years bracket. With 21.2% in the 45-54 year bracket and 11.3% in over 55 group. With the duration of training required for a petroleum process technician being around 5 years and an Engineer being 4 years (after 20012 UWA Engineering students may need 7 years) there is a need to plan ahead to cater for the 32.5% that can be expected to retire within the next 10 years Anecdotally, employee turnover in the minerals and energy sector is high. At some FIFO sites the turnover was as high as 30 % at the height of the last mining boom. The Australian Bureau of Statistics (ABS) reported that at February 2008 12% of mining workers had changed their employer in the previous 12 months. Unfortunately, data on the amount of labour “churn” as compared to labour moving to other industries or out of the workforce is very limited. In drilling employee turnover is high in companies, but personnel often stay within the industry once they pass the threshold of around four months. This is partly a reflection of the contractor role, as well as the nature of work. Much drilling is undertaken by drilling contractors and the contracts with resource companies can be short or long term contracts. Where contracts offered by the principal (usually a mine) are longer – e.g. where the drilling contractor has a 2-3 year contract, turnover of personnel is much lower as employers prefer to maintain people they have trained, and personnel prefer to stay on where the employer and the work suits them. Recording workforce demographics is not as wide spread in the resources sector as in the government sector and therefore the data provided is sourced from the ABS 6291.0.55.003 Labour Force, Australia, Detailed, Quarterly, Table 06 Employed persons by Industry Subdivision and Sex. Workforce Education Levels The 2006 ABS census data reports post school qualifications for the Western Australian mining employees as 48% having a Certificate I-IV level qualification, compared to 27% with a Bachelor degree and only 6% with a Postgraduate Degree. NCVER 2007 data shows that at a national level around 30% of minerals sector employees hold a diploma or above qualification (around 20 % have a bachelor degree or higher); 28 % hold a Certificate level III or IV qualification; 5 % hold a Certificate I or II level qualification; and 37 % have no identified qualification6. Since 2006 there has been effort made in promoting and the taking up of nationally recognised training and traineeships. This along with the increase in recruitment of interstate fly in fly personnel (not reflected as ABS data as data is based on State of residence) may mean that the following do not truly represent the industry in 2010. 6 NCVER (2007). Mining: Industry Training 2007; exploring the relationship between industry and the VET system. 0% 5% 10% 15% 20% 25% 30% 35% 15‐2425‐3435‐4445‐5455‐6465 OverAge Ditribution of Oil Gas Employees and National Average June 2008NationalOil Gas
  • 22. 02,0004,0006,0008,00010,00012,00014,000Qualifications held by WA Mining Employees Source: ABS Cat. 2068.0 0% 10% 20% 30% 40% 50% 60% Postgraduate DegreeGraduate Diploma Graduate CertificateBachelor DegreeAdvanced Dip DiplomaCertificateNot stated% of Personnel Reporting a Qualifcation Source: ABS Cat. 2068.0 Current Trends in Staffing Patterns There is a distinction to be drawn between ‘labour shortage’, or a lack of new entry level recruits, and a ‘skills shortage’ or lack of qualified trades, technicians and professional people. The resources sector has suffered from skills shortages rather than labour shortages due to their ability to pay wages that will draw employees from other industries. On the other hand the drilling sector compete with mining, construction and defence for new entrants and does experience labour shortages. Accurate labour demand forecasts are difficult to obtain due to a number of factors, including the reluctance of enterprises to release commercially sensitive data and the potential for ‘double counting’ if there is overlap between contractors’ and mining companies’ data. Page 18
  • 23. 01000020000300004000050000 1987198819891990199119921993199419951996199719981999200020012002200320042005200620072008 Mining EmploymentEmployeesContractors Short term contracting is the norm in the construction phase of a project. Contracting is strategy to provide workforce flexibility for projects with finite start and end dates, different workforce needs at different stages of the construction process. Resource sector project construction and ‘shut down maintenance’ work requires particular skills and flexibility which has resulted in experienced individuals being particularly sought by both service companies. There has been an increase in the use of contractors even during operational phases with mining services being contracted out. Post global economic downturn the use of contractors fell in some industry sectors reflecting the dynamic nature of this employment method. 0% 10% 20% 30% 40% 50% 60% 70% % of Contractors NATIONAL COMPETENCY STANDARDS AND NATIONAL TRAINING PACKAGES Competency based training has been utilised by the resources industry for many years with many companies providing ongoing in-house training to operators and university graduates. For many years the national competency standards have been recognised as a benchmark and much in-house (non-nationally recognised) training is aligned to the national standards. Industry’s understanding of the training package and its associated units of competency, qualification structure and assessment guidelines continues to grow. Experience with and the utilisation of the VET sector and nationally recognised training is also growing. The attainment of qualifications is not seen as a major focus for the resources industry but rather training occurs with the aim of achieving an increase in safe work practices, improvements in production rates and staff retention. Generally the resources industry does not access the public funding for training; some of this relates to the perceived inflexibility of the training system; the industry mainly operates out of remote and regional areas and a large part of the resources industry is focussed on skill sets as opposed to full qualifications; this has resulted in the need to fund their own development programs. Page 19
  • 24. Page 20 Industry supported the recent rationalisation of the BCC03; RII06; MNM05; DRT03; MNC04 and MNQ03 training packages to form the Resources and Infrastructure (RII09) training package. INDUSTRY OCCUPATIONAL OVERVIEW The following are typical job roles found in the resources sector (P=petroleum, M=mining, C=construction). Job Role Qualifications P M C Miners – Open Cut or Surface Mining# Certificate II in Surface Extraction Operations Certificate III in Surface Extraction Operations Certificate IV in Surface Extraction Operations Diploma of Surface Operations Management 9 Miners – Underground Mining# Certificate II in Underground Metalliferous Mining Certificate III in Underground Metalliferous Mining Certificate IV in Metalliferous Mining Operations (Underground) Diploma of Underground Metalliferous Mining Management 9 Miners – Coal Mining# Certificate III in Surface Extraction Operations Certificate IV in Surface Extraction Operations Diploma of Surface Operations Management Certificate IV in Surface Coal Mining (Open Cut Examiner 9 Mining - Managers and Supervisors# Advanced Diploma of Metalliferous Mining Advanced Diploma of Extractive Industries Management Advanced Diploma of Surface Coal Mining 9 Process Operators# Certificate II in Resource Processing Certificate III in Resource Processing Certificate IV in Resource Processing Diploma of Minerals Processing 9 Production Technicians# Certificate III in Process Plant Operations + skill sets Certificate IV in Process Plant Technology Diploma of Process Plant Technology Advanced Diploma of Process Plant Technology Maintenance Technicians and Mechanical Trades* Certificate III in Engineering – Mechanical (Maintenance Diesel Fitting) 9 Metal Trades* 9 Electrical And Instrumentation Trades* Certificate III in Instrumentation and Control Certificate III in Engineering – Electrical/Electronic Trade Diploma of Engineering – Advanced Trade (Mechanical and Electrical) Certificate III in Electrotechnology Electrician Certificate III in Instrumentation and Control Certificate IV in Electrical Instrumentation 9 9 Pipeline Technicians# 9 Control Room Technicians/Operators# Certificate IV in Processing 9 Administration* Certificate III IV in Business 9 9 Draftspersons* Engineering Drafting 9 Drillers, Drillers’ Assistants, Certificate II in Mining Field/Exploration Operations Certificate II in Drilling Operations Certificate III in Drilling Operations Certificate IV in Drilling Operations 9 Offshore Driller, Roustabout, Derrickman, Floorman Certificate II in Drilling Oil/Gas (Off shore) Certificate II in Drilling Oil/Gas (On shore) Certificate III in Drilling Oil/Gas (Off shore). Certificate III in Drilling Oil/Gas (On shore) Certificate IV in Drilling Oil/Gas (Off shore). 9
  • 25. Certificate IV in Drilling Oil/Gas (On shore). Drill Supervisors Advanced Diploma of Drilling Management Diploma of Drilling Operations Advanced Diploma of Drilling Management 9 9 Offshore Driller Supervisors, Toolpusher Diploma of Drilling Oil/Gas (Off shore) Diploma of Drilling Oil/Gas (On shore) Hospitality – Catering and Cleaning* Certificate III in Commercial Cookery 9 9 Laboratory Technicians* Certificate IV in Laboratory Operations 9 9 Medics Paramedics Bachelor of Nursing Bachelor of Health Science - Paramedic 9 9 Mobile Plant Operators* Front End Loader, Crane, Forklift, Skid-steer, Bogger, IT Carrier, Backhoe 9 9 Hoist Operator, Winder Driver (underground mines only) Winding Engine Driver’s Certificate Class I II examinations by DMP 9 9 Truck Drivers*# HC and/or MC class licences 9 9 Project Managers* Diploma in Project Management 9 9 9 Front line supervisors Certificate IV in Frontline Management 9 9 9 Warehousing and Logistics* Certificate III in Transport and Logistics Certificate IV in Warehousing and Logistics Bachelor of Business - Logistics and Supply Chain Management * 9 9 9 Surveyors* Bachelor of Applied Science - Surveying 9 9 Mines Rescue Team Member# Certificate III in Mine Emergency Response and Rescue 9 OHS Advisors and Managers Certificate IV in Occupational Health and Safety 9 9 9 Environmentalists* Bachelor of Applied Science - Environmental Management Bachelor of Applied Science - Marine Environment 9 9 9 Geologists and Geophysicists* Bachelor of Applied Science - Geology Bachelor of Applied Geographical Information Systems 9 9 Metallurgists* Metallurgical Technician* Bachelor of Applied Science - Metallurgy 9 Core/Corefarm Technicians* 9 9 Commercial Analysts / Accountants* Bachelor of Arts / Bachelor of Business - Accounting 9 9 9 Ballast Controller Bachelor of Arts / Bachelor of Business - Accounting 9 Deep Sea Diver 9 Integrated Rating Integrated Rating Certificate, Offshore crane operators licence, Scaffolding, dogging and rigging 9 Radio Operator* Radio Operator Licence, Sea Rescue, 9 Remote Operated Vehicle (ROV) Operator ROV Operator Certificate 9 Human resources * Bachelor of Business - Human Resource Management 9 9 9 Marketing * Bachelor of Business - Marketing 9 9 Public and Media Relations * Bachelor of Business - Public Relations Bachelor of Media and Communication 9 9 Page 21
  • 26. Page 22 Lawyers Contracts Management * Bachelor of Laws 9 9 Engineers Scientists General Bachelor of Civil and Environmental Engineering Bachelor of Civil Engineering Bachelor of Engineering Bachelor of Engineering – Chemical Bachelor of Engineering - Civil - Geotechnical Bachelor of Engineering - Civil – Project Engineering and Management Bachelor of Engineering - Surveying and Geoinformation Systems Bachelor of Science - Geology and Geophysics 9 9 Engineers Mining Bachelor of Engineering - Mining Bachelor of Science - Extractive Metallurgy 9 Engineers Petroleum Bachelor of Engineering - Petroleum Bachelor of Engineering – Subsea 9 Radiation Safety Officers Bachelor of Science degree 9 Ventilation Officers (Underground mines) Surface Ventilation Technicians Course Certificate IV in Surface Ventilation Officer Advanced Diploma in Mine Ventilation 9 Underground Supervisor Underground supervisor’s certificate examination by DMP Passed both the mining practice and the mining law examinations set by the DMP or Degree, Diploma or Associate Diploma in Mining Engineering Quarry Manager Quarry manager’s certificate examination by DMP Diploma in Mining or Engineering Associate Diploma in Surface Mining Degree or Diploma in Geology Bachelor of Engineering in Mining Mine Manager First class mine manager’s certificate - examination by DMP Bachelor of Engineering in Mining #denotes job roles which training as traditionally been provided on the job. *denotes job roles which are not seen as areas of skill shortage either because the sector can successfully recruit from other industries or there is adequate supply. FUTURE LABOUR DEMANDS The Pilbara Industry's Community Council’s April 2010 report ‘Planning for resources growth in the Pilbara: revised employment population projections to 2020’ has estimated the growth in employment in the mining sector for the Pilbara region up to 2020. Based on information available as at March 2010, total operational resource related employment in the Pilbara is projected to grow from some 19,000 in 2008 to some 47,000 in 2015, reaching 53,000+ by 2020. These totals include local jobs required to support direct employment in the Pilbara and FIFO positions but exclude construction workforce numbers which are shown separately. Residential employment increases by 28% between 2010 and 2015, from 15,900 to some 20,300, with growth moderating thereafter7. FIFO projections for the Pilbara region grow at a faster rate, increasing by 83% between 2010 and 2015 and by a further 23% to 2020. 7 This moderation may be partly explained by company estimates not including expansion plans for later in the projection period.
  • 27. 01000020000300004000050000600002008201020152020Pilbara Resource Related Employment 2008‐2020ResidentalFIFOTotal In 2008 there was a majority of people employed under residential conditions but in 2010 the percentage of residential and FIFO employees is close to equal by 2020 it is expected that 66% of the workforce will be FIFO. By 2015 92% of FIFO workers will be in the iron ore sector. Residential FIFO 2008 66% 34% 2010 51% 49% 2015 42% 58% 2020 38% 62% Projected construction employment in the Pilbara is over 22,000 in 2010, peaking at some 28,000 in 2012 and dropping sharply away from 2015 onwards. These numbers are likely to be conservative because a number of companies have only chosen to include expansion/new projects at an advanced planning or approvals stage. Nearly all of these workers can be expected to be FIFO. CURRENT AND EMERGING SKILL / LABOUR GAPS Mineral and petroleum companies were asked to identify job roles which are hard to recruit due to an including: • S kills shortage prior to economic downturn, or • C urrent skills shortage; or • Inadequate sized pool of suitable candidates; or • Forecast strong demand which will likely lead to a skill shortage. Job Title Relevant Qualifications PROFESSIONAL ROLES Engineering and Science Engineers (all disciplines) Bachelor of Engineering Geologists Bachelor of Geology Geophysicists Bachelor of Geophysics Petrophysicists Bachelor of Geology, Bachelor of Geophysics or Petroleum Engineering Process Engineers Bachelor of Engineering Petroleum Engineer Bachelor of Engineering MSc degree in Reservoir or Petroleum Engineering Reservoir Engineer MSc degree in Reservoir or Petroleum Engineering Risk Engineer Bachelor of Engineering Master of Science Degree in Safety Engineering and Risk Management Page 23
  • 28. TECHNICAL ROLES Exploration and Drilling Drillers Certificate III in Drilling Operations Certificate III in Drilling Oil/Gas (Off shore). Certificate III in Drilling Oil/Gas (On shore) Certificate IV in Drilling Operations Certificate IV in Drilling Oil/Gas (Off shore). Certificate IV in Drilling Oil/Gas (On shore). Drillers’ assistants Certificate II in Drilling Certificate II in Drilling Operations Certificate II in Drilling Oil/Gas (Off shore) Certificate II in Drilling Oil/Gas (On shore) MAINTENANCE ROLES Maintenance Planners Maintenance Technicians and Mechanical Trade Certificate III in Engineering – Mechanical (Maintenance Diesel Fitting) Maintenance Engineer (on and offshore) Metal Trades* Metal Trades Apprentices Electrical And Instrumentation Trades* Electrical and Instrumentation Technicians Electrician Electricians (duel Trade) Instrumentation Electricians/ Fitters Certificate III in Instrumentation and Control Certificate III in engineering – Electrical/Electronic. Certificate III in Engineering – Electrical/Electronic Trade Diploma of Engineering – Advanced Trade (Mechanical and Electrical) Certificate III in Electrotechnology Electrician Certificate III in Instrumentation and Control Certificate IV in Electrical Instrumentation Electrical Team leaders Supervisors Plant Mechanic PARAPROFESSIONAL ROLES Business Improvement Manager Contract Managers and Specialists Health and Safety Advisors and Specialists Certificate IV in Occupational Health and Safety Group Leaders (ie Front Line Supervisors) MARITIME ROLES Marine 1st Engineer Marine Engineer SPECIALIST ROLES Powerhouse Controllers Diploma of ESI Generation (Systems Operation) PROCESS CONTROL ROOM ROLES Production Area Central Control Room Role Production Area Process Role Production Area Utilities Role PRODUCTION TECHNICIANS Minerals Process Plant Operator Certificate III in Process Plant Operations + skill sets Process Technicians (Gas Oil) Production Technicians# Certificate III in Process Plant Operations + skill sets Certificate IV in Process Plant Technology Diploma of Process Plant Technology Advanced Diploma of Process Plant Technology NON TECHNICAL ROLES Purchasing, Transport and Logistics Warehousing and Logistics Technicians Procurement Officers Miscellaneous Page 24
  • 29. Facility Security Officer Role Certificate III in Security Operations Road Train - Truck Drivers HC and/or MC class licences Train Drivers Certificate IV in Transport and Distribution (Rail Operations) Energy Skills Queensland identified six critical issues which they link to meeting skills and labour demand. Issue Affected Occupational Groups 1 . Critical shortfall in labour supply Professional, technical and non technical or unskilled groups. 2 . Critical shortfall in skills supply Professional, technical and non technical or unskilled groups. 3. Potential for graduates not to be competent in meeting workplace requirements - occurs in bother the professional and technical occupational groupings. Professional and technical 4. Inadequate capacity and capability of education and training organisation to respond to growth in demand for graduates. Professional and technical 5. Off the shelf generic competency based training packages misaligned with industry needs. Technical 6. Replacement demand – loss of skills, experience and knowledge dues to aging workforce. Professional and technical OPERATION CRITICAL JOB ROLES Mineral and petroleum companies were asked to identify job roles which if not filled would cause disruption to the meeting of core business - the following where identified. Maritime Skills Coxswain Role Maintenance Roles Marine 1st Engineer Role Crane Operator Role Marine Chief Engineer/Officer Role Electrical Supervisor Marine Engine Room Watchkeeper Role Electricians Marine Engineer Watchkeeper Role Instrumentation Electricians/ Fitters Marine Integrated Ratings Role Mechanical Role Marine Master Role Permit Control Officer Role Marine Navigation Officer Role Recognised Person Electrical Role Marine Navigational Watchkeeper Role Senior Electrical Officer Role Medical and Emergency Response Roles Management and Planning Medic Assistant Role Mine / Quarry Manager Medic Role Petro physicist Emergency Coordinator Role Reservoir Engineer Emergency Team Leader Role Powerhouse Controller Emergency Team Member Role Emergency Commander Role Control Room Operators CCR Scribe Role Refinery Process Controller Facility Security Officer Role Mineral Central Control Room Role Fast Rescue Craft Role Fire Rescue Operator Technician Roles Muster Checker Role Mineral Processing Technician / Plant Operator Muster Coordinator Role Refinery Process Technician Production Area Utilities Role Port and Shiploading Roles Hatch Officer Miscellaneous Roles Shiploader Operator Helicopter Landing Officer Role Train Drivers Page 25
  • 30. Page 26 EMERGING OCCUPATIONS Uranium mining will require Radiation Safety Officers, who monitor radiation at mine sites and individuals must have a Bachelor of Science degree. With the increase in automation of mining activities one likely emerging occupation is that of Automation Technician. The most likely VET qualifications to provide some of the foundation skills and knowledge for this occupation are: • U EE30807 Certificate III in Electrotechnology Electrician • U EE31207 Certificate III in instrumentation and Control • MEM30405 Certificate III in Engineering – Electrical / Electronics • UEE30207 Certificate III in Computer Systems Equipment • UEE30907 Certificate III in Electronics and Communication • UEE40607 Certificate IV in Electrotechnology Systems Electrician • UEE40207 Certificate IV in Electrical Data and Voice Communication • UEE40907 Certificate IV in Industrial Electronics and Control • UEE40407 Certificate IV in Electrical Instrumentation • MMEM40105 Certificate IV in Engineering • UEE40107 Certificate IV in Computer Systems • UEE40707 Certificate IV in Electronics and Communication LNG is a relatively new industry to Australia (in large scale terms) with high technology and therefore a skills capability gap exists at a highly technical and senior level. DECLINING OCCUPATIONS • No declining occupations have been identified. Workforce Sources Prior to the 2008 global economic downturn the minerals and exploration sectors of Western Australia has experienced some difficulty in recruiting and retaining skilled personnel and this was impacting on expansion projects and immediate productivity.8 The Petroleum industry has traditionally drawn on the national and global pool of petroleum and offshore drilling professionals to recruit personnel. Countries such as Norway, the UK, the Middle East and the USA are used to source professionals. The resources sector has a number of large development projects underway or planned. The construction phase of these projects will require significant number of skilled tradespersons and labours. Major investment projects in the under-construction category are dominated by iron ore and LNG projects. Major Western Australia projects include Project Investment Status Construction Workforce Operational Workforce Gorgon Joint Venture $43 billion Committed 3500 300 Kimberley Browse LNG Precinct $20 billion Committed 3500 360 Woodside’s Pluto Train 1 LNG Plant $12 billion Commenced 4200 200 BHP Billiton’s Rapid Growth Project 5 $5.3 billion Commenced Sino Iron’s Pellet Project $5.2 billion Commenced 4000 500 Oakajee Port and Rail development $4 billion Committed Western Areas’ Flying Fox; Spotted Quoll and Lounge Lizard nickel projects $3.8 billion Committed Perdamen Chemical’s Coal to Urea Plant $3.7 billion Committed 1500 200 Newmont’s Boddington gold copper mine $3.7 billion Commenced 1500 650 8 Chamber of Minerals and Energy, 2005, Sustainable Minerals Sector Workforce
  • 31. Chevron’s Wheatstone LNG $3 billion Committed 3000 300 BHP Billiton’s Rapid Growth Project 4 $2.1 billion Committed 3500 Worsley Alumina’s refinery expansion $2.5 billion Commenced 1500 200 Australia is a highly urbanised country with approximately 89% of the population living in towns of 1000 people or more. Over half of the population live in the five large coastal cities. Australian also has a relatively mobile population with 17% of the population moving on average each year. The combination of a preference for urban living and population mobility has led to migration away from the regional and remote areas. Much of Australia’s mineral wealth in located in the North West and Eastern Goldfields regions which are remote and considered harsh environments. While in the past mining companies have constructed residential towns in these locations it has become uneconomic to do so. Current practice has seen a reliance on long distance commuting (LDC), fly in fly out (FIFO), ship in ship out (SISO) and drive in drive out (DIDO), all of which have replaced township development with residential camp development. Residential camps and townships differ in that camps are used solely for the purpose of accommodating and feeding the workforce where as townships provided the buildings and social infrastructure for not only employees but their families and service providers. FLY IN FLY OUT (FIFO) Fly-in, fly-out (FIFO) began in the offshore petroleum industry in the late 1940s. There was a rapid grown in FIFO in the 1970 and is largely driven by the expansion of remote resource projects. Whilst there is a strong business case for resource companies to employ local labour, FIFO employment is likely to be an increasing feature of resource sector operations. The high proportion of FIFO workers is due to a number of factors, including the lack of suitably skilled local people; lack of family accommodation either available in the local community or provided by companies; and the desire of many mine personnel and their families to live in areas with greater amenities such as cities. From the beginning of the resources industry to the 1950s numerous small mining towns were established. These towns were built as a response to the poor capacity and reliability of the transportation systems to delivery employees; goods and services. Historically, mining operations employed a township model. In the 1960s to mid 1980s the States mineral boom relied on residential workforces. The development and management of many of these town sites were funded by the resource companies. Late in this period company towns became part of the local government structure. From the mid 1980s to the present economic reform and a response to global competiveness pressures the establishment of town sites was replaced by FIFO practices. Throughout the world FIFO has replaced the development of residential townships as a means of accommodating employees (professional, skilled and unskilled) for remote resource operations. The last residential mining town constructed in Australia was Olympic Dam in South Australia in the mid 1980s. In the mid 1980s FIFO began to emerge as a cost-effective way to address skills shortages, to increase efficiency, and to avoid some of the social problems that can arise from developing a ‘mining town’. The growth of the resources sector since that time and the attendant pressure on local housing supply has led to an increasing reliance on long-distance commuting. It must also be recognised that FIFO provides opportunities for jobseekers living in communities where there are few local employment opportunities, thus contributing to the economy of those communities as well as the communities at the mine sites. FIFO is also appropriate for construction and expansion projects that initially require large numbers of people for a limited period of time. About 50 % of the mining operations in Western Australia use FIFO. Drive-in; drive-out (DIDO) is a factor of the relative proximity of resource sector operations to large regional centres with pre- existing levels of social infrastructure, providing the necessary amenity for relatively large populations to develop with necessary economic stimulus from government and employment growth from industry. Page 27
  • 32. FIFO rosters vary but common patterns are two weeks on, one week off, or nine days on with five days off. Domestic commute rosters are typically 2 days, 2 nights and 5 days off. 12 hour shifts are the common practice. Whilst many workers enjoy FIFO and the benefits it brings, there is also a higher than normal turnover in the FIFO workforce as some workers find the lifestyle difficult to maintain as family commitments increase. FIFO will continue to be a response to local skills shortages. In reality, even if the issues relating to increasing participation of all unemployed and underemployed people, including women, Indigenous people, and older workers, are addressed, many remote and regional areas where the minerals and energy sector operates do not have a large enough local population of working age to meet the needs of the minerals and energy sector. In a nation with a diversity of regional growth, it is imperative that there be a balanced approach between FIFO and local community development. In 2001 Professor Keith Storey identified factors inhibiting the development of new townships in remote locations including: • Costs of building and operating new resource towns; • Absence of government financial support for township development; • Longer lead time for new town approvals and construction; • Environmental implications of new town construction; • Administrative implications of managing a town; • Increased costs associated with town closure once the resources have been exhausted or the operation is no longer viable. Professor storey also identified the following as factors encouraging FIFO: • Improved quality if communications; • Improvements in the safety; reliability and cost of air travel; • Lover turnover and absenteeism levels in FIFO personnel; • Preference for metropolitan over rural living by workers and their families With inadequate manpower within Western Australia’s regional areas most remote mine sites rely on fly in fly out. Employees who participate in fly in fly out are sourced primarily from Perth and Geraldton with others being sourced from around Australia’s major centres. Public awareness campaigns are required to raise awareness of lifestyle, job and career opportunities in the minerals and energy sector, especially in Western Australia where east to west migration is problematic. However, there are some key factors which mitigate against mobility to areas of minerals and energy operation, including housing affordability, for example in Perth and regional Western Australia; housing availability, for example in the Pilbara and other regional centres; regional infrastructure issues; schooling and childcare availability; and concerns or lack of knowledge about family and social impacts of intra/interstate migration or a FIFO lifestyle. Increased labour mobility for apprentices requires additional infrastructure and on-site support, particularly for young apprentices working away from home. In addition, apprenticeship training models must be structured to take account of rosters and travel while maintaining the requirements of on and off-the-job training within operational imperatives of enterprises. SOURCING EMPLOYEES FROM OVERSEAS The resources industry has experienced difficulty in recruiting qualified and experienced professional in a number of areas and has relied on Subclass 457 BUSINESS (LONG STAY) Visas to recruit personnel from overseas. The traditional source countries for migrants in the minerals industry have been the United Kingdom, North America, New Zealand and South Africa. Professionals that have been sourced from overseas include geologists, mining engineers, geophysics, mechanical engineering technician, engineering manager, civil engineer, mechanical engineer and metal fabricators. The petroleum industry sources its professional migrants from Scotland, Norway and other petroleum producing counties. Professions sought include petroleum engineer, reservoir engineers, subsea engineers and ship's engineers. The Department of Immigrations and Citizenship reports the current number of 457 visa holders in Western Australia as: • 3300 in the mining • 290 transport and warehousing Page 28
  • 33. • 40 professional; scientific and technical • 980 accommodation and food services There has been a reduction in the number of Subclass 457 Business (Long Stay) visa applications during the last six months but the following number of applications have occurs. Sponsor Industry 2009-10 to 31 /01/10 Mining 810 Professional; Scientific and Technical 20 Accommodation and Food Services 100 Engineering - Civil 80 Primary visa applications lodged in November 2009 were 46% lower than November 2008. However; applications were 14% higher than October 2009. Application rates are steadily rising towards the levels prior to 14 September 2009 when the Migration Legislation Amendment (Worker Protection) Act 2008 was introduced. Primary visa grants in November 2009 were 43% lower than November 2008. However; grants were 21% higher than October 2009. The number of primary visa holders in Australia was 12% lower at the end of November 2009 compared to February 2009; when there was a peak of Subclass 457 primary visa holders in Australia. Application rates in the Subclass 457 Business (Long Stay) Visa at the end of the 2008-09 program year have been significantly lower than those of the corresponding period in the 2007-08 program year; reflecting the different economic conditions of the 2008-09 program year compared to the previous year. The number of primary Subclass 457 visa applications lodged in June 2009 was 45% lower than June 2008; when there was a peak of 6270 primary applications lodged. Applications in June 2009 were 38% lower than September 2008. There was a slight increase (6%) in the total number of primary Subclass 457 visa applications lodged in June 2009 compared to May 2009. The number of Subclass 457 primary visa applications lodged in November 2009 was 46% lower than November 2008; but was 14% higher than October 2009. There was a decline in visa application rates in September and October 2009 compared with previous months due in part to the introduction of the Migration Legislation Amendment (Worker Protection) Act 2008 on 14 September 2009 and the new requirements. However; on a week-by week basis; application rates have been steadily increasing throughout October and November 2009 as employers become familiar with the new requirements. The following table contains Migration Program Outcomes for 2005-06 to 2008-09 and Planning Levels for 2009-10. Employer Sponsored 15,230 16,590 23,760 38,030 35,000 Skilled Independent 49,860 54,180 5, 890 44,590 41,600 State/Territory Sponsored 8,020 6,930 7,530 14, 060 11,200 Skilled Australian Sponsored 19,060 1,4170 14,580 10,500 12,300 Distinguished Talent 100 230 210 200 200 Business Skills 5,060 5,840 6,570 7,400 7,800 Total 97,340 97,920 108,540 114,780 108,100 Employer Sponsored Immigration Demand in the Employer Sponsored immigration increased from 21,023 lodgements in 2006-07; to 28,866 in 2007-08 and 42,049 in 2008-09. The Employer Sponsored category outcome for 2008-09 was 38,026 an increase of 60.0% (14,264 places) on 2007-2008 year. This outcome is comprised of three components: 1 . Employer Nomination Scheme (ENS) with an outcome of 27,150. 2 . Regional Sponsored Migration Scheme (RSMS) with an outcome of 8,811. 3. Labour Agreement (LA) with an outcome of 2,065. Page 29
  • 34. The 2008-09 Employer Sponsored outcomes now comprises 33.1% of the Skill Stream compared to 21.9% in 2007-08 and 16.9% in 2006-07. Demand in this category is high and; accordingly; the planning level for 2008-09 was increased from an initial level of 28,000 to a revised level of 37,080. This compares to 22,800 in 2007-08. As at 30 June 2009; there were 12,287 on hand applications for visas in the Employer Sponsored category; with an average of 3,500 applications received every month (2,400 applications per month in 2007- 08). The continuation of this high number of applications is crucial to the delivery of the 2009-10 planning level of 35,000. Barriers to Employment For many unemployed, underemployed, females and indigenous individuals the barriers to employment in the minerals and energy sector include the lack of foundation language, literacy and numeracy skills; the lack of employability skills such as communication skills, teamwork, problem- solving, planning and self-management as well as a general lack of fitness for work. For many the lack of basic education or lack of local training opportunities reduces their ability to gain the skills needed for the minerals sector workforce To work in the resources sector the following are pre-requite and therefore may be considered by many as barriers to entry into the industry. 1. Fit for work – a pre-employment medical fitness examination is usually required as is a drug screen. 2. The ability to read and write English 3. Colour blindness may limit employment opportunities 4. Minimum age of 18 years unless an apprentice. Many prescription drugs are not allowed to be used by resource employees and this along with ongoing drug and alcohol testing may prohibit an individual from obtaining or retention of employment. The lack of an industry recognised national entry-level qualification impacts on the ability to identify pathways into the sector, resulting in examples of training being undertaken with no employment outcome. This is sometimes due to the lack of industry relevant work experience and working conditions during training. The lack of employment outcomes frustrates jobseekers, training providers and employers. An understanding of the way the minerals and energy sector operate, their skills needs and their recruitment practices is necessary for any entry level training to be considered as relevant and appropriate by employers. Although mine sites prefer qualified and experienced personnel; during skills shortages most will take on unskilled personnel and train them as equipment operators, miners or process plant operators. Individuals who have obtained mobile plant and heavy vehicle licences as well as WorkSafe tickets for conducting high risk work are often looked favourably upon over persons without relevant tickets. WHAT MAKES EMPLOYMENT LESS ATTRACTIVE? Many people choose not to seek employment in the resources sector, particularly if it involves relocating from a metropolitan area to a regional area or Interstate or if moving from another industry sector. There are financial barriers to relocation to remote and regional areas and concerns over return on investment and affects on the family. The minerals sector has a culture of full-time work and long hours also impacts on its ability to attract and retain people. Ten to twelve hour days and rosters for anywhere from 5 days to 3 weeks can be found. Fly in fly out (FIFO) employment is becoming the main method of employment for many remote operations and this requires employees to be transported to the exploration site, mine site or platform for the duration of their swing. A swing may consist from 5 to 21 days onsite followed by a period of time when employees are transported back to a major centre/airport for a period of rest and recreation with their family. Some conditions at fly in fly out sites make working in the industry unattractive. • F ear of flying Helicopters and small planes are often used to transport personnel to site. Page 30