
Recommended
More Related Content
Viewers also liked
Viewers also liked (13)
Similar to July 2015 Business Scan
Similar to July 2015 Business Scan (20)
July 2015 Business Scan
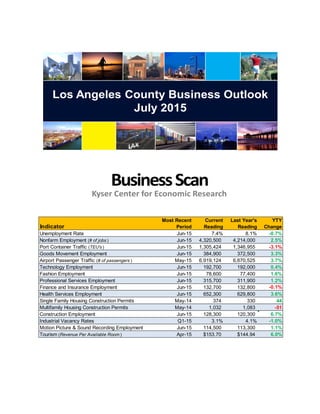
- 1. Los Angeles County Business Outlook July 2015 BusinessScan Kyser Center for Economic Research Indicator Most Recent Period Current Reading Last Year's Reading YTY Change Unemployment Rate Jun-15 7.4% 8.1% -0.7% Nonfarm Employment (# of jobs ) Jun-15 4,320,500 4,214,000 2.5% Port Container Traffic (TEU's ) Jun-15 1,305,424 1,346,955 -3.1% Goods Movement Employment Jun-15 384,900 372,500 3.3% Airport Passenger Traffic (# of passengers ) May-15 6,919,124 6,670,525 3.7% Technology Employment Jun-15 192,700 192,000 0.4% Fashion Employment Jun-15 78,600 77,400 1.6% Professional Services Employment Jun-15 315,700 311,900 1.2% Finance and Insurance Employment Jun-15 132,700 132,800 -0.1% Health Services Employment Jun-15 652,300 629,800 3.6% Single Family Housing Construction Permits May-14 374 330 44 Multifamily Housing Construction Permits May-14 1,032 1,083 -51 Construction Employment Jun-15 128,300 120,300 6.7% Industrial Vacancy Rates Q1-15 3.1% 4.1% -1.0% Motion Picture & Sound Recording Employment Jun-15 114,500 113,300 1.1% Tourism (Revenue Per Available Room ) Apr-15 $153.70 $144.94 6.0%
- 2. 0% 2% 4% 6% 8% 10% 12% 14% Jan-06 Jun-06 Nov-06 Apr-07 Sep-07 Feb-08 Jul-08 Dec-08 May-09 Oct-09 Mar-10 Aug-10 Jan-11 Jun-11 Nov-11 Apr-12 Sep-12 Feb-13 Jul-13 Dec-13 May-14 Oct-14 Mar-15 Unemployment Rate Seasonally Adjusted, June 2015 Source: California EDD, Labor Market Information Division 7.4% CA: 6.3% US: 5.3% 2,600,000 2,800,000 3,000,000 3,200,000 3,400,000 3,600,000 3,800,000 4,000,000 4,200,000 4,400,000 4,600,000 Jan-06 Jun-06 Nov-06 Apr-07 Sep-07 Feb-08 Jul-08 Dec-08 May-09 Oct-09 Mar-10 Aug-10 Jan-11 Jun-11 Nov-11 Apr-12 Sep-12 Feb-13 Jul-13 Dec-13 May-14 Oct-14 Mar-15 Nonfarm Employment Not Seasonally Adjusted, June 2015 Y/Y +2.5% +106,500 jobs Source: California EDD, Labor Market Information Division
- 3. - 200,000 400,000 600,000 800,000 1,000,000 1,200,000 1,400,000 1,600,000 Jan-06 Jun-06 Nov-06 Apr-07 Sep-07 Feb-08 Jul-08 Dec-08 May-09 Oct-09 Mar-10 Aug-10 Jan-11 Jun-11 Nov-11 Apr-12 Sep-12 Feb-13 Jul-13 Dec-13 May-14 Oct-14 Mar-15 Port Container Traffic – Los Angeles & Long Beach Ton Equivalent Units (TEUs), June 2015 YTY: -3.1% Sources: Port of Los Angeles, Port of Long Beach, LAEDC Los Angeles: -2.0% YTY Long Beach: -4.4% YTY - 50,000 100,000 150,000 200,000 250,000 300,000 350,000 400,000 450,000 Jan-06 Jun-06 Nov-06 Apr-07 Sep-07 Feb-08 Jul-08 Dec-08 May-09 Oct-09 Mar-10 Aug-10 Jan-11 Jun-11 Nov-11 Apr-12 Sep-12 Feb-13 Jul-13 Dec-13 May-14 Oct-14 Mar-15 Goods Movement Employment* Not Seasonally Adjusted, June 2015 Y/Y +3.3% +12,400 jobs Source: California EDD, Labor Market Information Division *NAICS Codes: 41-000000, 43-400089 (Transportation and Warehousing; Wholesale Trade)
- 4. - 1,000,000 2,000,000 3,000,000 4,000,000 5,000,000 6,000,000 7,000,000 8,000,000 Jan-06 Jun-06 Nov-06 Apr-07 Sep-07 Feb-08 Jul-08 Dec-08 May-09 Oct-09 Mar-10 Aug-10 Jan-11 Jun-11 Nov-11 Apr-12 Sep-12 Feb-13 Jul-13 Dec-13 May-14 Oct-14 Mar-15 Airport Passenger Traffic -- Burbank, Long Beach & Los Angeles Passengers Sources: Burbank Bob Hope Airport, Long Beach Airport, Los Angeles International Airport May 2015 Total Passengers: 6.9 million Total Change: +3.7% YTY Burbank: +2.1% YTY Long Beach: -13.5% YTY Los Angeles (LAX): +4.5% YTY - 50,000 100,000 150,000 200,000 250,000 Jan-06 Jun-06 Nov-06 Apr-07 Sep-07 Feb-08 Jul-08 Dec-08 May-09 Oct-09 Mar-10 Aug-10 Jan-11 Jun-11 Nov-11 Apr-12 Sep-12 Feb-13 Jul-13 Dec-13 May-14 Oct-14 Mar-15 Technology Employment Not Seasonally Adjusted, June 2015 Y/Y +0.4% +700 jobs Source: California EDD, Labor Market Information Division NAICS Codes: 31-334000, 31-336400, 32-325400, 50-518000, 60-541500, 60-541600, 60-541700
- 5. - 20,000 40,000 60,000 80,000 100,000 120,000 Jan-06 Jun-06 Nov-06 Apr-07 Sep-07 Feb-08 Jul-08 Dec-08 May-09 Oct-09 Mar-10 Aug-10 Jan-11 Jun-11 Nov-11 Apr-12 Sep-12 Feb-13 Jul-13 Dec-13 May-14 Oct-14 Mar-15 Fashion Employment Not Seasonally Adjusted, June 2015 Y/Y +1.6% +1,200 jobs Source: California EDD, Labor Market Information Division NAICS Codes: 32-315000, 41-424300, 32-313000 - 50,000 100,000 150,000 200,000 250,000 300,000 350,000 400,000 Jan-06 Jun-06 Nov-06 Apr-07 Sep-07 Feb-08 Jul-08 Dec-08 May-09 Oct-09 Mar-10 Aug-10 Jan-11 Jun-11 Nov-11 Apr-12 Sep-12 Feb-13 Jul-13 Dec-13 May-14 Oct-14 Mar-15 Professional Services Employment Not Seasonally Adjusted, June 2015 Y/Y +1.2% +3,800 jobs Source: California EDD, Labor Market Information Division NAICS Codes: 60-540000, 60-541500
- 6. - 20,000 40,000 60,000 80,000 100,000 120,000 140,000 160,000 180,000 200,000 Jan-06 Jun-06 Nov-06 Apr-07 Sep-07 Feb-08 Jul-08 Dec-08 May-09 Oct-09 Mar-10 Aug-10 Jan-11 Jun-11 Nov-11 Apr-12 Sep-12 Feb-13 Jul-13 Dec-13 May-14 Oct-14 Mar-15 Finance and Insurance Employment Not Seasonally Adjusted, June 2015 Y/Y -0.1% -100 jobs Source: California EDD, Labor Market Information Division - 100,000 200,000 300,000 400,000 500,000 600,000 700,000 Jan-06 Jun-06 Nov-06 Apr-07 Sep-07 Feb-08 Jul-08 Dec-08 May-09 Oct-09 Mar-10 Aug-10 Jan-11 Jun-11 Nov-11 Apr-12 Sep-12 Feb-13 Jul-13 Dec-13 May-14 Oct-14 Mar-15 Health Services Employment Not Seasonally Adjusted, June 2015 Y/Y +3.6% +22,500 jobs Source: California EDD, Labor Market Information Division NAICS Codes: 32-325400, 60-620000
- 7. - 200 400 600 800 1,000 1,200 Jan-06 Jun-06 Nov-06 Apr-07 Sep-07 Feb-08 Jul-08 Dec-08 May-09 Oct-09 Mar-10 Aug-10 Jan-11 Jun-11 Nov-11 Apr-12 Sep-12 Feb-13 Jul-13 Dec-13 May-14 Oct-14 Mar-15 Single Family Housing Construction Permits # of permits Source: CIRB, California Home Building Foundation May 2015 374 permits -7.5% YTD - 500 1,000 1,500 2,000 2,500 3,000 Jan-06 Jun-06 Nov-06 Apr-07 Sep-07 Feb-08 Jul-08 Dec-08 May-09 Oct-09 Mar-10 Aug-10 Jan-11 Jun-11 Nov-11 Apr-12 Sep-12 Feb-13 Jul-13 Dec-13 May-14 Oct-14 Mar-15 Multi Family Housing Construction Permits # of permits Source: CIRB, California Home Building Foundation May 2015 1,032 permits +6.2% YTD
- 8. - 20,000 40,000 60,000 80,000 100,000 120,000 140,000 160,000 180,000 Jan-06 Jun-06 Nov-06 Apr-07 Sep-07 Feb-08 Jul-08 Dec-08 May-09 Oct-09 Mar-10 Aug-10 Jan-11 Jun-11 Nov-11 Apr-12 Sep-12 Feb-13 Jul-13 Dec-13 May-14 Oct-14 Mar-15 Construction Employment Not Seasonally Adjusted, June 2015 Y/Y +6.7% +8,000 jobs Source: California EDD, Labor Market Information Division 0% 1% 2% 3% 4% 5% 6% 06Q1 06Q3 07Q1 07Q3 08Q1 08Q3 09Q1 09Q3 10Q1 10Q3 11Q1 11Q3 12Q1 12Q3 13Q1 13Q3 14Q1 14Q3 15Q1 Industrial Vacancy Rates Q1 2015 Source: Cushman & Wakefield 3.1% Central/DT: 2.8% Mid-Cities: 3.3% San Fernando Valley: 3.8% South Bay: 3.3% San Gabriel Valley: 2.3%
- 9. 0% 5% 10% 15% 20% 25% 30% 1q09 2q09 3q09 4q09 1q10 2q10 3q10 4q10 1q11 2q11 3q11 4q11 1q12 2q12 3q12 4q12 1q13 2q13 3q13 4q13 1q14 2q14 3q14 4q14 1q15 Los Angeles County Orange County Inland Empire San Diego DTLA % vacancy, quarterly averages Source: Cushman and Wakefield Office Vacancy Rates – SoCal Counties & Downtown LA -20.0% -15.0% -10.0% -5.0% 0.0% 5.0% 10.0% 15.0% Jan-08 May-08 Sep-08 Jan-09 May-09 Sep-09 Jan-10 May-10 Sep-10 Jan-11 May-11 Sep-11 Jan-12 May-12 Sep-12 Jan-13 May-13 Sep-13 Jan-14 May-14 Sep-14 Jan-15 May-15 L.A. County U.S. Motion Picture & Sound Recording Employment Not Seasonally Adjusted, June 2015 (Year-to-year percent change) L.A. County: Y/Y +1.1% +1,200 jobs Source: California EDD, Labor Market Information Division
- 10. For data inquiries please contact: George Entis Research Analyst Kyser Center for Economic Research, LAEDC 444 S. Flower Street, 37 th Floor Los Angeles, CA 90071 Tel: (213) 236-4820 Email: george.entis@LAEDC.org For media inquiries please contact: Lawren Markle Director of Public Relations and Marketing Los Angeles County Economic Development Corporation 444 S. Flower Street, 37 th Floor Los Angeles, CA 90071 Tel: (213) 236-4847 Email: lawren.markle@LAEDC.org $0.00 $20.00 $40.00 $60.00 $80.00 $100.00 $120.00 $140.00 $160.00 $180.00 $200.00 Jan-06 Jun-06 Nov-06 Apr-07 Sep-07 Feb-08 Jul-08 Dec-08 May-09 Oct-09 Mar-10 Aug-10 Jan-11 Jun-11 Nov-11 Apr-12 Sep-12 Feb-13 Jul-13 Dec-13 May-14 Oct-14 Mar-15 Revenue Per Available Room Tourism Source: PKF Consulting April 2015 Occupancy Rate: 81.5% Avg Daily Room Rate: $188.60 REVPAR: +3.8% YTY