SlideShare a Scribd company logo
Office-using employment sectors record steady gains
Continued employment growth will translate into moderately increased office
demand in Cleveland in 2015. According to the most recent estimates from the
BLS, total non-farm employment in Cleveland stood at ~1.0 million payrolls,
representing an annualized increase of 15,300 jobs or 1.5 percent. Meanwhile,
unemployment decreased 120 basis points year-over-year to 6.4 percent.
Office-using employment sectors experienced sustained employment expansion
over the last year, recording an annualized net gain of 3,100 jobs across the
metro. Employment gains were led by the professional and business services
sector, which added 1,500 jobs year-over-year.
Office employment trends (12-month change)
Source: JLL Research
Vacancy rates remain elevated, though gradually contracting downtown
Total vacancy in Cleveland stands at 20.3 percent, one of only six metropolitan
areas in the U.S. with vacancy above 20.0 percent. Elevated as it may be, the
rate has decreased steadily from its recent high water mark of 22.0 percent in
2011. With no multi-tenant office construction currently underway or scheduled to
break ground in 2015, any absorption gains will further tighten vacancy rates,
particularly downtown, where office-to-residential conversions are reducing the
available inventory. Exactly how far vacancy rates fall downtown in 2015 remains
to be seen as Key Bank hands back several floors at Key Tower and
BakerHostetler sheds up to 45,000 square feet through a planned move.
Vacancy rates
Source: JLL Research
Class A and B asking rents are slowly, very slowly, diverging
Asking rents are not particularly volatile in Cleveland, in fact, one might call them
unwavering. The average full service gross asking rent in Cleveland was $18.95
per square foot at the end of the first quarter, representing an increase of just
$0.18 per square foot over the last four years. We are however beginning to see
a divergence of asking rents between classes. Class A asking rents averaged
$22.94 per square foot at the end of the first quarter, up $0.17 year-over-year.
Oppositely, Class B asking rents averaged $17.36 per square foot, down $0.19
year-over-year. Over the coming year Class A asking rents are forecasted to
continue their gradual ascent while Class B asking rents will likely remain flat.
Asking rents
Source: JLL Research
20.3%
Total vacancy
38,870
Q1 2015 net absorption (s.f.)
-0.1%
12-month rent growth
0
Total under construction (s.f.)
0.0%
Total preleased
Office Insight
Cleveland | Q1 2015
Vacancy compression is steady, rents diverging
-10.0
0.0
10.0
2011 2012 2013 2014 Q1 2015
Financial Activities Professional & Business Services Information Government
17.0%
21.0%
25.0%
2011 2012 2013 2014 Q1 2015
Suburban Urban
$16.00
$20.00
$24.00
2011 2012 2013 2014 Q1 2015
Class A Class B
Current conditions – market and submarket Historical leasing activity
Source: JLL Research Source: JLL Research
Total net absorption (s.f.)
Source: JLL Research
Total vacancy rate
Source: JLL Research
Direct average asking rent ($ p.s.f.)
Source: JLL Research
Cleveland
658,219
342,565 316,789
-207,867
-304,696
87,184
-165,658
675,495
267,469
38,870
-500,000
-100,000
300,000
700,000
2006 2007 2008 2009 2010 2011 2012 2013 2014 Q1 2015
$19.77
$19.94
$19.45
$19.74
$19.46
$19.13
$19.05
$18.93 $18.98 $18.95
$18.50
$19.00
$19.50
$20.00
2006 2007 2008 2009 2010 2011 2012 2013 2014 Q1 2015
16.4%
18.3%
16.9%
19.6%
21.6%
22.0%
21.4%
20.9%
20.4% 20.3%
14.0%
17.0%
20.0%
23.0%
2006 2007 2008 2009 2010 2011 2012 2013 2014 Q1 2015
Suburbs
Landlordleverage
Tenantleverage
Peaking
market
Falling
market
Bottoming
market
Rising
market
CBD
1,500,000
1,700,000
2,000,000
1,500,000
300,000
0
750,000
1,500,000
2,250,000
2011 2012 2013 2014 Q1 2015
©2015 Jones Lang LaSalle IP, Inc. All rights reserved.For more information, contact: Andrew Batson | +1 216 937 4374 | Andrew.Batson@am.jll.com
Robert Kramp | +1 312 228 2470| Robert.Kramp@am.jll.com

More Related Content

What's hot

St. Louis Chart of the Week
St. Louis Chart of the WeekSt. Louis Chart of the Week
St. Louis Chart of the Week
Blaise Tomazic
 

What's hot (20)

Chicago jll employment update september 2015
Chicago jll employment update september 2015Chicago jll employment update september 2015
Chicago jll employment update september 2015
 
Minneapolis–St. Employment Update | March 2016
Minneapolis–St. Employment Update | March 2016Minneapolis–St. Employment Update | March 2016
Minneapolis–St. Employment Update | March 2016
 
JLL Detroit Employment Update August 2015
JLL Detroit Employment Update August 2015JLL Detroit Employment Update August 2015
JLL Detroit Employment Update August 2015
 
JLL Pittsburgh Chart of the Week: April 13, 2015
JLL Pittsburgh Chart of the Week: April 13, 2015JLL Pittsburgh Chart of the Week: April 13, 2015
JLL Pittsburgh Chart of the Week: April 13, 2015
 
JLL Pittsburgh Chart of the Week: April 6, 2015
JLL Pittsburgh Chart of the Week: April 6, 2015JLL Pittsburgh Chart of the Week: April 6, 2015
JLL Pittsburgh Chart of the Week: April 6, 2015
 
JLL Grand Rapids Office Insight Q4 2015
JLL Grand Rapids Office Insight Q4 2015JLL Grand Rapids Office Insight Q4 2015
JLL Grand Rapids Office Insight Q4 2015
 
Employment and Job creation for Canada - june 2016
Employment and Job creation for Canada - june 2016Employment and Job creation for Canada - june 2016
Employment and Job creation for Canada - june 2016
 
Boyle County, Kentucky Employment Report, Q3 2010
Boyle County, Kentucky Employment Report, Q3 2010Boyle County, Kentucky Employment Report, Q3 2010
Boyle County, Kentucky Employment Report, Q3 2010
 
JLL Detroit Chart of the Week: May 18, 2015
JLL Detroit Chart of the Week: May 18, 2015JLL Detroit Chart of the Week: May 18, 2015
JLL Detroit Chart of the Week: May 18, 2015
 
Minneapolis–St. Paul Employment Update | September 2016
Minneapolis–St. Paul Employment Update | September 2016Minneapolis–St. Paul Employment Update | September 2016
Minneapolis–St. Paul Employment Update | September 2016
 
Minneapolis-St. Paul JLL employment update January 2017
Minneapolis-St. Paul JLL employment update January 2017Minneapolis-St. Paul JLL employment update January 2017
Minneapolis-St. Paul JLL employment update January 2017
 
JLL Pittsburgh Chart of the Week: November 2, 2015
JLL Pittsburgh Chart of the Week: November 2, 2015JLL Pittsburgh Chart of the Week: November 2, 2015
JLL Pittsburgh Chart of the Week: November 2, 2015
 
Columbus 2020 Investor Update | March 2016 | Kenny McDonald
Columbus 2020 Investor Update | March 2016 | Kenny McDonaldColumbus 2020 Investor Update | March 2016 | Kenny McDonald
Columbus 2020 Investor Update | March 2016 | Kenny McDonald
 
Minneapolis-St. Paul Chart of the Week | August 15, 2016
Minneapolis-St. Paul Chart of the Week | August 15, 2016Minneapolis-St. Paul Chart of the Week | August 15, 2016
Minneapolis-St. Paul Chart of the Week | August 15, 2016
 
St. Louis Chart of the Week
St. Louis Chart of the WeekSt. Louis Chart of the Week
St. Louis Chart of the Week
 
St. Louis Office Outlook | Q1 2016
St. Louis Office Outlook | Q1 2016St. Louis Office Outlook | Q1 2016
St. Louis Office Outlook | Q1 2016
 
JLL Minneapolis Chart of the Week
JLL Minneapolis Chart of the WeekJLL Minneapolis Chart of the Week
JLL Minneapolis Chart of the Week
 
Minneapolis–St. Employment Update | November 2015
Minneapolis–St. Employment Update | November 2015Minneapolis–St. Employment Update | November 2015
Minneapolis–St. Employment Update | November 2015
 
Marcus & Millichap / IPA Multifamily Forum Houston - Speaker Slides
Marcus & Millichap / IPA Multifamily Forum Houston - Speaker SlidesMarcus & Millichap / IPA Multifamily Forum Houston - Speaker Slides
Marcus & Millichap / IPA Multifamily Forum Houston - Speaker Slides
 
Dr. Paul Levy: Making the Case, Building the Coalition for Municipal Tax Reform
Dr. Paul Levy: Making the Case, Building the Coalition for Municipal Tax ReformDr. Paul Levy: Making the Case, Building the Coalition for Municipal Tax Reform
Dr. Paul Levy: Making the Case, Building the Coalition for Municipal Tax Reform
 

Viewers also liked

Prince2 Project Magement certified
Prince2 Project Magement certifiedPrince2 Project Magement certified
Prince2 Project Magement certified
Costin Theodorescu
 
Compte rendu du comédims 02 2015
Compte rendu du comédims 02 2015Compte rendu du comédims 02 2015
Compte rendu du comédims 02 2015
pquentin
 
Roadmap to mobile learning
Roadmap to mobile learningRoadmap to mobile learning
Roadmap to mobile learning
haiguang fang
 
Sayed rasool zojaji nezhad
Sayed rasool zojaji nezhadSayed rasool zojaji nezhad
Sayed rasool zojaji nezhad
srzojaji
 
Planificación para o profesorado
Planificación para o profesoradoPlanificación para o profesorado
Planificación para o profesorado
satelite1
 
Inquerito resultados globais
Inquerito resultados globaisInquerito resultados globais
Inquerito resultados globais
satelite1
 
倪安东 散场的拥抱
倪安东 散场的拥抱倪安东 散场的拥抱
倪安东 散场的拥抱
scorefull
 

Viewers also liked (17)

Marcha
MarchaMarcha
Marcha
 
Prince2 Project Magement certified
Prince2 Project Magement certifiedPrince2 Project Magement certified
Prince2 Project Magement certified
 
GPI 2: MISION
GPI 2: MISIONGPI 2: MISION
GPI 2: MISION
 
Compte rendu du comédims 02 2015
Compte rendu du comédims 02 2015Compte rendu du comédims 02 2015
Compte rendu du comédims 02 2015
 
melin - The Truth
melin - The Truthmelin - The Truth
melin - The Truth
 
Declaracion publica
Declaracion publicaDeclaracion publica
Declaracion publica
 
La pregunta del día marzo
La pregunta del día marzoLa pregunta del día marzo
La pregunta del día marzo
 
Bit e byte
Bit e byteBit e byte
Bit e byte
 
Come partecipare a un concorso letterario
Come partecipare a un concorso letterarioCome partecipare a un concorso letterario
Come partecipare a un concorso letterario
 
Roadmap to mobile learning
Roadmap to mobile learningRoadmap to mobile learning
Roadmap to mobile learning
 
Sayed rasool zojaji nezhad
Sayed rasool zojaji nezhadSayed rasool zojaji nezhad
Sayed rasool zojaji nezhad
 
Mexico Wounding
Mexico WoundingMexico Wounding
Mexico Wounding
 
Planificación para o profesorado
Planificación para o profesoradoPlanificación para o profesorado
Planificación para o profesorado
 
Formato de autoevaluacion sesion 5
Formato de autoevaluacion sesion 5Formato de autoevaluacion sesion 5
Formato de autoevaluacion sesion 5
 
Arif new
Arif newArif new
Arif new
 
Inquerito resultados globais
Inquerito resultados globaisInquerito resultados globais
Inquerito resultados globais
 
倪安东 散场的拥抱
倪安东 散场的拥抱倪安东 散场的拥抱
倪安东 散场的拥抱
 

Similar to JLL Cleveland Office Insight - Q1 2015

Q1_NorthAmericanOfficeReport
Q1_NorthAmericanOfficeReportQ1_NorthAmericanOfficeReport
Q1_NorthAmericanOfficeReport
John Schenk
 
COLORADO SECRETARY OF STATE QUARTERLY BUSINESS & ECONOMIC INDICATORS First Qu...
COLORADO SECRETARY OF STATE QUARTERLY BUSINESS & ECONOMIC INDICATORS First Qu...COLORADO SECRETARY OF STATE QUARTERLY BUSINESS & ECONOMIC INDICATORS First Qu...
COLORADO SECRETARY OF STATE QUARTERLY BUSINESS & ECONOMIC INDICATORS First Qu...
Keenan Brugh
 

Similar to JLL Cleveland Office Insight - Q1 2015 (20)

Cincinnati Office Insight - Q1 2015
Cincinnati Office Insight - Q1 2015Cincinnati Office Insight - Q1 2015
Cincinnati Office Insight - Q1 2015
 
St. Louis Office Insight Q1 2015
St. Louis Office Insight Q1 2015St. Louis Office Insight Q1 2015
St. Louis Office Insight Q1 2015
 
JLL Detroit Chart of the Week: April 14, 2015
JLL Detroit Chart of the Week: April 14, 2015JLL Detroit Chart of the Week: April 14, 2015
JLL Detroit Chart of the Week: April 14, 2015
 
JLL Detroit Chart of the Week
JLL Detroit Chart of the WeekJLL Detroit Chart of the Week
JLL Detroit Chart of the Week
 
JLL Detroit Chart of the Week: April 14, 2014
JLL Detroit Chart of the Week: April 14, 2014JLL Detroit Chart of the Week: April 14, 2014
JLL Detroit Chart of the Week: April 14, 2014
 
Detroit's Year in Charts: 2015
Detroit's Year in Charts: 2015Detroit's Year in Charts: 2015
Detroit's Year in Charts: 2015
 
JLL Cleveland Chart of the Week: October 26, 2015
JLL Cleveland Chart of the Week: October 26, 2015JLL Cleveland Chart of the Week: October 26, 2015
JLL Cleveland Chart of the Week: October 26, 2015
 
JLL Office Insight Q3 2015 - Indianapolis
JLL Office Insight Q3 2015 - IndianapolisJLL Office Insight Q3 2015 - Indianapolis
JLL Office Insight Q3 2015 - Indianapolis
 
Q1_NorthAmericanOfficeReport
Q1_NorthAmericanOfficeReportQ1_NorthAmericanOfficeReport
Q1_NorthAmericanOfficeReport
 
Q1 2015 North American Office Highlights
Q1 2015 North American Office HighlightsQ1 2015 North American Office Highlights
Q1 2015 North American Office Highlights
 
JLL Cleveland Office Insight - Q3 2015
JLL Cleveland Office Insight - Q3 2015JLL Cleveland Office Insight - Q3 2015
JLL Cleveland Office Insight - Q3 2015
 
JLL Cleveland Office Insight - Q2 2015
JLL Cleveland Office Insight - Q2 2015JLL Cleveland Office Insight - Q2 2015
JLL Cleveland Office Insight - Q2 2015
 
February 2016 U.S. employment update and outlook
February 2016 U.S. employment update and outlook February 2016 U.S. employment update and outlook
February 2016 U.S. employment update and outlook
 
St. Louis Office Insight
St. Louis Office InsightSt. Louis Office Insight
St. Louis Office Insight
 
Colorado Secretary of State Q3 2015 Indicators Report
Colorado Secretary of State Q3 2015 Indicators ReportColorado Secretary of State Q3 2015 Indicators Report
Colorado Secretary of State Q3 2015 Indicators Report
 
Office Insight Q1 2016 Downtown Calgary
Office Insight Q1 2016 Downtown CalgaryOffice Insight Q1 2016 Downtown Calgary
Office Insight Q1 2016 Downtown Calgary
 
North American Commercial Real Estate Report
North American Commercial Real Estate ReportNorth American Commercial Real Estate Report
North American Commercial Real Estate Report
 
2015 2Q North American Office Market Report
2015 2Q North American Office Market Report2015 2Q North American Office Market Report
2015 2Q North American Office Market Report
 
Minneapolis-St. Paul Chart of the Week | May 23, 2016
Minneapolis-St. Paul Chart of the Week | May 23, 2016Minneapolis-St. Paul Chart of the Week | May 23, 2016
Minneapolis-St. Paul Chart of the Week | May 23, 2016
 
COLORADO SECRETARY OF STATE QUARTERLY BUSINESS & ECONOMIC INDICATORS First Qu...
COLORADO SECRETARY OF STATE QUARTERLY BUSINESS & ECONOMIC INDICATORS First Qu...COLORADO SECRETARY OF STATE QUARTERLY BUSINESS & ECONOMIC INDICATORS First Qu...
COLORADO SECRETARY OF STATE QUARTERLY BUSINESS & ECONOMIC INDICATORS First Qu...
 

More from JLL_Midwest_Great_Lakes_Research

More from JLL_Midwest_Great_Lakes_Research (20)

JLL Indianapolis Chart of the Week
JLL Indianapolis Chart of the WeekJLL Indianapolis Chart of the Week
JLL Indianapolis Chart of the Week
 
Minneapolis–St. Paul Chart of the Week October 20, 2015
Minneapolis–St. Paul Chart of the Week October 20, 2015Minneapolis–St. Paul Chart of the Week October 20, 2015
Minneapolis–St. Paul Chart of the Week October 20, 2015
 
JLL Detroit Chart of the Week: October 19, 2015
JLL Detroit Chart of the Week: October 19, 2015JLL Detroit Chart of the Week: October 19, 2015
JLL Detroit Chart of the Week: October 19, 2015
 
Office Insight Q3 2015-Grand Rapids
Office Insight Q3 2015-Grand RapidsOffice Insight Q3 2015-Grand Rapids
Office Insight Q3 2015-Grand Rapids
 
Office Insight Q3 2015 | Minneapolis-St. Paul
Office Insight Q3 2015 | Minneapolis-St. PaulOffice Insight Q3 2015 | Minneapolis-St. Paul
Office Insight Q3 2015 | Minneapolis-St. Paul
 
JLL Pittsburgh Office Insight - Q3 2015
JLL Pittsburgh Office Insight - Q3 2015JLL Pittsburgh Office Insight - Q3 2015
JLL Pittsburgh Office Insight - Q3 2015
 
Office Insight Q3 2015-Chicago CBD
Office Insight Q3 2015-Chicago CBDOffice Insight Q3 2015-Chicago CBD
Office Insight Q3 2015-Chicago CBD
 
Indianapolis JLL Employment Update - October 2015
Indianapolis JLL Employment Update - October 2015Indianapolis JLL Employment Update - October 2015
Indianapolis JLL Employment Update - October 2015
 
Leasing Activity Sheet Q3 2015-Detroit
Leasing Activity Sheet Q3 2015-DetroitLeasing Activity Sheet Q3 2015-Detroit
Leasing Activity Sheet Q3 2015-Detroit
 
Office Insight Q3 2015-Detroit
Office Insight Q3 2015-DetroitOffice Insight Q3 2015-Detroit
Office Insight Q3 2015-Detroit
 
Minneapolis St. Paul - Employment Update October 2015
Minneapolis St. Paul - Employment Update October 2015Minneapolis St. Paul - Employment Update October 2015
Minneapolis St. Paul - Employment Update October 2015
 
Chicago JLL employment update - October 2015
Chicago JLL employment update - October 2015Chicago JLL employment update - October 2015
Chicago JLL employment update - October 2015
 
Jll Detroit Employment Update October 2015
Jll Detroit Employment Update October 2015Jll Detroit Employment Update October 2015
Jll Detroit Employment Update October 2015
 
JLL Chart of the Week - Indianapolis
JLL Chart of the Week - IndianapolisJLL Chart of the Week - Indianapolis
JLL Chart of the Week - Indianapolis
 
JLL Minneapolis-St. Paul Chart of the Week: September 28, 2015
JLL Minneapolis-St. Paul Chart of the Week: September 28, 2015JLL Minneapolis-St. Paul Chart of the Week: September 28, 2015
JLL Minneapolis-St. Paul Chart of the Week: September 28, 2015
 
Chart of the Week - Indianapolis
Chart of the Week - IndianapolisChart of the Week - Indianapolis
Chart of the Week - Indianapolis
 
JLL Detroit Chart of the Week: September 14, 2015
JLL Detroit Chart of the Week: September 14, 2015JLL Detroit Chart of the Week: September 14, 2015
JLL Detroit Chart of the Week: September 14, 2015
 
JLL Chicago Chart of the Week - September 14, 2015
JLL Chicago Chart of the Week - September 14, 2015JLL Chicago Chart of the Week - September 14, 2015
JLL Chicago Chart of the Week - September 14, 2015
 
Indianapolis JLL Employment Update September 2015
Indianapolis JLL Employment Update September 2015Indianapolis JLL Employment Update September 2015
Indianapolis JLL Employment Update September 2015
 
JLL Cleveland Chart of the Week: September 7, 2015
JLL Cleveland Chart of the Week: September 7, 2015JLL Cleveland Chart of the Week: September 7, 2015
JLL Cleveland Chart of the Week: September 7, 2015
 

Recently uploaded

UK Residential Property Sales Forms Guide
UK Residential Property Sales Forms GuideUK Residential Property Sales Forms Guide
UK Residential Property Sales Forms Guide
AskXX.com
 
Property Rental Cumbria North West Guide
Property Rental Cumbria North West GuideProperty Rental Cumbria North West Guide
Property Rental Cumbria North West Guide
AskXX.com
 
Killer Referans Bahcesehir Catalog Listing Turkey
Killer Referans Bahcesehir Catalog Listing TurkeyKiller Referans Bahcesehir Catalog Listing Turkey
Killer Referans Bahcesehir Catalog Listing Turkey
Listing Turkey
 
Property Forms PDF Guide for UK Residential Property
Property Forms PDF Guide for UK Residential PropertyProperty Forms PDF Guide for UK Residential Property
Property Forms PDF Guide for UK Residential Property
AskXX.com
 
Listing Turkey - Sinpaş Queen Bomonti Katalog
Listing Turkey - Sinpaş Queen Bomonti KatalogListing Turkey - Sinpaş Queen Bomonti Katalog
Listing Turkey - Sinpaş Queen Bomonti Katalog
Listing Turkey
 
Property Rental Cumbria Location and Price Guide
Property Rental Cumbria Location and Price GuideProperty Rental Cumbria Location and Price Guide
Property Rental Cumbria Location and Price Guide
AskXX.com
 

Recently uploaded (20)

UK Residential Property Sales Forms Guide
UK Residential Property Sales Forms GuideUK Residential Property Sales Forms Guide
UK Residential Property Sales Forms Guide
 
Kohinoor Dhanori Apartments Pune Brochure
Kohinoor Dhanori Apartments Pune BrochureKohinoor Dhanori Apartments Pune Brochure
Kohinoor Dhanori Apartments Pune Brochure
 
Shapoorji Pallonji Plots Jadhavgadh Fort Pune.pdf
Shapoorji Pallonji Plots Jadhavgadh Fort Pune.pdfShapoorji Pallonji Plots Jadhavgadh Fort Pune.pdf
Shapoorji Pallonji Plots Jadhavgadh Fort Pune.pdf
 
Bozeman Real Estate Market Reports April/May 2024
Bozeman Real Estate Market Reports April/May 2024Bozeman Real Estate Market Reports April/May 2024
Bozeman Real Estate Market Reports April/May 2024
 
Property Rental Cumbria North West Guide
Property Rental Cumbria North West GuideProperty Rental Cumbria North West Guide
Property Rental Cumbria North West Guide
 
Oeiras Tech City, Developed by RE Capital and REIG, Will Become Lisbon's Futu...
Oeiras Tech City, Developed by RE Capital and REIG, Will Become Lisbon's Futu...Oeiras Tech City, Developed by RE Capital and REIG, Will Become Lisbon's Futu...
Oeiras Tech City, Developed by RE Capital and REIG, Will Become Lisbon's Futu...
 
2BHK-3BHK NEW FLAT FOR SALE IN TUPUDANA,RANCHI.
2BHK-3BHK NEW FLAT FOR SALE IN TUPUDANA,RANCHI.2BHK-3BHK NEW FLAT FOR SALE IN TUPUDANA,RANCHI.
2BHK-3BHK NEW FLAT FOR SALE IN TUPUDANA,RANCHI.
 
Killer Referans Bahcesehir Catalog Listing Turkey
Killer Referans Bahcesehir Catalog Listing TurkeyKiller Referans Bahcesehir Catalog Listing Turkey
Killer Referans Bahcesehir Catalog Listing Turkey
 
Top 10 International Schools in Bangalore
Top 10 International Schools in BangaloreTop 10 International Schools in Bangalore
Top 10 International Schools in Bangalore
 
Transforming Your Home Expert Guide to Renovations and Extensions in Upwey
Transforming Your Home Expert Guide to Renovations and Extensions in UpweyTransforming Your Home Expert Guide to Renovations and Extensions in Upwey
Transforming Your Home Expert Guide to Renovations and Extensions in Upwey
 
Property Forms PDF Guide for UK Residential Property
Property Forms PDF Guide for UK Residential PropertyProperty Forms PDF Guide for UK Residential Property
Property Forms PDF Guide for UK Residential Property
 
Sefakoy Sinpas Boulevard Istanbul - Presentation
Sefakoy Sinpas Boulevard Istanbul - PresentationSefakoy Sinpas Boulevard Istanbul - Presentation
Sefakoy Sinpas Boulevard Istanbul - Presentation
 
Redevelopment in Pune Challenges & Solutions (PPT).pdf
Redevelopment in Pune Challenges & Solutions (PPT).pdfRedevelopment in Pune Challenges & Solutions (PPT).pdf
Redevelopment in Pune Challenges & Solutions (PPT).pdf
 
Salarpuria Sattva Lakeridge Neopolis Hyderabad.pdf.pdf
Salarpuria Sattva Lakeridge Neopolis Hyderabad.pdf.pdfSalarpuria Sattva Lakeridge Neopolis Hyderabad.pdf.pdf
Salarpuria Sattva Lakeridge Neopolis Hyderabad.pdf.pdf
 
How to Scan Tenants in NYC - You Should Know!
How to Scan Tenants in NYC - You Should Know!How to Scan Tenants in NYC - You Should Know!
How to Scan Tenants in NYC - You Should Know!
 
Listing Turkey - Sinpaş Queen Bomonti Katalog
Listing Turkey - Sinpaş Queen Bomonti KatalogListing Turkey - Sinpaş Queen Bomonti Katalog
Listing Turkey - Sinpaş Queen Bomonti Katalog
 
Urbanrise Paradise on Earth - Unveiling Unprecedented Luxury in Exquisite Vil...
Urbanrise Paradise on Earth - Unveiling Unprecedented Luxury in Exquisite Vil...Urbanrise Paradise on Earth - Unveiling Unprecedented Luxury in Exquisite Vil...
Urbanrise Paradise on Earth - Unveiling Unprecedented Luxury in Exquisite Vil...
 
Avrupa Konutlari Yenimahalle - Listing Turkey
Avrupa Konutlari Yenimahalle - Listing TurkeyAvrupa Konutlari Yenimahalle - Listing Turkey
Avrupa Konutlari Yenimahalle - Listing Turkey
 
MC Heights-Best Construction Company in jhang
MC Heights-Best Construction Company in jhangMC Heights-Best Construction Company in jhang
MC Heights-Best Construction Company in jhang
 
Property Rental Cumbria Location and Price Guide
Property Rental Cumbria Location and Price GuideProperty Rental Cumbria Location and Price Guide
Property Rental Cumbria Location and Price Guide
 

JLL Cleveland Office Insight - Q1 2015

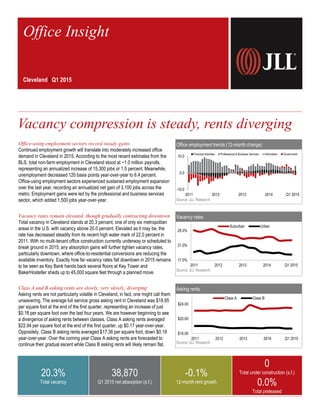
  • 1. Office-using employment sectors record steady gains Continued employment growth will translate into moderately increased office demand in Cleveland in 2015. According to the most recent estimates from the BLS, total non-farm employment in Cleveland stood at ~1.0 million payrolls, representing an annualized increase of 15,300 jobs or 1.5 percent. Meanwhile, unemployment decreased 120 basis points year-over-year to 6.4 percent. Office-using employment sectors experienced sustained employment expansion over the last year, recording an annualized net gain of 3,100 jobs across the metro. Employment gains were led by the professional and business services sector, which added 1,500 jobs year-over-year. Office employment trends (12-month change) Source: JLL Research Vacancy rates remain elevated, though gradually contracting downtown Total vacancy in Cleveland stands at 20.3 percent, one of only six metropolitan areas in the U.S. with vacancy above 20.0 percent. Elevated as it may be, the rate has decreased steadily from its recent high water mark of 22.0 percent in 2011. With no multi-tenant office construction currently underway or scheduled to break ground in 2015, any absorption gains will further tighten vacancy rates, particularly downtown, where office-to-residential conversions are reducing the available inventory. Exactly how far vacancy rates fall downtown in 2015 remains to be seen as Key Bank hands back several floors at Key Tower and BakerHostetler sheds up to 45,000 square feet through a planned move. Vacancy rates Source: JLL Research Class A and B asking rents are slowly, very slowly, diverging Asking rents are not particularly volatile in Cleveland, in fact, one might call them unwavering. The average full service gross asking rent in Cleveland was $18.95 per square foot at the end of the first quarter, representing an increase of just $0.18 per square foot over the last four years. We are however beginning to see a divergence of asking rents between classes. Class A asking rents averaged $22.94 per square foot at the end of the first quarter, up $0.17 year-over-year. Oppositely, Class B asking rents averaged $17.36 per square foot, down $0.19 year-over-year. Over the coming year Class A asking rents are forecasted to continue their gradual ascent while Class B asking rents will likely remain flat. Asking rents Source: JLL Research 20.3% Total vacancy 38,870 Q1 2015 net absorption (s.f.) -0.1% 12-month rent growth 0 Total under construction (s.f.) 0.0% Total preleased Office Insight Cleveland | Q1 2015 Vacancy compression is steady, rents diverging -10.0 0.0 10.0 2011 2012 2013 2014 Q1 2015 Financial Activities Professional & Business Services Information Government 17.0% 21.0% 25.0% 2011 2012 2013 2014 Q1 2015 Suburban Urban $16.00 $20.00 $24.00 2011 2012 2013 2014 Q1 2015 Class A Class B
  • 2. Current conditions – market and submarket Historical leasing activity Source: JLL Research Source: JLL Research Total net absorption (s.f.) Source: JLL Research Total vacancy rate Source: JLL Research Direct average asking rent ($ p.s.f.) Source: JLL Research Cleveland 658,219 342,565 316,789 -207,867 -304,696 87,184 -165,658 675,495 267,469 38,870 -500,000 -100,000 300,000 700,000 2006 2007 2008 2009 2010 2011 2012 2013 2014 Q1 2015 $19.77 $19.94 $19.45 $19.74 $19.46 $19.13 $19.05 $18.93 $18.98 $18.95 $18.50 $19.00 $19.50 $20.00 2006 2007 2008 2009 2010 2011 2012 2013 2014 Q1 2015 16.4% 18.3% 16.9% 19.6% 21.6% 22.0% 21.4% 20.9% 20.4% 20.3% 14.0% 17.0% 20.0% 23.0% 2006 2007 2008 2009 2010 2011 2012 2013 2014 Q1 2015 Suburbs Landlordleverage Tenantleverage Peaking market Falling market Bottoming market Rising market CBD 1,500,000 1,700,000 2,000,000 1,500,000 300,000 0 750,000 1,500,000 2,250,000 2011 2012 2013 2014 Q1 2015 ©2015 Jones Lang LaSalle IP, Inc. All rights reserved.For more information, contact: Andrew Batson | +1 216 937 4374 | Andrew.Batson@am.jll.com Robert Kramp | +1 312 228 2470| Robert.Kramp@am.jll.com