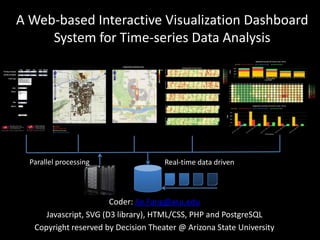
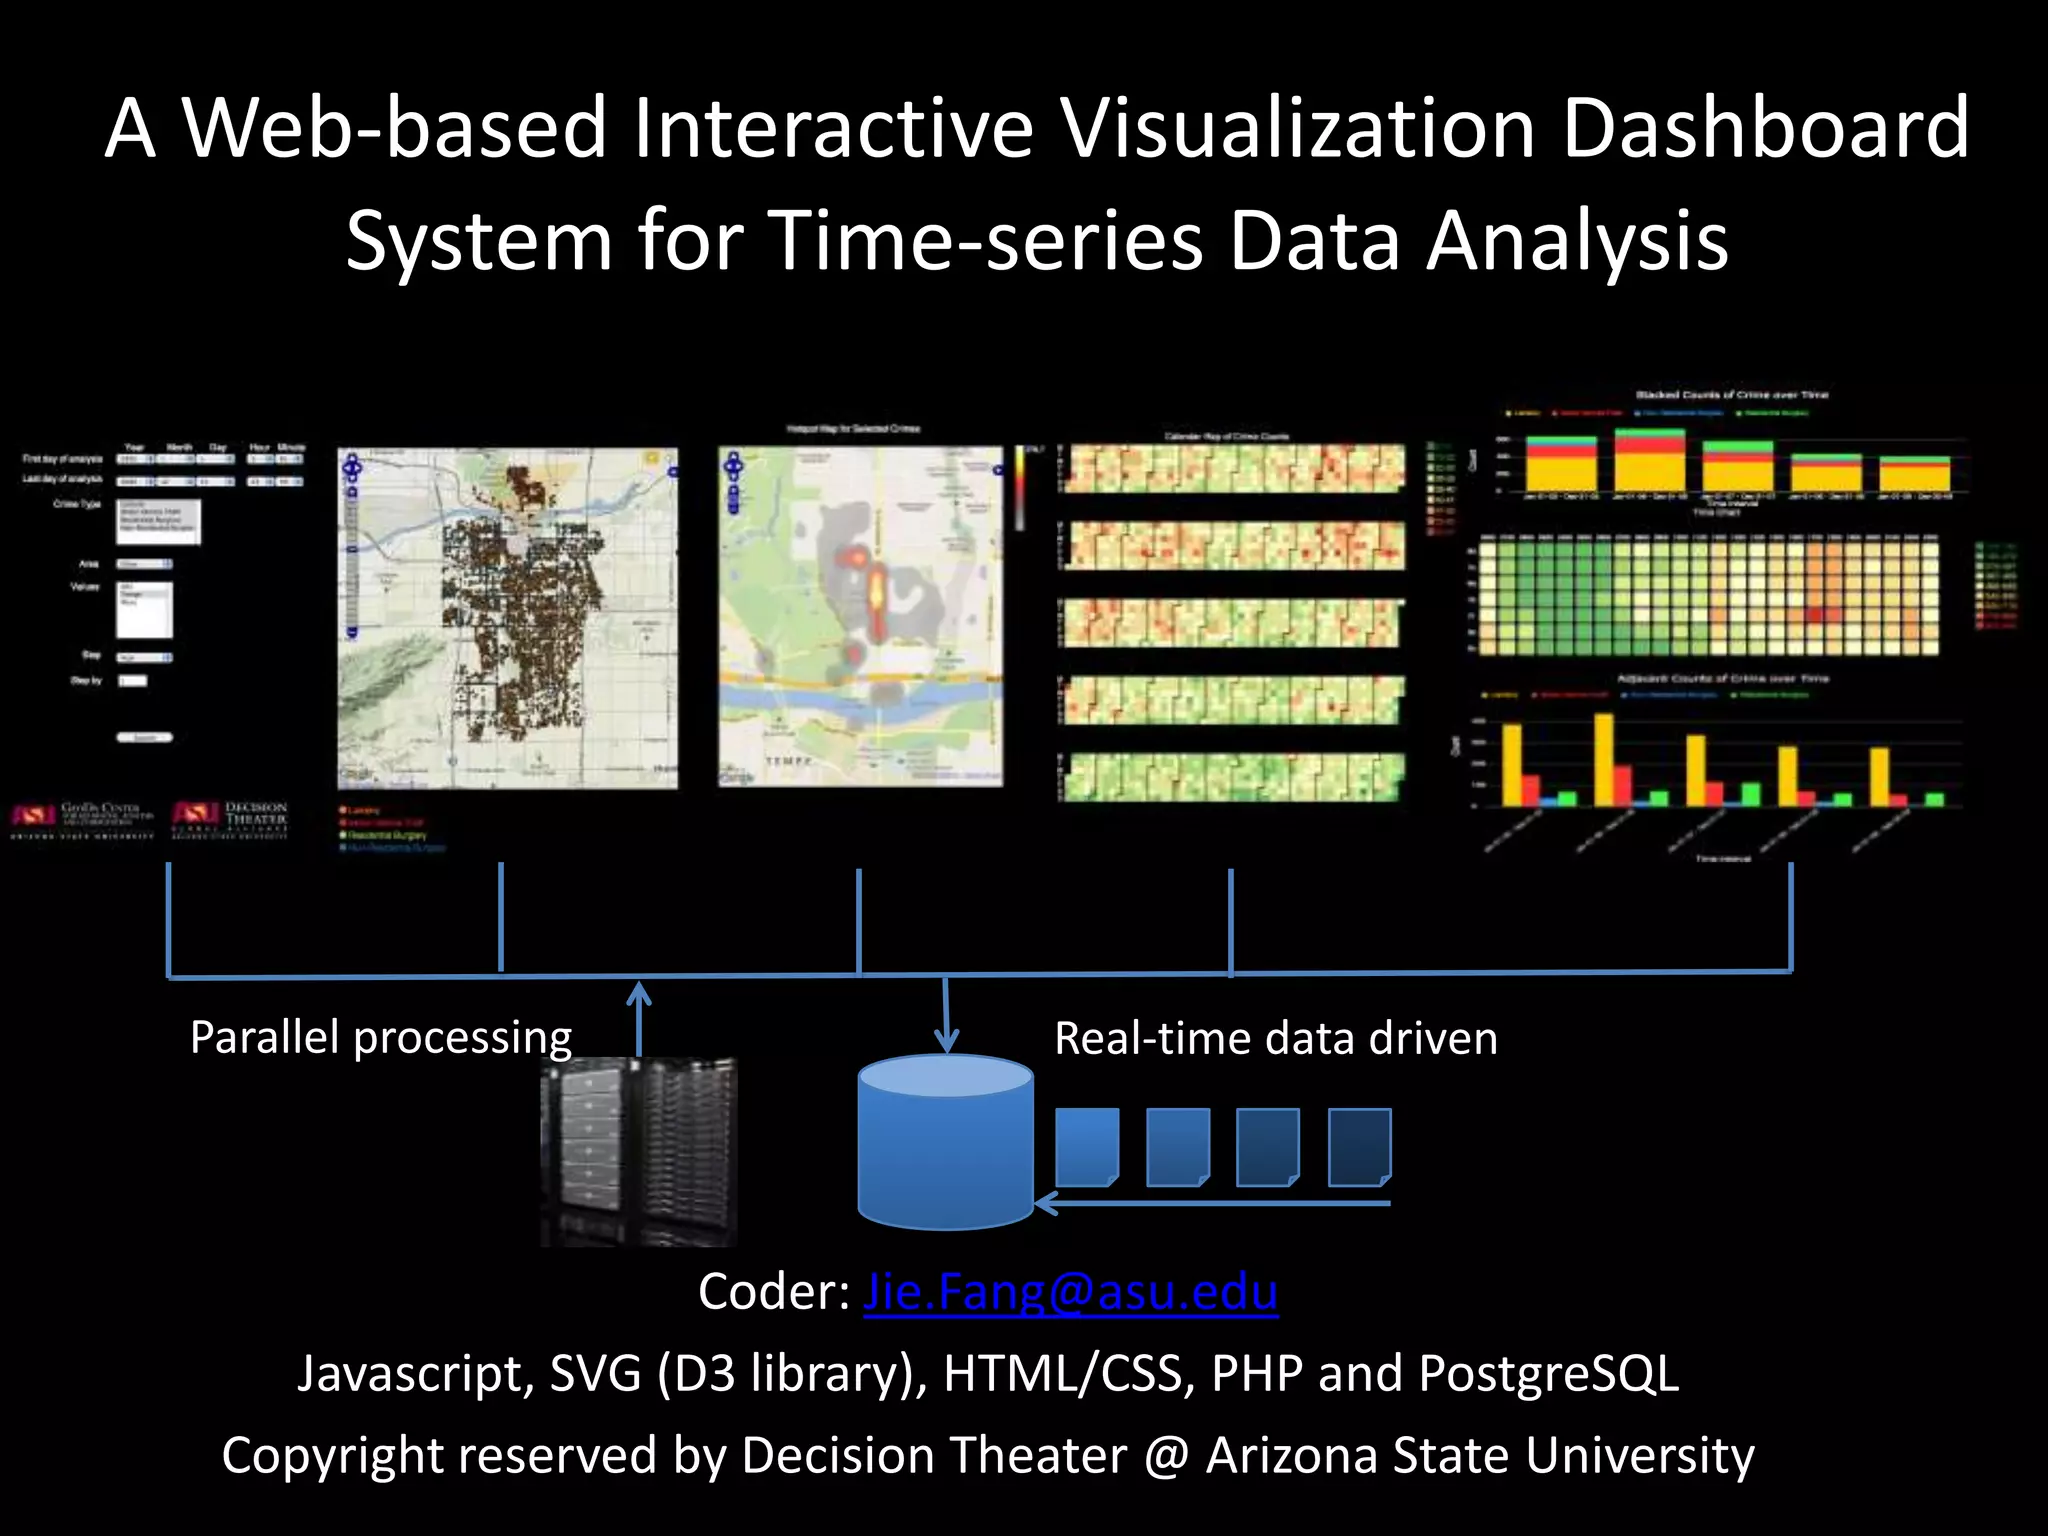
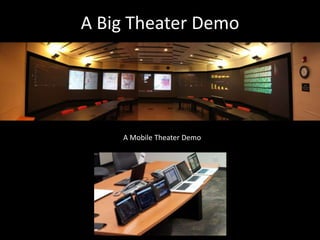
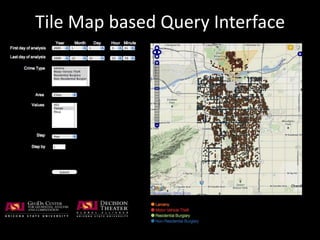
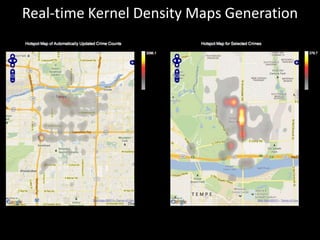
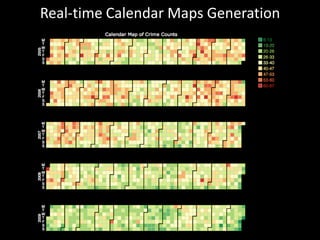
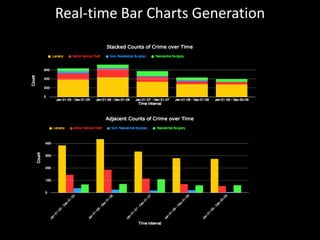
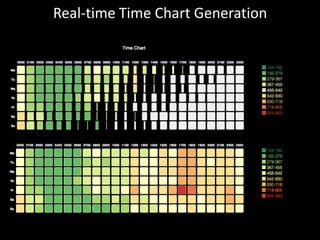
This document describes a web-based interactive visualization dashboard system for time-series data analysis. It uses technologies like JavaScript, SVG, D3 library, HTML/CSS, PHP and PostgreSQL to provide real-time data driven parallel processing and generate visualizations like kernel density maps, calendar maps, bar charts and time charts from query interfaces. The system also includes demos for big theater and mobile theater use cases.


