Gravimetri Dersi için aşağıda ki videoları izleyebilirsiniz.
Link 01: https://www.youtube.com/watch?v=HTyjVaVGx0k
Link 02: https://www.youtube.com/watch?v=fUkfgI8XaOE
Gravimetri Dersi için aşağıda ki videoları izleyebilirsiniz.
Link 01: https://www.youtube.com/watch?v=HTyjVaVGx0k
Link 02: https://www.youtube.com/watch?v=fUkfgI8XaOE
The document discusses gravity anomalies and density variations in different regions based on gravity data. It shows how gravity maps reveal details about crustal thickness, tectonic features like faults and volcanic zones, and plate boundaries. Specific examples discussed include the Tibetan Plateau, Central America subduction zone, an area in Chugoku, Japan, and the state of Florida in the US. Regional gravity data can be used to model density changes associated with plate tectonics, crustal evolution, and volcanic and tectonic activity.
The USF team reviewed a geophysical investigation of the Kar Kar region conducted by WesternGeco in 2011. They found that WesternGeco's magnetotelluric (MT) data and models were of high quality. Both the WesternGeco and USF MT models identified a low resistivity zone at 300m depth that correlates with a water-bearing zone found in Borehole 4. USF performed gravity modeling which identified a north-south trending basin reaching 1500m depth, consistent with mapped faults. A preliminary hydrothermal model suggested observed temperatures could result from deep circulation of meteoric waters in the basin without needing a localized heat source. Additional geophysical data is recommended around the Jermaghbyur hot springs to
This document summarizes a study that used gravity data to delineate underground structure in the Beppu geothermal field in Japan. Analysis of Bouguer anomaly maps revealed high anomalies in the southern and northern parts of the study area that correspond to known geological formations. Edge detection filtering of the gravity data helped identify subsurface faults, including the northern edge of the high southern anomaly corresponding to the Asamigawa Fault. Depth modeling of the gravity basement showed differences between the southern and northern hot spring areas, with steep basement slopes along faults in the south and uplifted basement in the north.
This document summarizes the development of a new ultra-high resolution model of Earth's gravity field called GGMplus. Key points:
- GGMplus combines satellite gravity data from GOCE and GRACE with terrestrial gravity data and topography to achieve unprecedented 200m spatial resolution globally.
- It provides gridded estimates of gravity, horizontal and radial field components, and quasi-geoid heights at over 3 billion points covering 80% of the Earth's land.
- GGMplus reveals new details of small-scale gravity variations and identifies locations of minimum and maximum gravity, suggesting peak-to-peak variations are 40% larger than previous estimates. The model will benefit scientific and engineering applications.
Gravity measurements were taken in a region of China covering the south-north earthquake belt in 1998, 2000, 2002, and 2005. Researchers noticed significant gravity changes in the region surrounding Wenchuan and suggested in 2006 that a major earthquake could occur there in 2007 or 2008. While gravity changes were significant at some locations, more research is needed to determine if they could be considered a precursor. Uncertainties exist from measurement errors, hydrologic effects, and crustal movements. Improved data collection and analysis could enhance using gravity monitoring for earthquake research.
The document provides guidelines for implementing the H/V spectral ratio technique using ambient vibration measurements to evaluate site effects. It recommends procedures for experimental design, data processing, and interpretation. The key recommendations include measuring for sufficient duration depending on expected frequency, using multiple measurement points, avoiding disturbances, and interpreting H/V peaks in context with geological and geophysical data. Reliable H/V peaks are defined as having a clear maximum within expected frequency ranges and uncertainties. The guidelines aim to help apply the technique while accounting for its limitations.
Geopsy yaygın olarak kullanılan profesyonel bir program. Özellikle, profesyonel program deneyimi yeni mezunlarda çok aranan bir özellik. Bir öğrencim çalışmasında kullanmayı planlıyor.
M6.0 2004 Parkfield Earthquake : Seismic AttenuationAli Osman Öncel
HRSN isimli kuyu içi sismik istasyonlar kullanılarak, San Andreas fayı boyunca meydana gelen büyük depremler öncesi sismik azalımın varlığının olup olmadığı araştırılıyor.
Deprem Verilerinin H/V Oranının Mevsimsel Değişimi Ali Osman Öncel
H/V oranının zaman içinde değişimi konusu bana oldukça ilginç gelmişti ve bu tür bir çalışma yapıldı mı sorusunu netleştirmek için araştırma yaptım ve 2021 yılında bu konuda GJI gibi bir dergide yayınlanmış bir çalışma buldum. Bu çalışma oldukça iyi bir referans H/V çalışmaları için. Önemli referans düşünceler şöyle; 1) Mevsimsel olarak yağışa bağlı olarak yeraltı kaynaklarında ki azalma ve yükselmeye bağlı olarak H/V yükseliyor, 2) H/V pik değerleri kaya zemin üzerinde yaklaşık BİR (1) oranında seyreder ve PİK vermezken, kaya zeminden uzaklaşıldıkça zemin etkisi ile PİK değerleri değişir, 3) Deprem ve Gürültü sinyallerinden hesap edilen F(PİK) nerede ise sabitken, H/V oranları %10 değişir, 4) M6.8 büyüklüğünde meydana gelen bir deprem H/V değişimlerini etkiler.
Yapılan çalışmada kullanılan yaklaşım SESAME (2004) kriterlerine uygun olarak 1) 60 dakikalık veriler analizi, 2) 1000 günden fazla gözlem süresi 3) 10'dan fazla farklı zeminlerde istasyon 4) 60 dakikalık birbirinden ayrı verilerin analiz edilmesi. Oldukça emek yoğun bir çalışma
The first earthquake site assessments in alberta canadaAli Osman Öncel
This document is a thesis that investigates site characterization and earthquake site amplification in Alberta, Canada. It includes two studies as chapters: 1) A study using non-invasive techniques like microtremor surveys to characterize seismic stations in Alberta based on shear-wave velocity profiles. Shear-wave velocity was found to be generally low, limiting sites to National Building Code classes C and D. 2) A study characterizing earthquake site amplification in Alberta by analyzing horizontal-to-vertical spectral ratios from earthquakes and microtremors. Softer surficial geology was found to correlate with larger amplification. Empirical amplification functions were derived that can be correlated to surficial geology. Peak frequencies were generally low (<10 Hz) indicating deep
1) Long-term ocean bottom seismograph observations in the Marmara Sea identified changes in seismic activity and fault geometry along the Main Marmara Fault.
2) The maximum focal depth was 26 km beneath the Western High, but events were confined to the upper crust further east.
3) An abrupt change in fault dip and the depth of the seismogenic zone indicates a segment boundary beneath the Central Basin.
4) Seismicity locates beneath the sedimentary basement. Inactive zones within the upper crust may indicate locked sections accumulating stress.
Marmara ve İstanbul için ayrı ayrı 2 senaryo yapılmış. Coulomb Stress etkisi önemli ölçüde deprem olasılığını yükseltiyor. Özellikle, KAFZ boyunca meydana gelen depremlerin yüzey kırıklarının Dünya'da ki benzer büyük depremlerin yüzey kırıklarından oldukça farklı ve büyük.
Gaz ve Deprem İlişkisi: İstanbul Deprem BoşluğuAli Osman Öncel
This document summarizes research showing that many aftershocks from a 2011 M5.1 earthquake in the Sea of Marmara occurred within a zone of gas overpressuring between 1.5-5 km depth, where pressurized gas is expected to migrate along the Main Marmara Fault and up to seafloor sediments. This suggests gas-related processes should be considered when interpreting micro-seismicity (M<3) in the Istanbul offshore domain, not just tectonic processes. Improved earthquake locations found many aftershocks occurred at shallow depths within areas of known gas seeps, challenging the view that seismicity is solely tectonically driven in this region.
Jeotermal Depremler ve Sismik Hız Değişimleri Nasıl İlişkili?
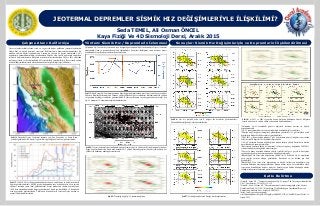
1. Sonuçlar: Sismik Hız Değişimleriyle ve Depremlerin İlişkilendirilmesiSonuçlar: Sismik Hız Değişimleriyle ve Depremlerin İlişkilendirilmesiSonuçlar: Sismik Hız Değişimleriyle ve Depremlerin İlişkilendirilmesiSonuçlar: Sismik Hız Değişimleriyle ve Depremlerin İlişkilendirilmesiYöntem: Sismik Hız /Depremlerin İzlenmesiYöntem: Sismik Hız /Depremlerin İzlenmesiYöntem: Sismik Hız /Depremlerin İzlenmesiYöntem: Sismik Hız /Depremlerin İzlenmesi
JEOTERMAL DEPREMLER SİSMİK HIZ DEĞİŞİMLERİYLE İLİŞKİLİMİ?JEOTERMAL DEPREMLER SİSMİK HIZ DEĞİŞİMLERİYLE İLİŞKİLİMİ?JEOTERMAL DEPREMLER SİSMİK HIZ DEĞİŞİMLERİYLE İLİŞKİLİMİ?JEOTERMAL DEPREMLER SİSMİK HIZ DEĞİŞİMLERİYLE İLİŞKİLİMİ?
Seda TEMEL, Ali Osman ÖNCEL
Kaya Fiziği Ve 4D Sismoloji Dersi, Aralık 2015
Katkı BelirtmeKatkı BelirtmeKatkı BelirtmeKatkı Belirtme
Çalışma Alanı: KaliforniyaÇalışma Alanı: KaliforniyaÇalışma Alanı: KaliforniyaÇalışma Alanı: Kaliforniya
Şekil 2: 1960 ile 2011 yılları arasında buhar üretimi su enjeksiyonu ve tetiklenen sismik
aktivite görülmektektedir. SEGEP projesi başlamadan önce sismik aktivite ile su enjekte
edilmesi arasında yakın ilişki görülmektedir. Steam production (buhar üretimi oranı)
1980’lerin ortasından itibaren düşmeye başlamıştır. Siyah eğri büyüklüğü 1.5’dan küçük
olan depremleri göstermektedir. Tetiklenen sismik aktivite rezervuar içine basılan su
oranı ile ilişkilendirilmektedir.
Gayzer alanları aralıklı olarak sıcak su veya sıcak buhar püskürten jeotermal sahalardır.
Dünya’daki en büyük jeotermal rezervuarı Kaliforniya’nın kuzeyinde bulunmaktadır. Bu
alandan elektrik üretimi yapılmaktadır. Yapılan bu çalışma da gayzer alanlarında Vp/Vs
değişiminin görüntülenmesinden yararlanılarak bölgede olan sismik aktivitenin enjeksiyon
işlemi ile ilgisi anlatılacaktır. Bölgenin sismik aktivitesi incelenirken 2005 ve 2011 yıllarında
toplanmış sismik veriler kullanılarak 4D sismolojiden yararlanılmıştır. Rezervuarın zaman
içindeki değişiminden sismik aktivitelerin neden artış gösterdiği tespit edilmiştir.
Şekil 1:Haritada Geyser Jeotermal alanının yeri, San Francisko ve Santa Rosa
şehirleri görülmektedir. Siyah ile gösterilen çizgi bölgedeki ana fayı göstermektedir.
Çalışmada Vp/Vs oranı ile rezervuarın suya doygunluğu arasındaki ilişki incelenmiştir. Geyser jeotermal
alanlarından çıkan su rezervuarlara enjekte edilmektedir. Su enjekte edildiğinde sıcak rezervuar kayası
kırıklanmakta ve mikro depremlere neden olmaktadır.
Şekil 6: Her bir derinlik kesiti için P dalgası hız kesitlerini göstermektedir.
Çözünürlük derinliğe bağlı olarak azalmaktadır.
Şekil 7: Derinliğe bağlı olarak S dalga hızı hesaplamaları.
Şekil 8: a) 2011 ve 2005’te yapılan sismik kesitlerin birbirinden farkı b) Bölgenin
sismik aktivitesi ile enjekte edilen su hacminin ilişkilendirilmesi
Şekil 3: Siyah çizgi Vp/Vs oranının zamana bağlı değişimini gösterirken mavi çizgi temel kayaya enjekte
edilen su hacmini göstermektedir. Turuncu çizgiler bölgedeki gayzer alanlarını canlandırmak için yapılan
iki projenin başlangıç tarihlerini göstermektedir. Rezervuar kayanın suya doygunluk oranı arttığı için
Vp/Vs oranının % 6 oranında arttığı düşünülmektedir.
Şekil 4: Gayzer jeotermal rezervuarlarının sınırları kırmızı çizgi ile çizilmiştir. Sismik istasyonlar kırmızı
üçgen ile gösterilmektedir. Siyah ufak noktalar 2011 yılında oluşan depremleri büyük siyah noktalar ters
çözüm için konulmuş nodları göstermektedir.
*Çalışmada Vp/Vs oranındaki göreceli değişimin rezervuar basıncı ile ilişkisi
araştırılmaktadır.
*Vp/Vs oranı görüntülemesi rezervuarın durumu hakkında bilgi vermektedir.
*Zamana bağlı değişim tomografik görüntüleme yöntemleri ile gösterilirken ortak
depremlerin dikkatli şekilde seçilmesi gerekmektedir.
*2005-2011 yılları arasında tahmini Vp/Vs değerlerinin göreceli dağılımı rezervuarda
ölçülen sıcaklık değerleri ile ilişkilendirilememiştir.
*+∆Vp/Vs oranının konuma bağlı değişimi tahmin edilmiş yüksek hacimde su basılan
kuyularda büyük uyum görülmüştür.
*Rezervuarın ortasının büyük bir kısmında ve Geyser’in güney doğusunda 2005-2011
yılları arasında suya doygunluk oranı artmıştır.
*Geyser’in kuzey batısında bulunan yüksek sıcaklıklı bölge ve geyser’in kuzeyinde
suyun buharlaştığı için su saturasyonunun düştüğü görülmüştür.
*Büyüklüğü 4’ten fazla olan depremlerin yüksek Vp/Vs ile düşük Vp/Vs oranlarının
geçiş yaptığı yerlerde olduğu görülmüştür. Buralarda su sıvı halden gaz hale
geçmektedir.
*Büyüklüğü 4’ten fazla olan depremlerin en büyük enjeksiyon derinliğinin orta
kesminin altlarında oluştuğu görülmüştür. Bunun nedeni suyun yer çekiminden ötürü
rezervuarın derinliklerine hareket etmesi ki buralar suyun buhara dönüştüğü alanlar
olduğu için deprem oluşturacak gerilme üretmektedirler.
*Gritto R. ,Jarpe S.P ,” Temporal variations of Vp/Vs-ratio at The Geysers geothermal field,
USA”, Geothermics ,52 (2014), 112–119
*Gritto R, Yoo S.H, Jarpe S.P, “Three-dimensional seismic tomography at the Geysers
Geothermal Field, CA, USA." Proceedings, 35th Workshop on Geothermal Reservoir
Engineering, Stanford Univ., Stanford, Calif. 2013.
*https://www.youtube.com/watch?
v=htIkIaa6mfg&list=PLrgWAYZHpg9Uye2hKuF0Y_GJZ_cU9nEBG Ziyaret Tarihi: 12
Aralık 2015
Şekil 5: Derinliğe bağlı Vp/Vs oranının değişimi