More Related Content

PPTX
chapter 1 powerpoint presentation for data and analytics 
PPT
final UNIT II-DESCRIPTIVE ANALYTICS.pptx 
PPTX
Statistical Learning - Introduction.pptx 
PPTX
Data Visualization in Finance _ Data Scources 
PPTX
introductory Statistics for Buuisness.pptx 
PPT

PPTX
Chapter 1.pptxxxxxxxxxxxxxxxxxxxxxxxxxxxxxx 
PPTX
Introduction to Stats, basic of statistics, z-score, (1).pptx Similar to Jaggia5e_Chap001_PPT_Accessible.pptx++++

PPTX
Lind_2024_Release_Chap001_PPT_Accessible.pptx 
PPTX
Introduction to Data (Data Analytics)... 
PPTX
Statistics for data science -introduction and data collection methods 
PPTX
Introduction to Business Analytics - Basics 
PPTX
Data Visualization (DV) Lecture 02 slide 
PPTX
BA4206 UNIT 1.pptx business analytics ppt 
PPTX
Bài giảng chương 1 môn Thống Kê Ứng Dụng 
PPTX
÷ Introductory Statistics for Buisness.pptx 
PDF

PPTX
Statisticsccdxghbbnhhbvvvvvvvvvv. Dxcvvvhhbdzvbsdvvbbvv ccc 
PPTX
BUSINESS STATISTICS AND PROBABILITY Chapter 1 By Arbaminich University 
PDF
Test Bank for Business Statistics: Communicating with Numbers 3rd Edition 
PPT
LEVEL OF MEASUREMENTS_2.ppt 
PPT
Statistics for business and economics Measurement scales.ppt 
PDF
Applied Statistics for E and B : Data and Statistics 
PDF
Test Bank for Business Statistics: Communicating with Numbers 3rd Edition 
PDF
Test Bank for Business Statistics: Communicating with Numbers 3rd Edition 
DOCX

PPT

PPT
Measurement scales on the assessment and intterpreatations of test scores in ... More from TommyLazaro

PPTX
Jaggia5e_Chap002_PPT_Accessible.pptx++++ 
PPTX
Jaggia5e_Chap007_PPT_Accessible.pptx++++ 
PPTX
Jaggia5e_Chap008_PPT_Accessible.pptx++++ 
PPTX
Jaggia5e_Chap004_PPT_Accessible.pptx++++ 
PPTX
Jaggia5e_Chap005_PPT_Accessible.pptx++++ 
PPTX
Jaggia5e_Chap006_PPT_Accessible.pptx++++ Recently uploaded

PDF
mythbusting-cdc-what-employers-need-to-know.pdf ![[DSC Europe 25] Gordana Milutinovic Dumbelovic - From Insight to Oversight: A...](https://cdn.slidesharecdn.com/ss_thumbnails/t7dkjsfxqwwzceropjv4-gordana-milutinovicdumbelovic-from-insight-to-oversight-ai-driven-power-bi-moni-260119121559-9e0bf11b-thumbnail.jpg?width=640&height=640&fit=bounds)
PDF
[DSC Europe 25] Gordana Milutinovic Dumbelovic - From Insight to Oversight: A... 
PDF
Security and confidentiality in big data.pdf ![[DSC Europe 25] Paula Garcia Esteban -Building the Future: The Role of Data S...](https://cdn.slidesharecdn.com/ss_thumbnails/9ld1r1bsqpwve8qfvphy-paula-garcia-esteban-building-the-future-260122103838-4171f5cb-thumbnail.jpg?width=640&height=640&fit=bounds)
PPTX
[DSC Europe 25] Paula Garcia Esteban -Building the Future: The Role of Data S... ![[DSC Europe 25] Dubravko Culibrk - Deep Learning for Mammography.pptx](https://cdn.slidesharecdn.com/ss_thumbnails/yiscimuktacgqoiu4dkp-deep-learning-for-mammography-260119121559-aad59182-thumbnail.jpg?width=640&height=640&fit=bounds)
PPTX
[DSC Europe 25] Dubravko Culibrk - Deep Learning for Mammography.pptx 
PPTX
normal labor normal labor normal labor normal labor normal labor normal labor... ![[DSC Europe 25] Milos Belcevic - Product Professional's Journey to Full-Stack...](https://cdn.slidesharecdn.com/ss_thumbnails/1zovd6fgsycdg4wvgvls-milos-belcevic-product-professionals-journey-to-full-stack-product-developer-260123083019-d993120d-thumbnail.jpg?width=640&height=640&fit=bounds)
PPTX
[DSC Europe 25] Milos Belcevic - Product Professional's Journey to Full-Stack... ![[DSC Europe 25] Andrzej Kowalczyk - AI - how to start small and grow in the f...](https://cdn.slidesharecdn.com/ss_thumbnails/oy1zmo94qv6vpcqjvno2-andrzej-kowalczyk-ai-how-to-start-small-and-grow-in-the-future-1-260119121559-cf093b23-thumbnail.jpg?width=640&height=640&fit=bounds)
PDF
[DSC Europe 25] Andrzej Kowalczyk - AI - how to start small and grow in the f... ![[DSC Europe 25] Marcos Heidemann - Beyond the Hype: Making AI Coding Assistan...](https://cdn.slidesharecdn.com/ss_thumbnails/eexkhvldrjsopspdjbur-marcos-heidemann-beyond-the-hype-getting-real-value-out-of-ai-assisted-coding-260121115910-7e9d41ec-thumbnail.jpg?width=640&height=640&fit=bounds)
PPTX
[DSC Europe 25] Marcos Heidemann - Beyond the Hype: Making AI Coding Assistan... 
PDF
Time Travel on ACID - A Gentle Introduction To Apache Iceberg 
PDF
The-Authoritarian-Gaze.pdfThe-Authoritarian-Gaze.pdf 
PPTX
Enhanced signature verification through the integration of divers' models, op... 
PDF
Data Infrastructure as Code - Building core data services in a small team 
PDF
Comprehensive Power BI Dashboard for Data-Driven Business Insights and Perfor... 
PPTX
Artificial neural network Available for instant download in exchange for a bi... 
PDF
Torre Avianca- Modernity, Identity, and Technology in Colombian Architecture.pdf 
PPTX
Full_Transformer_hjyhkkiProject_PPT.pptx 
PPTX
prevention for internet it is very important and good go check out ![[DSC Europe 25] Tamas Srancsik - How To Teach Your AI Football? An Argument f...](https://cdn.slidesharecdn.com/ss_thumbnails/bcjh1m9xtbosv20ucftb-tamas-srancsik-how-to-teach-your-ai-football-260121115910-08b53e9e-thumbnail.jpg?width=640&height=640&fit=bounds)
PDF
[DSC Europe 25] Tamas Srancsik - How To Teach Your AI Football? An Argument f... 
PPTX
IKS-Unit 2 Part-1(1).pptxnnnnnnnnnnnnnnn Jaggia5e_Chap001_PPT_Accessible.pptx++++
- 1.
Because learning changeseverything.®
Business Statistics: Communicating with
Numbers, 5e
1 Data and Data Preparation
By Sanjiv Jaggia and Alison Kelly
© McGraw Hill LLC. All rights reserved. No reproduction or distribution without the prior written consent of McGraw Hill LLC.
- 2.
© McGraw Hill2
Learning Objectives (LO’s)
LO 1.1: Describe statistics, data privacy, and data
ethics.
LO 1.2: Explain the various data types.
LO 1.3: Describe variables and types of
measurement scales.
LO 1.4: Inspect and explore data.
LO 1.5: Apply data subsetting.
- 3.
© McGraw Hill3
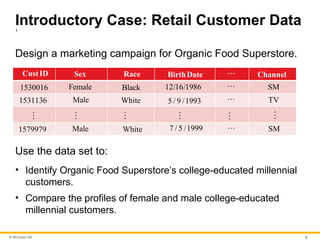
Introductory Case: Retail Customer Data
1
Design a marketing campaign for Organic Food Superstore.
CustID Sex Race BirthDate Channel
1530016 Female Black 12/16/1986 SM
1531136 Male White 5/ 9 /1993 TV
1579979 Male White 7 / 5 /1999 SM
Use the data set to:
• Identify Organic Food Superstore’s college-educated millennial
customers.
• Compare the profiles of female and male college-educated
millennial customers.
- 4.
© McGraw Hill4
1.1: Statistics, Data Privacy, and Data
Ethics 1
Data are compilations of facts, figures, or other contents, both
numerical and nonnumerical.
Statistics is the science that deals with the collection, preparation,
analysis, presentation, and interpretation of data.
Three steps are essential for performing a good statistical
analysis.
• First, find the right data, which are both complete and lacking any
misrepresentation, and prepare them for the analysis.
• Second, choose appropriate techniques for analyzing data.
• Third, an important ingredient of a well-executed statistical analysis is
to clearly communicate information into verbal and written language.
Numerical results are not very useful unless accompanied with clearly
stated actionable business insights.
- 5.
© McGraw Hill5
1.1: Statistics, Data Privacy, and Data
Ethics 2
Data analysis allows companies to effectively target and understand their
customers, it also carries greater responsibility for understanding data privacy and
ethics.
Data Privacy is a branch of data security related to the proper collection, usage,
and transmission of data, focusing on.
• How data are legally collected and stored.
• If and how data are shared with third parties.
• How data collection, usage, and transmission meet all regulatory obligations.
Key principles of data privacy include.
• Confidentiality. Customer data and identity must remain private. Should sensitive
information be shared it must be done with utmost confidentiality.
• Transparency. Data-processing activities and automated decisions must be transparent.
Risks, as well as social, ethical, and societal consequences, must be clearly understood
by customers.
• Accountability. The data collection company must establish a reflective, reasonable, and
systematic use and protection of customer data.
- 6.
© McGraw Hill6
1.1: Statistics, Data Privacy, and Data
Ethics 3
Data ethics is a branch of ethics that studies and
evaluates moral problems related to data.
Its concerns revolve around evaluating whether data are
being used for doing the right thing for people and
society.
Key principles of data ethics include.
• Human first. It is important that the human being stays at
the center and human interests always outweigh
institutional and commercial interests.
• No biases. It is important that the algorithms employed do
not absorb unconscious biases in a population and amplify
them in the analysis.
- 7.
© McGraw Hill7
1.2: Types of Data 1
There are two branches of statistics: descriptive and inferential statistics.
Descriptive statistics refers to the summary of important aspects of a
data set.
• Includes collecting, organizing, and presenting the data in the form of charts
and tables.
• Often calculate numerical measures (typical value, variability).
Inferential statistics refers to drawing conclusions about a larger set of
data (population) based on a smaller set of data (sample).
• A population consists of all items/members of interest.
• A sample is a subset of the population.
We rely on sample data to make inferences about various characteristics
of the population.
- 8.
© McGraw Hill8
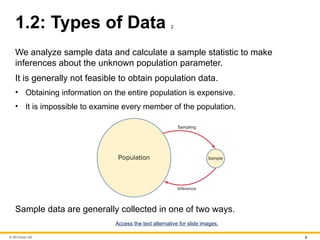
1.2: Types of Data 2
We analyze sample data and calculate a sample statistic to make
inferences about the unknown population parameter.
It is generally not feasible to obtain population data.
• Obtaining information on the entire population is expensive.
• It is impossible to examine every member of the population.
Sample data are generally collected in one of two ways.
Access the text alternative for slide images.
- 9.
© McGraw Hill9
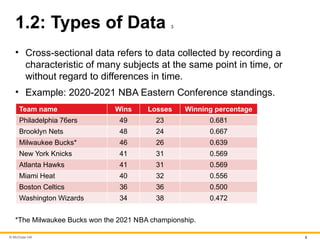
1.2: Types of Data 3
• Cross-sectional data refers to data collected by recording a
characteristic of many subjects at the same point in time, or
without regard to differences in time.
• Example: 2020-2021 NBA Eastern Conference standings.
Team name Wins Losses Winning percentage
Philadelphia 76ers 49 23 0.681
Brooklyn Nets 48 24 0.667
Milwaukee Bucks* 46 26 0.639
New York Knicks 41 31 0.569
Atlanta Hawks 41 31 0.569
Miami Heat 40 32 0.556
Boston Celtics 36 36 0.500
Washington Wizards 34 38 0.472
*The Milwaukee Bucks won the 2021 NBA championship.
- 10.
© McGraw Hill10
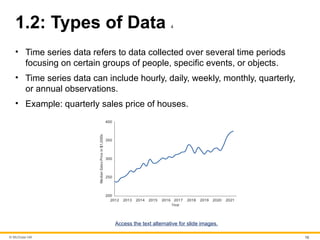
1.2: Types of Data 4
• Time series data refers to data collected over several time periods
focusing on certain groups of people, specific events, or objects.
• Time series data can include hourly, daily, weekly, monthly, quarterly,
or annual observations.
• Example: quarterly sales price of houses.
Access the text alternative for slide images.
- 11.
© McGraw Hill11
1.2: Types of Data 5
Structured data.
• Reside in a pre-defined, row-column format.
• Spreadsheet or database applications.
• Enter, store, query, and analyze.
• Numerical information that is objective and not open to interpretation.
• Examples include the sale of retail products, demographic information on
customers, and listed price and characteristics of houses on sale.
Unstructured data.
• Do not conform to a pre-defined, row-column format.
• Textual and multimedia content.
• Do not conform to database structures.
• These data may have some implied structure.
• Still considered unstructured.
• Do not conform to a row-column model required in most database systems.
• Example: social media data such as X, YouTube, Facebook, and blogs.
- 12.
© McGraw Hill12
1.2: Types of Data 6
Businesses generate and gather more and more data at an
increasing pace: Big Data.
• A massive volume of structured and unstructured data.
• Extremely difficult to manage, process, and analyze using
traditional data processing tools.
• Presents great opportunities to gain knowledge and game-
changing intelligence.
Does not imply complete (population) data.
Big data may not be used when available.
• Inconvenient and computationally burdensome.
• Benefits may not justify costs.
- 13.
© McGraw Hill13
1.2: Types of Data 7
There is an abundance of data on the Internet.
Many experts believe that 90% of the data in the world today was created
in the last two years alone.
It is easy to access and find data by using a search engine like Google.
There are several sources of data.
• Bureau of Economic Analysis.
• Bureau of Labor Statistics.
• Federal Research Economic Data.
• US Census Bureau.
• National Climate Data Center.
• Yahoo Finance, Google Finance.
• Zillow.
• ESPN.
- 14.
© McGraw Hill14
1.3: Variables and Scales of Measurement 1
A variable is a characteristic of interest that differs in
kind or degree among various observations (records).
There are two types of variables: categorical and
numeric.
Categorical Data.
• Also called qualitative.
• Represent categories.
• Labels or names to identify distinguishing characteristics.
• Can be defined by two or more categories.
• Coded into numbers for data processing.
• Example: marital status, grade in a course.
- 15.
© McGraw Hill15
1.3: Variables and Scales of Measurement 2
For a numerical variable, we use numbers to identify the distinguishing
characteristic of each observation.
Numeric Data.
• Also called quantitative.
• Represent meaningful numbers.
• Either discrete or continuous.
A discrete variable assumes a countable number of values.
• The values need not be whole numbers.
• Example: number of children in a family.
A continuous variable assumes an uncountable number of values within an
interval.
• In practice, often measure in discrete values.
• Example: weight of a newborn baby.
In order to choose the appropriate techniques for summarizing and analyzing
variables, we need to distinguish between the different measurement scales.
- 16.
© McGraw Hill16
1.3: Variables and Scales of Measurement 3
There are four major scales: nominal, ordinal, interval, ratio.
Nominal and ordinal scales are used for categorical variables.
Nominal.
• Least sophisticated.
• Represent categories or groups.
• Values differ by label or name.
• Example: marital status.
Ordinal.
• Stronger level of measurement.
• Categorize and rank data with respect to some characteristic.
• Cannot interpret the difference between the ranked values, numbers are arbitrary.
• Example: reviews from 1 star (poor) to 5 starts (outstanding).
Categorical variables are typically expressed in words but coded into numbers for
purposes of data processing.
• Typically count the number of observations that fall into each category (or find
percentages).
• Unable to perform meaningful arithmetic operations.
- 17.
© McGraw Hill17
1.3: Variables and Scales of Measurement 4
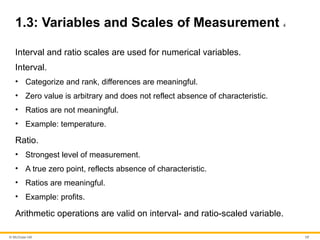
Interval and ratio scales are used for numerical variables.
Interval.
• Categorize and rank, differences are meaningful.
• Zero value is arbitrary and does not reflect absence of characteristic.
• Ratios are not meaningful.
• Example: temperature.
Ratio.
• Strongest level of measurement.
• A true zero point, reflects absence of characteristic.
• Ratios are meaningful.
• Example: profits.
Arithmetic operations are valid on interval- and ratio-scaled variable.
- 18.
© McGraw Hill18
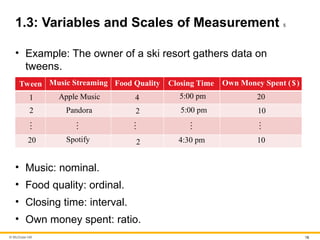
1.3: Variables and Scales of Measurement 5
• Example: The owner of a ski resort gathers data on
tweens.
Tween Music Streaming Food Quality Closing Time Own Money Spent ($)
1 Apple Music 4 5:00 pm 20
2 Pandora 2 5:00 pm 10
20 Spotify 2 4:30 pm 10
• Music: nominal.
• Food quality: ordinal.
• Closing time: interval.
• Own money spent: ratio.
- 19.
© McGraw Hill19
1.4: Data Preparation 1
We often spend a considerable amount of time inspecting and
preparing the data for the subsequent analysis.
• Counting and sorting.
• Handling missing values.
• Subsetting.
Counting and Sorting.
• Among the very first tasks analysts perform.
• Gain a better understanding and insights into the data.
• Help to verify that the data set is complete or determine if there are
missing values.
• Sorting allows us to review the range of values for each variable.
• Sort based on a single or multiple variables.
- 20.
© McGraw Hill20
1.4: Data Preparation 2
There are two common strategies for dealing with
missing values.
The omission strategy recommends that observations
with missing values be excluded from subsequent
analysis.
The imputation strategy recommends that the missing
values be replaced with some reasonable imputed
values.
• Numeric variables: replace with the average.
• Categorical variables: replace with the predominant
category.
- 21.
© McGraw Hill21
1.4: Data Preparation 3
Subsetting is the process of extracting a portion of the
data set that is relevant for subsequent statistical
analysis.
• The objective of the analysis is to compare two subsets of
the data.
• Eliminate observations that contain missing values, low-
quality data, or outliers.
• Excluding variables that contain redundant information, or
variables with excessive amounts of missing values.
We can also subset data based on data ranges.
- 22.
Because learning changeseverything.®
www.mheducation.com
End of Main Content
© McGraw Hill LLC. All rights reserved. No reproduction or distribution without the prior written consent of McGraw Hill LLC.