1
Cautionary Statement
Except for historical information, this presentation may contain certain “forward-looking” statements and information relating to
IMPACT that are based on the beliefs of IMPACT management, as well as assumptions made by and information currently available
to IMPACT management. Such statements reflect the current risks, uncertainties and assumptions related to certain factors including
but not limited to, exploration and development risks, expenditure and financing requirements, title matters, operating hazards, metal prices, political and
economic factors, competitive factors, general economic conditions, relationships with vendors and strategic partners, governmental regulation and supervision,
seasonality, technological change, industry practices, and one-time events. Should any one or more risks or uncertainties materialize or change, or should any
underlying assumptions prove incorrect, actual results and forward-looking statements may vary materially from those described herein. IMPACT does not
assume the obligation to update any forward-looking statement.
The factors that could cause actual results to differ materially include, but are not limited to, the following: general economic
conditions; changes in financial markets; the impact of exchange rates; political conditions and developments in countries in which
the Company operates; changes in the supply, demand and pricing of the metal commodities which the Company mines or hopes
to find and successfully mine; changes in regulatory requirements impacting the Company’s operations; the ability to properly and efficiently staff the Company’s
operations;
the
sufficiency
of
current
working
capital
and
the
estimated
cost
and
availability
of
funding
for the continued exploration and development of the Company’s exploration properties.
This list is not exhaustive and these and other factors should be considered carefully, and readers should not place undue reliance
on the Company’s forward-looking statements. As a result of the foregoing and other factors, no assurance can be given as to any such future results, levels of
activity or achievements and neither the Company nor any other person assumes responsibility for the accuracy and completeness of these forward-looking
statements.
NI43-101 QUALIFIED PERSON
George Gorzynski, P. Eng., Vice President, Exploration and a Qualified Person under the meaning of Canadian National Instrument 43-101, is responsible for the
technical information in this presentation.
2
Overview

GROWING
ASSETS

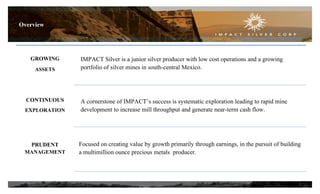
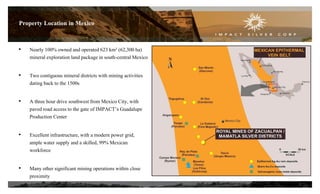
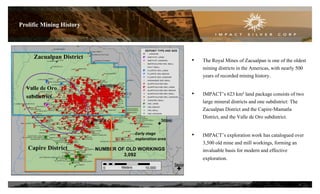
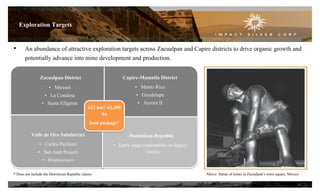
IMPACT Silver is a junior silver producer with low cost operations and a growing
portfolio of silver mines in south-central Mexico.

CONTINUOUS
EXPLORATION

A cornerstone of IMPACT’s success is systematic exploration leading to rapid mine
development to increase mill throughput and generate near-term cash flow.

PRUDENT
MANAGEMENT

Focused on creating value by growth primarily through earnings, in the pursuit of building
a multimillion ounce precious metals producer.

3
Directors & Management

Frederick W. Davidson, CA

President, CEO, Director

President of IMPACT Silver and Energold Drilling Corp. Over 33 years of mining experience, including
holding various senior positions at Erickson Gold Mines Ltd. and Mt. Skukum Gold Mines.

George Gorzynski, P. Eng.

VP Exploration, Director

Over 30 years of exploration and mining experience; current Director of Tirex Resources, Defiance
Silver and Berkwood Resources.

Richard Younker, CA, CMC

CFO

Held the senior financial consulting principal position at Woods Gordon; independent financial
consultant in public and private sectors.

Armando Alexandri

COO

Over 35 years of mining experience in underground and open-pit mines as well as flotation and
cyanidation processing plants.

H. Walter Sellmer, P. Geo

Director

Held senior positions at Amax Exploration, Canamax Resources Inc. and TOTAL Energold Corp.

Victor Tanaka, P. Geo

Director

President and CEO of Bayswater Uranium Corp. Held senior positions at Asamera Inc., Freeport
McMoRan Gold Corp., Aber Resources, Major General Resources, Fjordland Exploration and Pathfinder
Resources.

Richard Mazur, P. Geo, MBA

Director

President and CEO of Forum Uranium Corp. and CEO of Alto Ventures Ltd. Held senior positions at
Canamax Resources and IMPACT Minerals.

Peter Tredger, P. Eng., MBA

Director

Former Senior Officer of Thompson Creek Metals Company. Held senior positions at Glencairn Gold
(now B2Gold) and Wheaton River Minerals (now Goldcorp).

Jean-Pierre Bourtin, MBA

Director

President of a private equity firm in Connecticut, USA. Former Treasurer of Xerox Corp., Latin
American and Emerging Markets.
4
Property Location in Mexico
•

Nearly 100% owned and operated 623 km² (62,300 ha)
mineral exploration land package in south-central Mexico

•

Two contiguous mineral districts with mining activities
dating back to the 1500s

•

A three hour drive southwest from Mexico City, with
paved road access to the gate of IMPACT’s Guadalupe
Production Center

•

Excellent infrastructure, with a modern power grid,
ample water supply and a skilled, 99% Mexican
workforce

•

Many other significant mining operations within close
proximity
5
Prolific Mining History

Zacualpan District

•

•

Valle de Oro
subdistrict

Early stage
exploration area

Capire District

The Royal Mines of Zacualpan is one of the oldest
mining districts in the Americas, with nearly 500
years of recorded mining history.
IMPACT’s 623 km² land package consists of two
large mineral districts and one subdistrict: The
Zacualpan District and the Capire-Mamatla
District, and the Valle de Oro subdistrict.

•

IMPACT’s exploration work has catalogued over
3,500 old mine and mill workings, forming an
invaluable basis for modern and effective
exploration.

6
Mine and Production Center Location Map
• The 500-tpd Guadalupe Production Center is located
within the Zacualpan District.
• The Guadalupe Production Center receives ore from
three underground silver mines located within close
proximity:
• San Ramon Mine
• Noche Buena Mine
• Cuchara-Oscar Mine

• The 200-tpd Capire Production Centre is located
within the Capire-Mamatla District.
• The Capire Production Center commenced pilot
production in March 2013, with test operations
continuing with mineral feed from the adjacent
open-pit Capire Mine.
7
Long Term Goal and Mine Development Process
To build a profitable, mid-tier, multimillion ounce precious metals producing company with multiple
mines feeding multiple processing centres.
Exploration and Mine Development Process Flowchart
RESEARCH
Compile old mines
and prospects from
historic maps

FIELD WORK
Geological mapping,
surface and
underground rock
sampling

DRILLING
Drill program will
be results-driven and
implemented in
phases

MINE
DEVELOPMENT
Mine design, planning,
permitting and
construction

Over 3,000 old mine
workings and
prospects catalogued
in IMPACT’s ArcGIS
database

Select and prioritize
favorable areas and
prospects and design
the drill program

Current targets:
• Capire (south)
• Mirasol
• La Condesa
• Santa Efigenia
• San Juan

Pilot operations at
Capire Plant with plans
to expand to larger
scale production in the
future

PRODUCTION
&
CASH FLOW

• San Ramon

• Noche Buena
• Cuchara-Oscar
• Capire

8
Two Production Centres

Guadalupe Production
Centre
Centre
Zacualpan District
ZacualpanDistrict

500 TPD
500 TPD

Capire Production
Capire Production Centre
Centre
Capire-Mamatla District

200 TPD
200 TPD

Flotation circuit
Flotation circuit
Operating near
operating near capacity
capacity

Pilot operation with
Pilot plantplant with
expansionplans
expansion plans

Mill feed from
Mill feed from
San Ramon, Noche
San Ramon, Noche Buena &
Buena & Cuchara-Oscar
Cuchara-Oscar Mines
Mines

Mill feed from
Mill feed from
Capire Mine
Capire Mine

(epithermal, underground)
(underground)

(VMS, open-pit)
(open-pit)

9
Guadalupe Production Centre

• Guadalupe Production Centre (500 tpd)

• Flotation circuit produces silver-lead and zinc-silver
concentrates
10
Capire Mine and Production Centre

• Capire Production Centre (200 tpd pilot plant)

• Capire Mine (VMS, open-pit)
11
Four Producing Silver Mines

San Ramon

Noche Buena

Cuchara-Oscar

Capire

Began production in 2008
Epithermal veins
Current primary producing
mine in the Zacualpan
District

Began production in 2010
Epithermal veins in Valle de
Oro subdistrict located in the
Zacualpan District

Corridor of wide, high-grade
epithermal veins linking
legacy mines within the
Cuchara Mine Complex in
the Zacualpan District

Volcanogenic sulfide
deposit with high-grade
polymetallic mineralization
in the Capire-Mamatla
District

Contribution of total
production in Q3 2013: 27%

Contribution of total
production in Q3 2013: 0%
(In commissioning phase)

Contribution of total
production in Q3 2013: 41%

Contribution of total
production in Q3 2013: 32%

12
Geology of Epithermal Vein Systems

Metal Level in Producing Mines

Metal Zoning in Ore Shoots
Strike Length
150 – 420 m (500 – 1,400 ft)

Cuchara-Oscar Mine

Surface – 0 m (0 ft)

Silver-rich at top of vein
200 – 1,000+ g/t Ag

Noche Buena Mine
San Ramon Mine

Depth

150 m (500 ft)

Lead and Zinc-rich at
bottom of vein
60 – 150 g/t Ag
300 m (1,000 ft)

Valle de Oro subdistrict
Exploration property, includes Carlos Pacheco
gold-copper zone and San Juan Project

Gold-copper at depths
of 300 m+

13
Exploration Targets
•

An abundance of attractive exploration targets across Zacualpan and Capire districts to drive organic growth and
potentially advance into mine development and production.
Zacualpan District
• Mirasol
• La Condesa
• Santa Efigenia

623 km²/ 62,300
ha
land package*

Valle de Oro Subdistrict
• Carlos Pacheco
• San Juan Project
• Huatescosco
* Does not include the Dominican Republic claims

Capire-Mamatla District
• Manto Rico
• Guadalupe
• Aurora II

Dominican Republic
• Early stage exploration on legacy
claims

Above: Statue of miner in Zacualpan’s town square, Mexico

14
Production Summary

Production Highlights
Silver production (oz)
Gold production (oz)
Average mill head grade (silver
grams per tonne)

Q3 2013

HY 2013

YE 2012

185,998

351,649

620,515

348

584

Silver-Focused Producer

629

2012 Metal Production
Silver - 85.5%

171

155

138
Lead - 4.2%

Total tonnes produced (t)

38,520

84,095

168,826

Tonnes produced per day

419

467

463

Revenue per production tonne sold

$81

$94

$94

Direct costs per production tonne

$67

$67

$65

Zinc - 6.1%
Gold - 4.2%

15
Financial Highlights

Q3 2013

HY 2013

YE 2012

YE 2011

Revenues

$3.1

$8.0

$15.9

$24.3

Operating expenses

$2.7

$5.8

$10.3

$10.1

Mine operating earnings (loss)

($0.4)

$1.2

$4.0

$12.9

EBITDA

($0.5)

($1.2)

$1.6

$13.0

Net earnings (loss)

($1.2)

($2.6)

($1.1)

$7.6

($0.05)

$0.6

$3.3

$10.2

Nil

Nil

Nil

Nil

($0.02)

($0.04)

($0.02)

$0.12

Cash and cash equivalents

$6.7

$10.0

$16.0

$30.8

Working capital

$9.9

$12.7

$21.4

$31.2

(CDN$000’000’s except EPS)

Operating cash flow*
Debt

Earnings (loss) per share – basic

The Company’s working capital and cash position decreased from the year ended December 31, 2012, as the Company continued to invest in
the development of the Capire Mine and Production Centre, as well as continued exploration in the Zacualpan District.
*Before changes in non-cash working capital

16
Corporate Summary (TSX-V: IPT)
All prices in Canadian Dollars

As of January 13, 2014

Common shares – Issued & Outstanding

68.1M

Fully Diluted

1-Year Chart Summary

74.8M

Share Price
52wk Range

$0.58
$0.44 - $1.22

90-Day Average Daily Volume

43,584

Market Capitalization

39.5M

Insider and Institutional Ownership

14.9%

Options Issued
Warrants

6.7M

Source: BigCharts.com

Nil

17
Plans for Growth

2013
2014

2015

• 30,000 meter exploration drill program (completed)
• Increase average silver mill feed grade (completed: Q1-146 g/t Ag; Q2 – 163 g/t Ag; Q3 – 171 g/t Ag)
• Complete drilling at Mirasol Prospect and determine its potential as next producing mine (completed)

• Continue drilling on the VMS targets in the Capire district
• Advance towards graduation from the TSX-V to the TSX

• Consider the location of an additional production center in the Zacualpan District
• Define the size of the planned expansion at the Capire Processing Centre and to initiate construction the
larger processing plant

18
Contact Us

IMPACT Silver Corp.
TSX-V: IPT Frankfurt: IKL

Telephone

1-604-681-0172

Fax

1-604-681-6813

Email
Investor Relations Manager

inquiries@impactsilver.com
Meghan Brush, BBA

Website

www.impactsilver.com

Twitter

@IMPACT_Silver

Corporate Address

Suite1100 - 543 Granville Street
Vancouver, BC, Canada V6C 1X8

19
Appendix I: Capire NI 43-101 Resource Estimate
Completed February 2011

Metal Content for Capire Mine

Ag (oz)

Au (oz)

Cu (lb)

Pb (lbs)

Zn (lbs)

Measured

3,529,969

14,146

3,389,275

18,234,678

46,140,820

Indicated

3,694,066

16,300

3,693,733

19,029,800

49,522,173

Measured & Indicated (M&I)

7,224,035

30,446

7,083,007

37,264,478

95,662,993

435,959

1,919

475,594

2,260,089

5,823,490

Inferred

Summary Table of Classified Mineral Resources – Measured & Indicated and Separate Inferred

Zone

Classification

Tonnes

Ag (g/t)

Au (g/t)

Cu (%)

Pb (%)

Zn (%)

Capire

M&I

3,104,944

46.46

0.19

0.06

0.33

0.93

Aurora 1

M&I

1,807,302

44.50

0.199

0.07

0.36

0.80

M&I

4,912,246

45.74

0.193

0.06

0.34

0.88

371,066

36.54

0.161

0.06

0.28

0.71

Total

•
•

Inferred

Drilling in 2010 showed Capire and Aurora 1 to be one continuous zone, now referred to as Capire
See National Instrument 43-101 Resource Estimate on the Company website at www.impactsilver.com
20
Appendix II: Capire Drill Highlights

A Selection of Capire Drill Highlights
Drill Hole

From (m)

To
(m)

Interval
(m)

Ag (g/t)

Au (g/t)

Pb
(%)

Zn
(%)

Cu
(%)

C12-06

78.25

80.30

2.05

507

1.81

2.20

4.02

0.41

including

79.30

80.30

1.00

929

3.27

2.77

5.27

0.63

105.70

110.80

5.10

183

0.20

1.05

2.45

0.13

C12-21

83.35

100.10

16.75

153

0.40

1.14

2.71

0.21

including

92.40

97.00

4.60

435

0.71

3.13

5.99

0.48

C12-25

13.20

23.35

10.15

107

0.58

0.90

2.43

0.10

including

13.20

15.25

2.05

315

0.91

2.93

8.19

0.25

and

•
•

Drill holes listed above were drilled vertically and all intersections are estimated to be close to true width
See IMPACT Silver News Release dated October 25, 2012

21
Appendix III: Mirasol Drill Highlights

A Selection of Mirasol Drill Highlights
Interval
(m)

Ag (g/t)

Au (g/t)

Pb
(%)

Zn
(%)

Vein Name

Z12-71

Mirasol Central

73.9

82.9

8.98

183

0.030

0.07

0.14

including

Mirasol Central

75.2

82.4

7.15

216

0.040

0.08

0.16

Z12-79

Mirasol Arriba 4

111.22

113.36

2.14

119

0.014

0.07

0.18

and

Mirasol Arriba 3

127.25

128.40

1.15

400

0.034

0.13

0.08

and

Mirasol Arriba 1

162.60

164.48

1.88

529

0.283

0.37

1.31

Z12-80

El Deshuesadero

83.45

85.15

1.70

931

0.30

1.03

2.10

Z12-85

Mirasol Arriba 3

114.65

116.00

1.35

792

0.143

0.48

0.16

Z12-86

Mirasol

176.56

177.60

1.04

337

0.023

0.15

0.76

•
•

From (m)

To
(m)

Drill Hole

Discovered in November 2012, located 5.5km from Guadalupe Production Center, in Zacualpan
Several high grade silver values discovered, with drill hole Z12-79 encountering seven distinct veins, all of which are contributing potentially economic silver
intersections. See IMPACT Silver News Releases dated January 28, 2013 and November 26, 2012
22
Appendix IV: Cuchara-Oscar Drill Highlights

A Selection of Cuchara-Oscar Drill Highlights
Drill Hole

To (m)

From (m)

Interval (m)

Ag (g/t)

Au (g/t)

Pb (%)

Zn (%)

Z11-46

92.10

97.75

5.65

1,007

0.07

0.50

1.1

including

96.70

97.75

1.05

4,580

0.26

1.70

4.0

108.95

111.70

2.75

1,128

0.51

0.90

1.4

Z11-55

21.80

22.85

1.05

435

0.01

0.15

0.24

Z11-64

36.60

43.20

6.60

223

0.08

0.18

0.52

Z11-69

0.70

3.35

2.65

408

0.62

0.73

1.12

Z11-74

21.35

22.35

1.00

1,875

0.74

2.65

6.88

Z12-05

92.50

97.60

5.10

234

0.05

0.14

0.49

Z12-08

22.36

45.75

23.39

115

0.02

0.12

0.36

and

•

See IMPACT Silver News Releases dated October 26, 2011 and April 23, 2012
23
Appendix V: Valle de Oro Drill Highlights
A Selection of Carlos Pacheco Drill Highlights

Drill Hole

From (m)

To (m)

Interval (m)

Au (g/t)

Ag (g/t)

Cu (%)

Z08-68

Top of intercept -

85.74

2.90

19.6

68

0.29

including

Top of intercept -

85.74

1.0

49.7

59

0.31

Z12-13

192.30

199.00

6.70

3.84

28

0.54

including

192.30

195.05

2.75

8.47

56

1.12

Z12-23

229.85

230.95

1.10

3.82

84

0.54

A Selection of Intermediate Vein Drill Highlights
Drill Hole

From (m)

To (m)

Interval (m)

Au (g/t)

Ag (g/t)

Pb (%)

Zn (%)

Z12-16

100.00

114.30

14.30

0.04

82

0.09

0.19

including

100.00

106.50

6.50

0.06

119

0.06

0.14

Z12-18

57.00

59.00

2.00

0.20

337

0.23

0.43

Z12-23

26.10

28.10

2.00

0.22

207

0.10

0.15

•

In addition to the gold-copper mineralization in the Carlos Pacheco vein, other drill holes intersected Ag-Pb-Zn mineralization in the Intermediate vein cluster, located midway between the
Carlos Pacheco and Noche Buena veins. See IMPACT Silver News Releases dated December 4, 2008 and July 11, 2012

24
Appendix VI: La Condesa Drill Highlights

A Selection of La Condesa Drill Highlights
Drill Hole

To (m)

From (m)

Interval (m)

Ag (g/t)

Au (g/t)

Pb (%)

Zn (%)

Z12-39

167.30

171.00

3.70

312

0.029

0.27

0.90

Z12-42

136.00

139.78

3.78

214

0.269

0.15

0.37

Z12-45

177.90

179.00

1.10

1,655

0.010

0.25

0.08

Z12-46

151.40

154.25

2.85

255

0.111

0.22

0.46

Z12-55

57.80

59.60

1.80

245

0.030

0.12

0.36

Z12-63

106.50

108.85

2.35

231

0.010

0.16

0.26

Z12-64

101.10

105.55

4.45

200

0.035

0.21

0.49

Z12-68

46.40

50.30

3.90

250

0.009

0.07

0.16

•
•
•

La Condesa accessed through the underground workings of the historic Cuchara Mine, which is also used to access the Cuchara-Oscar Mine
Mineralization from La Condesa is planned to augment the production from Cuchara-Oscar
See IMPACT Silver News Release dated November 19, 2012
25
Appendix VII: San Juan Project Drill Highlights

A Selection of San Juan Project Area Drill Highlights
Drill Hole

Vein Name

Z13-40

From (m)

To (m)

True Width (m)

Ag (g/t)

Au (g/t)

Pb (%)

Zn (%)

61.70

63.15

1.31

7.9

3.956

0.10

0.19

Z13-42

Carlos Pacheco

119.30

128.60

9.02

21.3

3.894

0.98

3.28

including

Carlos Pacheco

127.65

128.60

0.92

73.3

33.630

4.09

12.02

Z13-43

Carlos Pacheco

92.05

98.95

6.63

152.4

0.412

0.28

0.75

Z13-44

Noche Buena

11.60

14.00

2.07

1,409.8

0.963

0.29

0.34

including

Carlos Pacheco

158.05

162.40

4.03

30.9

4.070

0.18

0.83

Z13-45

Carlos Pacheco

14.60

22.55

7.47

41.64

0.050

0.18

0.25

and

Carlos Pacheco

169.00

173.00

3.78

18.3

9.350

0.04

0.08

•
•

These first phase drill results are from the San Juan Project Area, located in the Valle de Oro subdistrict, adjacent to the producing Noche Buena Mine
The San Juan Project Area encompasses a series of old mine workings containing multiple working levels located 150m to the north of the Noche
Buena Mine. These old working lie along the northern extension of the Carlos Pacheco Vein, where previous drilling intersected 19.6g/t gold across
2.9m and 3.84g/t gold across 6.7m. See IMPACT Silver News Release dated October 30, 2013 for details.
26
27

Impact Silver Corporate Presentation

  • 1.
  • 2.
    Cautionary Statement Except forhistorical information, this presentation may contain certain “forward-looking” statements and information relating to IMPACT that are based on the beliefs of IMPACT management, as well as assumptions made by and information currently available to IMPACT management. Such statements reflect the current risks, uncertainties and assumptions related to certain factors including but not limited to, exploration and development risks, expenditure and financing requirements, title matters, operating hazards, metal prices, political and economic factors, competitive factors, general economic conditions, relationships with vendors and strategic partners, governmental regulation and supervision, seasonality, technological change, industry practices, and one-time events. Should any one or more risks or uncertainties materialize or change, or should any underlying assumptions prove incorrect, actual results and forward-looking statements may vary materially from those described herein. IMPACT does not assume the obligation to update any forward-looking statement. The factors that could cause actual results to differ materially include, but are not limited to, the following: general economic conditions; changes in financial markets; the impact of exchange rates; political conditions and developments in countries in which the Company operates; changes in the supply, demand and pricing of the metal commodities which the Company mines or hopes to find and successfully mine; changes in regulatory requirements impacting the Company’s operations; the ability to properly and efficiently staff the Company’s operations; the sufficiency of current working capital and the estimated cost and availability of funding for the continued exploration and development of the Company’s exploration properties. This list is not exhaustive and these and other factors should be considered carefully, and readers should not place undue reliance on the Company’s forward-looking statements. As a result of the foregoing and other factors, no assurance can be given as to any such future results, levels of activity or achievements and neither the Company nor any other person assumes responsibility for the accuracy and completeness of these forward-looking statements. NI43-101 QUALIFIED PERSON George Gorzynski, P. Eng., Vice President, Exploration and a Qualified Person under the meaning of Canadian National Instrument 43-101, is responsible for the technical information in this presentation. 2
  • 3.
    Overview GROWING ASSETS IMPACT Silver isa junior silver producer with low cost operations and a growing portfolio of silver mines in south-central Mexico. CONTINUOUS EXPLORATION A cornerstone of IMPACT’s success is systematic exploration leading to rapid mine development to increase mill throughput and generate near-term cash flow. PRUDENT MANAGEMENT Focused on creating value by growth primarily through earnings, in the pursuit of building a multimillion ounce precious metals producer. 3
  • 4.
    Directors & Management FrederickW. Davidson, CA President, CEO, Director President of IMPACT Silver and Energold Drilling Corp. Over 33 years of mining experience, including holding various senior positions at Erickson Gold Mines Ltd. and Mt. Skukum Gold Mines. George Gorzynski, P. Eng. VP Exploration, Director Over 30 years of exploration and mining experience; current Director of Tirex Resources, Defiance Silver and Berkwood Resources. Richard Younker, CA, CMC CFO Held the senior financial consulting principal position at Woods Gordon; independent financial consultant in public and private sectors. Armando Alexandri COO Over 35 years of mining experience in underground and open-pit mines as well as flotation and cyanidation processing plants. H. Walter Sellmer, P. Geo Director Held senior positions at Amax Exploration, Canamax Resources Inc. and TOTAL Energold Corp. Victor Tanaka, P. Geo Director President and CEO of Bayswater Uranium Corp. Held senior positions at Asamera Inc., Freeport McMoRan Gold Corp., Aber Resources, Major General Resources, Fjordland Exploration and Pathfinder Resources. Richard Mazur, P. Geo, MBA Director President and CEO of Forum Uranium Corp. and CEO of Alto Ventures Ltd. Held senior positions at Canamax Resources and IMPACT Minerals. Peter Tredger, P. Eng., MBA Director Former Senior Officer of Thompson Creek Metals Company. Held senior positions at Glencairn Gold (now B2Gold) and Wheaton River Minerals (now Goldcorp). Jean-Pierre Bourtin, MBA Director President of a private equity firm in Connecticut, USA. Former Treasurer of Xerox Corp., Latin American and Emerging Markets. 4
  • 5.
    Property Location inMexico • Nearly 100% owned and operated 623 km² (62,300 ha) mineral exploration land package in south-central Mexico • Two contiguous mineral districts with mining activities dating back to the 1500s • A three hour drive southwest from Mexico City, with paved road access to the gate of IMPACT’s Guadalupe Production Center • Excellent infrastructure, with a modern power grid, ample water supply and a skilled, 99% Mexican workforce • Many other significant mining operations within close proximity 5
  • 6.
    Prolific Mining History ZacualpanDistrict • • Valle de Oro subdistrict Early stage exploration area Capire District The Royal Mines of Zacualpan is one of the oldest mining districts in the Americas, with nearly 500 years of recorded mining history. IMPACT’s 623 km² land package consists of two large mineral districts and one subdistrict: The Zacualpan District and the Capire-Mamatla District, and the Valle de Oro subdistrict. • IMPACT’s exploration work has catalogued over 3,500 old mine and mill workings, forming an invaluable basis for modern and effective exploration. 6
  • 7.
    Mine and ProductionCenter Location Map • The 500-tpd Guadalupe Production Center is located within the Zacualpan District. • The Guadalupe Production Center receives ore from three underground silver mines located within close proximity: • San Ramon Mine • Noche Buena Mine • Cuchara-Oscar Mine • The 200-tpd Capire Production Centre is located within the Capire-Mamatla District. • The Capire Production Center commenced pilot production in March 2013, with test operations continuing with mineral feed from the adjacent open-pit Capire Mine. 7
  • 8.
    Long Term Goaland Mine Development Process To build a profitable, mid-tier, multimillion ounce precious metals producing company with multiple mines feeding multiple processing centres. Exploration and Mine Development Process Flowchart RESEARCH Compile old mines and prospects from historic maps FIELD WORK Geological mapping, surface and underground rock sampling DRILLING Drill program will be results-driven and implemented in phases MINE DEVELOPMENT Mine design, planning, permitting and construction Over 3,000 old mine workings and prospects catalogued in IMPACT’s ArcGIS database Select and prioritize favorable areas and prospects and design the drill program Current targets: • Capire (south) • Mirasol • La Condesa • Santa Efigenia • San Juan Pilot operations at Capire Plant with plans to expand to larger scale production in the future PRODUCTION & CASH FLOW • San Ramon • Noche Buena • Cuchara-Oscar • Capire 8
  • 9.
    Two Production Centres GuadalupeProduction Guadalupe Production Centre Centre Zacualpan District ZacualpanDistrict 500 TPD 500 TPD Capire Production Capire Production Centre Centre Capire-Mamatla District Capire-Mamatla District 200 TPD 200 TPD Flotation circuit Flotation circuit Operating near operating near capacity capacity Pilot operation with Pilot plantplant with expansionplans expansion plans Mill feed from Mill feed from San Ramon, Noche San Ramon, Noche Buena & Buena & Cuchara-Oscar Cuchara-Oscar Mines Mines Mill feed from Mill feed from Capire Mine Capire Mine (epithermal, underground) (underground) (VMS, open-pit) (open-pit) 9
  • 10.
    Guadalupe Production Centre •Guadalupe Production Centre (500 tpd) • Flotation circuit produces silver-lead and zinc-silver concentrates 10
  • 11.
    Capire Mine andProduction Centre • Capire Production Centre (200 tpd pilot plant) • Capire Mine (VMS, open-pit) 11
  • 12.
    Four Producing SilverMines San Ramon Noche Buena Cuchara-Oscar Capire Began production in 2008 Epithermal veins Current primary producing mine in the Zacualpan District Began production in 2010 Epithermal veins in Valle de Oro subdistrict located in the Zacualpan District Corridor of wide, high-grade epithermal veins linking legacy mines within the Cuchara Mine Complex in the Zacualpan District Volcanogenic sulfide deposit with high-grade polymetallic mineralization in the Capire-Mamatla District Contribution of total production in Q3 2013: 27% Contribution of total production in Q3 2013: 0% (In commissioning phase) Contribution of total production in Q3 2013: 41% Contribution of total production in Q3 2013: 32% 12
  • 13.
    Geology of EpithermalVein Systems Metal Level in Producing Mines Metal Zoning in Ore Shoots Strike Length 150 – 420 m (500 – 1,400 ft) Cuchara-Oscar Mine Surface – 0 m (0 ft) Silver-rich at top of vein 200 – 1,000+ g/t Ag Noche Buena Mine San Ramon Mine Depth 150 m (500 ft) Lead and Zinc-rich at bottom of vein 60 – 150 g/t Ag 300 m (1,000 ft) Valle de Oro subdistrict Exploration property, includes Carlos Pacheco gold-copper zone and San Juan Project Gold-copper at depths of 300 m+ 13
  • 14.
    Exploration Targets • An abundanceof attractive exploration targets across Zacualpan and Capire districts to drive organic growth and potentially advance into mine development and production. Zacualpan District • Mirasol • La Condesa • Santa Efigenia 623 km²/ 62,300 ha land package* Valle de Oro Subdistrict • Carlos Pacheco • San Juan Project • Huatescosco * Does not include the Dominican Republic claims Capire-Mamatla District • Manto Rico • Guadalupe • Aurora II Dominican Republic • Early stage exploration on legacy claims Above: Statue of miner in Zacualpan’s town square, Mexico 14
  • 15.
    Production Summary Production Highlights Silverproduction (oz) Gold production (oz) Average mill head grade (silver grams per tonne) Q3 2013 HY 2013 YE 2012 185,998 351,649 620,515 348 584 Silver-Focused Producer 629 2012 Metal Production Silver - 85.5% 171 155 138 Lead - 4.2% Total tonnes produced (t) 38,520 84,095 168,826 Tonnes produced per day 419 467 463 Revenue per production tonne sold $81 $94 $94 Direct costs per production tonne $67 $67 $65 Zinc - 6.1% Gold - 4.2% 15
  • 16.
    Financial Highlights Q3 2013 HY2013 YE 2012 YE 2011 Revenues $3.1 $8.0 $15.9 $24.3 Operating expenses $2.7 $5.8 $10.3 $10.1 Mine operating earnings (loss) ($0.4) $1.2 $4.0 $12.9 EBITDA ($0.5) ($1.2) $1.6 $13.0 Net earnings (loss) ($1.2) ($2.6) ($1.1) $7.6 ($0.05) $0.6 $3.3 $10.2 Nil Nil Nil Nil ($0.02) ($0.04) ($0.02) $0.12 Cash and cash equivalents $6.7 $10.0 $16.0 $30.8 Working capital $9.9 $12.7 $21.4 $31.2 (CDN$000’000’s except EPS) Operating cash flow* Debt Earnings (loss) per share – basic The Company’s working capital and cash position decreased from the year ended December 31, 2012, as the Company continued to invest in the development of the Capire Mine and Production Centre, as well as continued exploration in the Zacualpan District. *Before changes in non-cash working capital 16
  • 17.
    Corporate Summary (TSX-V:IPT) All prices in Canadian Dollars As of January 13, 2014 Common shares – Issued & Outstanding 68.1M Fully Diluted 1-Year Chart Summary 74.8M Share Price 52wk Range $0.58 $0.44 - $1.22 90-Day Average Daily Volume 43,584 Market Capitalization 39.5M Insider and Institutional Ownership 14.9% Options Issued Warrants 6.7M Source: BigCharts.com Nil 17
  • 18.
    Plans for Growth 2013 2014 2015 •30,000 meter exploration drill program (completed) • Increase average silver mill feed grade (completed: Q1-146 g/t Ag; Q2 – 163 g/t Ag; Q3 – 171 g/t Ag) • Complete drilling at Mirasol Prospect and determine its potential as next producing mine (completed) • Continue drilling on the VMS targets in the Capire district • Advance towards graduation from the TSX-V to the TSX • Consider the location of an additional production center in the Zacualpan District • Define the size of the planned expansion at the Capire Processing Centre and to initiate construction the larger processing plant 18
  • 19.
    Contact Us IMPACT SilverCorp. TSX-V: IPT Frankfurt: IKL Telephone 1-604-681-0172 Fax 1-604-681-6813 Email Investor Relations Manager inquiries@impactsilver.com Meghan Brush, BBA Website www.impactsilver.com Twitter @IMPACT_Silver Corporate Address Suite1100 - 543 Granville Street Vancouver, BC, Canada V6C 1X8 19
  • 20.
    Appendix I: CapireNI 43-101 Resource Estimate Completed February 2011 Metal Content for Capire Mine Ag (oz) Au (oz) Cu (lb) Pb (lbs) Zn (lbs) Measured 3,529,969 14,146 3,389,275 18,234,678 46,140,820 Indicated 3,694,066 16,300 3,693,733 19,029,800 49,522,173 Measured & Indicated (M&I) 7,224,035 30,446 7,083,007 37,264,478 95,662,993 435,959 1,919 475,594 2,260,089 5,823,490 Inferred Summary Table of Classified Mineral Resources – Measured & Indicated and Separate Inferred Zone Classification Tonnes Ag (g/t) Au (g/t) Cu (%) Pb (%) Zn (%) Capire M&I 3,104,944 46.46 0.19 0.06 0.33 0.93 Aurora 1 M&I 1,807,302 44.50 0.199 0.07 0.36 0.80 M&I 4,912,246 45.74 0.193 0.06 0.34 0.88 371,066 36.54 0.161 0.06 0.28 0.71 Total • • Inferred Drilling in 2010 showed Capire and Aurora 1 to be one continuous zone, now referred to as Capire See National Instrument 43-101 Resource Estimate on the Company website at www.impactsilver.com 20
  • 21.
    Appendix II: CapireDrill Highlights A Selection of Capire Drill Highlights Drill Hole From (m) To (m) Interval (m) Ag (g/t) Au (g/t) Pb (%) Zn (%) Cu (%) C12-06 78.25 80.30 2.05 507 1.81 2.20 4.02 0.41 including 79.30 80.30 1.00 929 3.27 2.77 5.27 0.63 105.70 110.80 5.10 183 0.20 1.05 2.45 0.13 C12-21 83.35 100.10 16.75 153 0.40 1.14 2.71 0.21 including 92.40 97.00 4.60 435 0.71 3.13 5.99 0.48 C12-25 13.20 23.35 10.15 107 0.58 0.90 2.43 0.10 including 13.20 15.25 2.05 315 0.91 2.93 8.19 0.25 and • • Drill holes listed above were drilled vertically and all intersections are estimated to be close to true width See IMPACT Silver News Release dated October 25, 2012 21
  • 22.
    Appendix III: MirasolDrill Highlights A Selection of Mirasol Drill Highlights Interval (m) Ag (g/t) Au (g/t) Pb (%) Zn (%) Vein Name Z12-71 Mirasol Central 73.9 82.9 8.98 183 0.030 0.07 0.14 including Mirasol Central 75.2 82.4 7.15 216 0.040 0.08 0.16 Z12-79 Mirasol Arriba 4 111.22 113.36 2.14 119 0.014 0.07 0.18 and Mirasol Arriba 3 127.25 128.40 1.15 400 0.034 0.13 0.08 and Mirasol Arriba 1 162.60 164.48 1.88 529 0.283 0.37 1.31 Z12-80 El Deshuesadero 83.45 85.15 1.70 931 0.30 1.03 2.10 Z12-85 Mirasol Arriba 3 114.65 116.00 1.35 792 0.143 0.48 0.16 Z12-86 Mirasol 176.56 177.60 1.04 337 0.023 0.15 0.76 • • From (m) To (m) Drill Hole Discovered in November 2012, located 5.5km from Guadalupe Production Center, in Zacualpan Several high grade silver values discovered, with drill hole Z12-79 encountering seven distinct veins, all of which are contributing potentially economic silver intersections. See IMPACT Silver News Releases dated January 28, 2013 and November 26, 2012 22
  • 23.
    Appendix IV: Cuchara-OscarDrill Highlights A Selection of Cuchara-Oscar Drill Highlights Drill Hole To (m) From (m) Interval (m) Ag (g/t) Au (g/t) Pb (%) Zn (%) Z11-46 92.10 97.75 5.65 1,007 0.07 0.50 1.1 including 96.70 97.75 1.05 4,580 0.26 1.70 4.0 108.95 111.70 2.75 1,128 0.51 0.90 1.4 Z11-55 21.80 22.85 1.05 435 0.01 0.15 0.24 Z11-64 36.60 43.20 6.60 223 0.08 0.18 0.52 Z11-69 0.70 3.35 2.65 408 0.62 0.73 1.12 Z11-74 21.35 22.35 1.00 1,875 0.74 2.65 6.88 Z12-05 92.50 97.60 5.10 234 0.05 0.14 0.49 Z12-08 22.36 45.75 23.39 115 0.02 0.12 0.36 and • See IMPACT Silver News Releases dated October 26, 2011 and April 23, 2012 23
  • 24.
    Appendix V: Vallede Oro Drill Highlights A Selection of Carlos Pacheco Drill Highlights Drill Hole From (m) To (m) Interval (m) Au (g/t) Ag (g/t) Cu (%) Z08-68 Top of intercept - 85.74 2.90 19.6 68 0.29 including Top of intercept - 85.74 1.0 49.7 59 0.31 Z12-13 192.30 199.00 6.70 3.84 28 0.54 including 192.30 195.05 2.75 8.47 56 1.12 Z12-23 229.85 230.95 1.10 3.82 84 0.54 A Selection of Intermediate Vein Drill Highlights Drill Hole From (m) To (m) Interval (m) Au (g/t) Ag (g/t) Pb (%) Zn (%) Z12-16 100.00 114.30 14.30 0.04 82 0.09 0.19 including 100.00 106.50 6.50 0.06 119 0.06 0.14 Z12-18 57.00 59.00 2.00 0.20 337 0.23 0.43 Z12-23 26.10 28.10 2.00 0.22 207 0.10 0.15 • In addition to the gold-copper mineralization in the Carlos Pacheco vein, other drill holes intersected Ag-Pb-Zn mineralization in the Intermediate vein cluster, located midway between the Carlos Pacheco and Noche Buena veins. See IMPACT Silver News Releases dated December 4, 2008 and July 11, 2012 24
  • 25.
    Appendix VI: LaCondesa Drill Highlights A Selection of La Condesa Drill Highlights Drill Hole To (m) From (m) Interval (m) Ag (g/t) Au (g/t) Pb (%) Zn (%) Z12-39 167.30 171.00 3.70 312 0.029 0.27 0.90 Z12-42 136.00 139.78 3.78 214 0.269 0.15 0.37 Z12-45 177.90 179.00 1.10 1,655 0.010 0.25 0.08 Z12-46 151.40 154.25 2.85 255 0.111 0.22 0.46 Z12-55 57.80 59.60 1.80 245 0.030 0.12 0.36 Z12-63 106.50 108.85 2.35 231 0.010 0.16 0.26 Z12-64 101.10 105.55 4.45 200 0.035 0.21 0.49 Z12-68 46.40 50.30 3.90 250 0.009 0.07 0.16 • • • La Condesa accessed through the underground workings of the historic Cuchara Mine, which is also used to access the Cuchara-Oscar Mine Mineralization from La Condesa is planned to augment the production from Cuchara-Oscar See IMPACT Silver News Release dated November 19, 2012 25
  • 26.
    Appendix VII: SanJuan Project Drill Highlights A Selection of San Juan Project Area Drill Highlights Drill Hole Vein Name Z13-40 From (m) To (m) True Width (m) Ag (g/t) Au (g/t) Pb (%) Zn (%) 61.70 63.15 1.31 7.9 3.956 0.10 0.19 Z13-42 Carlos Pacheco 119.30 128.60 9.02 21.3 3.894 0.98 3.28 including Carlos Pacheco 127.65 128.60 0.92 73.3 33.630 4.09 12.02 Z13-43 Carlos Pacheco 92.05 98.95 6.63 152.4 0.412 0.28 0.75 Z13-44 Noche Buena 11.60 14.00 2.07 1,409.8 0.963 0.29 0.34 including Carlos Pacheco 158.05 162.40 4.03 30.9 4.070 0.18 0.83 Z13-45 Carlos Pacheco 14.60 22.55 7.47 41.64 0.050 0.18 0.25 and Carlos Pacheco 169.00 173.00 3.78 18.3 9.350 0.04 0.08 • • These first phase drill results are from the San Juan Project Area, located in the Valle de Oro subdistrict, adjacent to the producing Noche Buena Mine The San Juan Project Area encompasses a series of old mine workings containing multiple working levels located 150m to the north of the Noche Buena Mine. These old working lie along the northern extension of the Carlos Pacheco Vein, where previous drilling intersected 19.6g/t gold across 2.9m and 3.84g/t gold across 6.7m. See IMPACT Silver News Release dated October 30, 2013 for details. 26
  • 27.