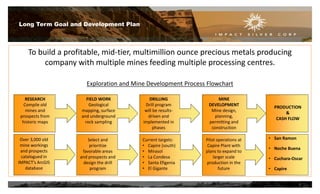
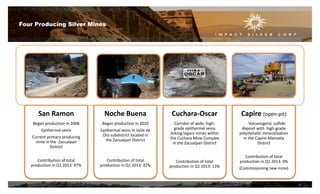
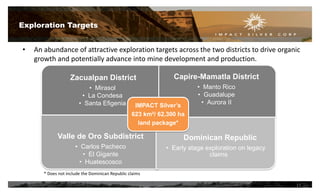
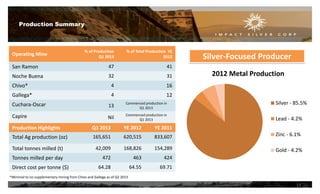
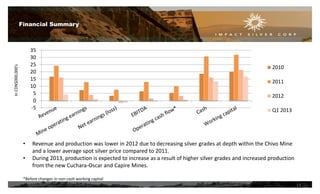
1
Except for historical information, this presentation may contain certain “ forward-looking ” statements and information relating to
IMPACT that are based on the beliefs of IMPACT management, as well as assumptions made by and information currently available
to IMPACT management. Such statements reflect the current risks, uncertainties and assumptions related to certain factors including
but not limited to, exploration and development risks, expenditure and financing requirements, title matters, operating hazards, metal prices, political
and economic factors, competitive factors, general economic conditions, relationships with vendors and strategic partners, governmental regulation and
supervision, seasonality, technological change, industry practices, and one-time events. Should any one or more risks or uncertainties materialize or
change, or should any underlying assumptions prove incorrect, actual results and forward-looking statements may vary materially from those described
herein. IMPACT does not assume the obligation to update any forward-looking statement.
The factors that could cause actual results to differ materially include, but are not limited to, the following: general economic
conditions; changes in financial markets; the impact of exchange rates; political conditions and developments in countries in which
the Company operates; changes in the supply, demand and pricing of the metal commodities which the Company mines or hopes
to find and successfully mine; changes in regulatory requirements impacting the Company’s operations; the ability to properly and efficiently staff the
Company ’ s operations; the sufficiency of current working capital and the estimated cost and availability of funding
for the continued exploration and development of the Company’s exploration properties.
This list is not exhaustive and these and other factors should be considered carefully, and readers should not place undue reliance
on the Company’s forward-looking statements. As a result of the foregoing and other factors, no assurance can be given as to any such future results,
levels of activity or achievements and neither the Company nor any other person assumes responsibility for the accuracy and completeness of these
forward-looking statements.
NI43-101 QUALIFIED PERSON
George Gorzynski, P.Eng., Vice President, Exploration and a Qualified Person under the meaning of Canadian National Instrument 43-101, is responsible
for the technical information in this presentation.
Cautionary Statement
2
GROWING
ASSETS
CONTINUOUS
EXPLORATION
PRUDENT
MANAGEMENT
IMPACT Silver is a junior silver producer with low cost operations and a growing
portfolio of silver mines in south-central Mexico.
A cornerstone of IMPACT’s success is systematic exploration leading to rapid mine
development to increase mill throughput and generate near-term cash flow.
Focused on creating value by growth primarily through earnings, in the pursuit of
building a multimillion ounce precious metals producer.
Overview
3
Frederick W. Davidson, CA
President, CEO,
Director
President of IMPACT Silver and Energold Drilling Corp. Over 35 years of mining experience
holding various senior positions, including at Erickson Gold Mines Ltd. and Mt. Skukum
Gold Mines.
George Gorzynski, P. Eng
VP Exploration,
Director
Over 30 years of exploration and mining experience; current Director of Tirex Resources,
Defiance Silver and Berkwood Resources.
Richard Younker, CA, CMC CFO
Held the senior financial consulting principal position at Woods Gordon; independent
financial consultant in public and private sectors
H. Walter Sellmer, P. Geo Director
Held senior positions at Amax Exploration, Canamax Resources Inc. and TOTAL Energold
Corp.
Victor Tanaka, P. Geo Director
President and CEO of Bayswater Uranium Corp. Held senior positions at Asamera Inc.,
Freeport McMoRan Gold Corp., Aber Resources, Major General Resources, Fjordland
Exploration and Pathfinder Resources.
Richard Mazur, P. Geo, MBA Director
President and CEO of Forum Uranium Corp. and CEO of Alto Ventures Ltd. Held senior
positions at Canamax Resources and IMPACT Minerals.
Peter Tredger, P. Eng, MBA Director
Former Senior Officer of Thompson Creek Metals Company. Held senior positions at
Glencairn Gold (now B2Gold) and Wheaton River Minerals (now Goldcorp).
Jean-Pierre Bourtin, MBA Director
President of a private equity firm in Connecticut, USA. Former Treasurer of Xerox Corp.,
Latin American and Emerging Markets.
Directors & Management
4
District Location Map
• Nearly 100% owned and operated 623 km² (62,300 ha) mineral exploration package in south-central Mexico
5
• The Royal Mines of Zacualpan is one of the oldest mining districts in the Americas, with over 485 years of
recorded mining history.
• IMPACT bought the Zacualpan assets in 2006 and consolidated ownership of the district for the first time
in its history.
• IMPACT’s exploration work has catalogued over 3,000 old mine and mill workings, forming an invaluable
basis for modern and effective exploration.
Prolific Mining History in Zacualpan District
6
Long Term Goal and Development Plan
To build a profitable, mid-tier, multimillion ounce precious metals producing
company with multiple mines feeding multiple processing centres.
Exploration and Mine Development Process Flowchart
Over 3,000 old
mine workings
and prospects
catalogued in
IMPACT’s ArcGIS
database
RESEARCH
Compile old
mines and
prospects from
historic maps
FIELD WORK
Geological
mapping, surface
and underground
rock sampling
Select and
prioritize
favorable areas
and prospects and
design the drill
program
DRILLING
Drill program
will be results-
driven and
implemented in
phases
Current targets:
• Capire (south)
• Mirasol
• La Condesa
• Santa Efigenia
• El Gigante
MINE
DEVELOPMENT
Mine design,
planning,
permitting and
construction
PRODUCTION
&
CASH FLOW
Pilot operations at
Capire Plant with
plans to expand to
larger scale
production in the
future
• San Ramon
• Noche Buena
• Cuchara-Oscar
• Capire
7
Guadalupe Production
Centre
Zacualpan District
500 TPD
Operating near
capacity
Mill feed from
San Ramon, Noche
Buena & Cuchara-Oscar
Mines
(underground)
Capire Production
Centre
Capire-Mamatla District
200 TPD
Pilot plant with
expansion plans
Mill feed from
Capire Mine
(open-pit)
Two Production Centres
8
San Ramon
Began production in 2008
Epithermal veins
Current primary producing
mine in the Zacualpan
District
Contribution of total
production in Q1 2013: 47%
Noche Buena
Began production in 2010
Epithermal veins in Valle de
Oro subdistrict located in
the Zacualpan District
Contribution of total
production in Q1 2013: 32%
Cuchara-Oscar
Corridor of wide, high-
grade epithermal veins
linking legacy mines within
the Cuchara Mine Complex
in the Zacualpan District
Contribution of total
production in Q1 2013: 13%
Capire (open-pit)
Volcanogenic sulfide
deposit with high-grade
polymetallic mineralization
in the Capire-Mamatla
District
Contribution of total
production in Q1 2013: 0%
(Commissioning new mine)
Four Producing Silver Mines
9
Geology of Epithermal Vein Systems
Silver-rich at top of vein
200 – 1,000+ g/t Ag
Lead and Zinc-rich at
bottom
60 – 150 g/t Ag
Gold-copper at
depths of 300 m+
Metal Zoning in Ore Shoots
Strike Length
150 – 420 m (500 – 1,400 ft)
Metal Level in Producing Mines
Surface – 0 m (0 ft)
150 m (500 ft)
300 m (1,000 ft)
Depth
10
Noche Buena Mine
San Ramon Mine
Valle de Oro area
(Exploration property)
Cuchara-Oscar Mine
Exploration Targets
Zacualpan District
• Mirasol
• La Condesa
• Santa Efigenia
Capire-Mamatla District
• Manto Rico
• Guadalupe
• Aurora II
Valle de Oro Subdistrict
• Carlos Pacheco
• El Gigante
• Huatescosco
Dominican Republic
• Early stage exploration on legacy
claims
IMPACT Silver’s
623 km²/ 62,300 ha
land package*
* Does not include the Dominican Republic claims
• An abundance of attractive exploration targets across the two districts to drive organic
growth and potentially advance into mine development and production.
11
2012 Metal Production
Silver - 85.5%
Lead - 4.2%
Zinc - 6.1%
Gold - 4.2%
Production Summary
Operating Mine
% of Production
Q1 2013
% of Total Production YE
2012
San Ramon 47 41
Noche Buena 32 31
Chivo* 4 16
Gallega* 4 12
Cuchara-Oscar 13
Commenced production in
Q1 2013
Capire Nil
Commenced production in
Q1 2013
Production Highlights Q1 2013 YE 2012 YE 2011
Total Ag production (oz) 165,651 620,515 833,607
Total tonnes milled (t) 42,009 168,826 154,289
Tonnes milled per day 472 463 424
Direct cost per tonne ($) 64.28 64.55 69.71
*Minimal to no supplementary mining from Chivo and Gallega as of Q2 2013
12
Silver-Focused Producer
-5
0
5
10
15
20
25
30
35
2010
2011
2012
Q1 2013
Financial Summary
InCDN$000,000’s
• Revenue and production was lower in 2012 due to decreasing silver grades at depth within the Chivo Mine
and a lower average spot silver price compared to 2011.
• During 2013, production is expected to increase as a result of higher silver grades and increased production
from the new Cuchara-Oscar and Capire Mines.
*Before changes in non-cash working capital
13
All prices in Canadian Dollars Current as of June 5, 2013
Common Shares Issued & Outstanding 68.13M
Fully Diluted 74.84M
Share Price $0.61
52wk Range $0.52 - $1.77
90-Day Average Daily Volume 74,239
Market Capitalization $41.56M
Insider Ownership 3.23%
Options Issued 6.71M
Working Capital $16.81M
Cash $13.34M
Debt Nil
Corporate Summary
14
2013
• 30,000 meter exploration drill program (underway)
• Increase average silver feed grade at the Guadalupe Mill (underway)
• Complete drilling at Mirasol Prospect and determine its potential as next producing
mine (underway)
2014
• Continue drilling on the VMS targets in the Capire district
• Goal of completing graduation to the TSX from the TSX-V
2015
• Consider the location of an additional processing centre in the Zacualpan District
• Define the size of the planned expansion at the Capire Processing Centre and to initiate
construction the larger processing plant
Plans for Growth
15
Contact Us
IMPACT Silver Corp.
TSX-V: IPT Frankfurt: IKL
Telephone 1-604-681-0172
Fax 1-604-681-6813
Email inquiries@impactsilver.com
Investor Relations Meghan Brush
Website www.impactsilver.com
Twitter @IMPACT_Silver
Corporate Address
1100 - 543 Granville Street
Vancouver, BC, Canada V6C 1X8
16
APPENDIX I: Capire NI 43-101 Resource Estimate
February 2011
Metal Content for Capire Mine Ag (oz) Au (oz) Cu (lb) Pb (lbs) Zn (lbs)
Measured 3,529,969 14,146 3,389,275 18,234,678 46,140,820
Indicated 3,694,066 16,300 3,693,733 19,029,800 49,522,173
Measured & Indicated (M&I) 7,224,035 30,446 7,083,007 37,264,478 95,662,993
Inferred 435,959 1,919 475,594 2,260,089 5,823,490
Summary Table of Classified Mineral Resources – Measured & Indicated and Separate Inferred
Zone Classification Tonnes Ag (g/t) Au (g/t) Cu (%) Pb (%) Zn (%)
Capire M&I 3,104,944 46.46 0.19 0.06 0.33 0.93
Aurora 1 M&I 1,807,302 44.50 0.199 0.07 0.36 0.80
Total
M&I 4,912,246 45.74 0.193 0.06 0.34 0.88
Inferred 371,066 36.54 0.161 0.06 0.28 0.71
• Drilling in 2010 showed Capire and Aurora 1 to be one continuous zone, now referred to as Capire
17
APPENDIX II: Capire Drill Highlights
A Selection of Capire Drill Highlights
Drill Hole From (m)
To
(m)
Interval
(m)
Ag (g/t) Au (g/t)
Pb
(%)
Zn
(%)
Cu
(%)
C12-06 78.25 80.30 2.05 507 1.81 2.20 4.02 0.41
including 79.30 80.30 1.00 929 3.27 2.77 5.27 0.63
and 105.70 110.80 5.10 183 0.20 1.05 2.45 0.13
C12-21 83.35 100.10 16.75 153 0.40 1.14 2.71 0.21
including 92.40 97.00 4.60 435 0.71 3.13 5.99 0.48
C12-25 13.20 23.35 10.15 107 0.58 0.90 2.43 0.10
including 13.20 15.25 2.05 315 0.91 2.93 8.19 0.25
• Drill holes listed above were drilled vertically and all intersections are estimated to be close to true width
• See News Release dated October 25, 2012
18
APPENDIX III: Mirasol Drill Highlights
A Selection of Mirasol Drill Highlights
Drill
Hole
Vein Name From (m)
To
(m)
Interval
(m)
Ag (g/t) Au (g/t)
Pb
(%)
Zn
(%)
Z12-71 Mirasol Central 73.9 82.9 8.98 183 0.030 0.07 0.14
including Mirasol Central 75.2 82.4 7.15 216 0.040 0.08 0.16
Z12-79 Mirasol Arriba 4 111.22 113.36 2.14 119 0.014 0.07 0.18
and Mirasol Arriba 3 127.25 128.40 1.15 400 0.034 0.13 0.08
and Mirasol Arriba 1 162.60 164.48 1.88 529 0.283 0.37 1.31
Z12-80 El Deshuesadero 83.45 85.15 1.70 931 0.30 1.03 2.10
Z12-85 Mirasol Arriba 3 114.65 116.00 1.35 792 0.143 0.48 0.16
Z12-86 Mirasol 176.56 177.60 1.04 337 0.023 0.15 0.76
• Discovered in November 2012, located 5.5km from Guadalupe Processing Plant, Zacualpan
• Several high grade silver values discovered, with drill hole Z12-79 encountering seven distinct veins, all of which are contributing
potentially economic silver intersections. See News Releases dated January 28, 2013 and November 26, 2012
19
APPENDIX IV: Cuchara-Oscar Drill Highlights
A Selection of Cuchara-Oscar Drill Highlights
Drill Hole To (m) From (m) Interval (m) Ag (g/t) Au (g/t) Pb (%) Zn (%)
Z11-46 92.10 97.75 5.65 1,007 0.07 0.50 1.1
including 96.70 97.75 1.05 4,580 0.26 1.70 4.0
and 108.95 111.70 2.75 1,128 0.51 0.90 1.4
Z11-55 21.80 22.85 1.05 435 0.01 0.15 0.24
Z11-64 36.60 43.20 6.60 223 0.08 0.18 0.52
Z11-69 0.70 3.35 2.65 408 0.62 0.73 1.12
Z11-74 21.35 22.35 1.00 1,875 0.74 2.65 6.88
Z12-05 92.50 97.60 5.10 234 0.05 0.14 0.49
Z12-08 22.36 45.75 23.39 115 0.02 0.12 0.36
• See News Releases dated October 26, 2011 and April 23, 2012
20
APPENDIX V: Valle de Oro Drill Highlights
A Selection of Carlos Pacheco Drill Highlights
Drill Hole From (m) To (m) Interval (m) Au (g/t) Ag (g/t) Cu (%)
Z08-68 Top of intercept - 85.74 2.90 19.6 68 0.29
including Top of intercept - 85.74 1.0 49.7 59 0.31
Z12-13 192.30 199.00 6.70 3.84 28 0.54
including 192.30 195.05 2.75 8.47 56 1.12
Z12-23 229.85 230.95 1.10 3.82 84 0.54
A Selection of Intermediate Vein Drill Highlights
Drill Hole From (m) To (m) Interval (m) Au (g/t) Ag (g/t) Pb (%) Zn (%)
Z12-16 100.00 114.30 14.30 0.04 82 0.09 0.19
including 100.00 106.50 6.50 0.06 119 0.06 0.14
Z12-18 57.00 59.00 2.00 0.20 337 0.23 0.43
Z12-23 26.10 28.10 2.00 0.22 207 0.10 0.15
• In addition to the gold-copper mineralization in the Carlos Pacheco vein, other drill holes intersected Ag-Pb-Zn mineralization in the Intermediate vein
cluster, located midway between the Carlos Pacheco and Noche Buena veins. See News Releases dated December 4, 2008 and July 11, 2012
21
APPENDIX VI: La Condesa Drill Highlights
A Selection of La Condesa Drill Highlights
Drill Hole To (m) From (m) Interval (m) Ag (g/t) Au (g/t) Pb (%) Zn (%)
Z12-39 167.30 171.00 3.70 312 0.029 0.27 0.90
Z12-42 136.00 139.78 3.78 214 0.269 0.15 0.37
Z12-45 177.90 179.00 1.10 1,655 0.010 0.25 0.08
Z12-46 151.40 154.25 2.85 255 0.111 0.22 0.46
Z12-55 57.80 59.60 1.80 245 0.030 0.12 0.36
Z12-63 106.50 108.85 2.35 231 0.010 0.16 0.26
Z12-64 101.10 105.55 4.45 200 0.035 0.21 0.49
Z12-68 46.40 50.30 3.90 250 0.009 0.07 0.16
• La Condesa accessed through the underground workings of the historic Cuchara Mine, which is also used to access the
Cuchara-Oscar Mine
• Mineralization from La Condesa is planned to augment the production from Cuchara-Oscar
• See News Release dated November 19, 2012
22
23

Corporate Presentation

  • 1.
  • 2.
    Except for historicalinformation, this presentation may contain certain “ forward-looking ” statements and information relating to IMPACT that are based on the beliefs of IMPACT management, as well as assumptions made by and information currently available to IMPACT management. Such statements reflect the current risks, uncertainties and assumptions related to certain factors including but not limited to, exploration and development risks, expenditure and financing requirements, title matters, operating hazards, metal prices, political and economic factors, competitive factors, general economic conditions, relationships with vendors and strategic partners, governmental regulation and supervision, seasonality, technological change, industry practices, and one-time events. Should any one or more risks or uncertainties materialize or change, or should any underlying assumptions prove incorrect, actual results and forward-looking statements may vary materially from those described herein. IMPACT does not assume the obligation to update any forward-looking statement. The factors that could cause actual results to differ materially include, but are not limited to, the following: general economic conditions; changes in financial markets; the impact of exchange rates; political conditions and developments in countries in which the Company operates; changes in the supply, demand and pricing of the metal commodities which the Company mines or hopes to find and successfully mine; changes in regulatory requirements impacting the Company’s operations; the ability to properly and efficiently staff the Company ’ s operations; the sufficiency of current working capital and the estimated cost and availability of funding for the continued exploration and development of the Company’s exploration properties. This list is not exhaustive and these and other factors should be considered carefully, and readers should not place undue reliance on the Company’s forward-looking statements. As a result of the foregoing and other factors, no assurance can be given as to any such future results, levels of activity or achievements and neither the Company nor any other person assumes responsibility for the accuracy and completeness of these forward-looking statements. NI43-101 QUALIFIED PERSON George Gorzynski, P.Eng., Vice President, Exploration and a Qualified Person under the meaning of Canadian National Instrument 43-101, is responsible for the technical information in this presentation. Cautionary Statement 2
  • 3.
    GROWING ASSETS CONTINUOUS EXPLORATION PRUDENT MANAGEMENT IMPACT Silver isa junior silver producer with low cost operations and a growing portfolio of silver mines in south-central Mexico. A cornerstone of IMPACT’s success is systematic exploration leading to rapid mine development to increase mill throughput and generate near-term cash flow. Focused on creating value by growth primarily through earnings, in the pursuit of building a multimillion ounce precious metals producer. Overview 3
  • 4.
    Frederick W. Davidson,CA President, CEO, Director President of IMPACT Silver and Energold Drilling Corp. Over 35 years of mining experience holding various senior positions, including at Erickson Gold Mines Ltd. and Mt. Skukum Gold Mines. George Gorzynski, P. Eng VP Exploration, Director Over 30 years of exploration and mining experience; current Director of Tirex Resources, Defiance Silver and Berkwood Resources. Richard Younker, CA, CMC CFO Held the senior financial consulting principal position at Woods Gordon; independent financial consultant in public and private sectors H. Walter Sellmer, P. Geo Director Held senior positions at Amax Exploration, Canamax Resources Inc. and TOTAL Energold Corp. Victor Tanaka, P. Geo Director President and CEO of Bayswater Uranium Corp. Held senior positions at Asamera Inc., Freeport McMoRan Gold Corp., Aber Resources, Major General Resources, Fjordland Exploration and Pathfinder Resources. Richard Mazur, P. Geo, MBA Director President and CEO of Forum Uranium Corp. and CEO of Alto Ventures Ltd. Held senior positions at Canamax Resources and IMPACT Minerals. Peter Tredger, P. Eng, MBA Director Former Senior Officer of Thompson Creek Metals Company. Held senior positions at Glencairn Gold (now B2Gold) and Wheaton River Minerals (now Goldcorp). Jean-Pierre Bourtin, MBA Director President of a private equity firm in Connecticut, USA. Former Treasurer of Xerox Corp., Latin American and Emerging Markets. Directors & Management 4
  • 5.
    District Location Map •Nearly 100% owned and operated 623 km² (62,300 ha) mineral exploration package in south-central Mexico 5
  • 6.
    • The RoyalMines of Zacualpan is one of the oldest mining districts in the Americas, with over 485 years of recorded mining history. • IMPACT bought the Zacualpan assets in 2006 and consolidated ownership of the district for the first time in its history. • IMPACT’s exploration work has catalogued over 3,000 old mine and mill workings, forming an invaluable basis for modern and effective exploration. Prolific Mining History in Zacualpan District 6
  • 7.
    Long Term Goaland Development Plan To build a profitable, mid-tier, multimillion ounce precious metals producing company with multiple mines feeding multiple processing centres. Exploration and Mine Development Process Flowchart Over 3,000 old mine workings and prospects catalogued in IMPACT’s ArcGIS database RESEARCH Compile old mines and prospects from historic maps FIELD WORK Geological mapping, surface and underground rock sampling Select and prioritize favorable areas and prospects and design the drill program DRILLING Drill program will be results- driven and implemented in phases Current targets: • Capire (south) • Mirasol • La Condesa • Santa Efigenia • El Gigante MINE DEVELOPMENT Mine design, planning, permitting and construction PRODUCTION & CASH FLOW Pilot operations at Capire Plant with plans to expand to larger scale production in the future • San Ramon • Noche Buena • Cuchara-Oscar • Capire 7
  • 8.
    Guadalupe Production Centre Zacualpan District 500TPD Operating near capacity Mill feed from San Ramon, Noche Buena & Cuchara-Oscar Mines (underground) Capire Production Centre Capire-Mamatla District 200 TPD Pilot plant with expansion plans Mill feed from Capire Mine (open-pit) Two Production Centres 8
  • 9.
    San Ramon Began productionin 2008 Epithermal veins Current primary producing mine in the Zacualpan District Contribution of total production in Q1 2013: 47% Noche Buena Began production in 2010 Epithermal veins in Valle de Oro subdistrict located in the Zacualpan District Contribution of total production in Q1 2013: 32% Cuchara-Oscar Corridor of wide, high- grade epithermal veins linking legacy mines within the Cuchara Mine Complex in the Zacualpan District Contribution of total production in Q1 2013: 13% Capire (open-pit) Volcanogenic sulfide deposit with high-grade polymetallic mineralization in the Capire-Mamatla District Contribution of total production in Q1 2013: 0% (Commissioning new mine) Four Producing Silver Mines 9
  • 10.
    Geology of EpithermalVein Systems Silver-rich at top of vein 200 – 1,000+ g/t Ag Lead and Zinc-rich at bottom 60 – 150 g/t Ag Gold-copper at depths of 300 m+ Metal Zoning in Ore Shoots Strike Length 150 – 420 m (500 – 1,400 ft) Metal Level in Producing Mines Surface – 0 m (0 ft) 150 m (500 ft) 300 m (1,000 ft) Depth 10 Noche Buena Mine San Ramon Mine Valle de Oro area (Exploration property) Cuchara-Oscar Mine
  • 11.
    Exploration Targets Zacualpan District •Mirasol • La Condesa • Santa Efigenia Capire-Mamatla District • Manto Rico • Guadalupe • Aurora II Valle de Oro Subdistrict • Carlos Pacheco • El Gigante • Huatescosco Dominican Republic • Early stage exploration on legacy claims IMPACT Silver’s 623 km²/ 62,300 ha land package* * Does not include the Dominican Republic claims • An abundance of attractive exploration targets across the two districts to drive organic growth and potentially advance into mine development and production. 11
  • 12.
    2012 Metal Production Silver- 85.5% Lead - 4.2% Zinc - 6.1% Gold - 4.2% Production Summary Operating Mine % of Production Q1 2013 % of Total Production YE 2012 San Ramon 47 41 Noche Buena 32 31 Chivo* 4 16 Gallega* 4 12 Cuchara-Oscar 13 Commenced production in Q1 2013 Capire Nil Commenced production in Q1 2013 Production Highlights Q1 2013 YE 2012 YE 2011 Total Ag production (oz) 165,651 620,515 833,607 Total tonnes milled (t) 42,009 168,826 154,289 Tonnes milled per day 472 463 424 Direct cost per tonne ($) 64.28 64.55 69.71 *Minimal to no supplementary mining from Chivo and Gallega as of Q2 2013 12 Silver-Focused Producer
  • 13.
    -5 0 5 10 15 20 25 30 35 2010 2011 2012 Q1 2013 Financial Summary InCDN$000,000’s •Revenue and production was lower in 2012 due to decreasing silver grades at depth within the Chivo Mine and a lower average spot silver price compared to 2011. • During 2013, production is expected to increase as a result of higher silver grades and increased production from the new Cuchara-Oscar and Capire Mines. *Before changes in non-cash working capital 13
  • 14.
    All prices inCanadian Dollars Current as of June 5, 2013 Common Shares Issued & Outstanding 68.13M Fully Diluted 74.84M Share Price $0.61 52wk Range $0.52 - $1.77 90-Day Average Daily Volume 74,239 Market Capitalization $41.56M Insider Ownership 3.23% Options Issued 6.71M Working Capital $16.81M Cash $13.34M Debt Nil Corporate Summary 14
  • 15.
    2013 • 30,000 meterexploration drill program (underway) • Increase average silver feed grade at the Guadalupe Mill (underway) • Complete drilling at Mirasol Prospect and determine its potential as next producing mine (underway) 2014 • Continue drilling on the VMS targets in the Capire district • Goal of completing graduation to the TSX from the TSX-V 2015 • Consider the location of an additional processing centre in the Zacualpan District • Define the size of the planned expansion at the Capire Processing Centre and to initiate construction the larger processing plant Plans for Growth 15
  • 16.
    Contact Us IMPACT SilverCorp. TSX-V: IPT Frankfurt: IKL Telephone 1-604-681-0172 Fax 1-604-681-6813 Email inquiries@impactsilver.com Investor Relations Meghan Brush Website www.impactsilver.com Twitter @IMPACT_Silver Corporate Address 1100 - 543 Granville Street Vancouver, BC, Canada V6C 1X8 16
  • 17.
    APPENDIX I: CapireNI 43-101 Resource Estimate February 2011 Metal Content for Capire Mine Ag (oz) Au (oz) Cu (lb) Pb (lbs) Zn (lbs) Measured 3,529,969 14,146 3,389,275 18,234,678 46,140,820 Indicated 3,694,066 16,300 3,693,733 19,029,800 49,522,173 Measured & Indicated (M&I) 7,224,035 30,446 7,083,007 37,264,478 95,662,993 Inferred 435,959 1,919 475,594 2,260,089 5,823,490 Summary Table of Classified Mineral Resources – Measured & Indicated and Separate Inferred Zone Classification Tonnes Ag (g/t) Au (g/t) Cu (%) Pb (%) Zn (%) Capire M&I 3,104,944 46.46 0.19 0.06 0.33 0.93 Aurora 1 M&I 1,807,302 44.50 0.199 0.07 0.36 0.80 Total M&I 4,912,246 45.74 0.193 0.06 0.34 0.88 Inferred 371,066 36.54 0.161 0.06 0.28 0.71 • Drilling in 2010 showed Capire and Aurora 1 to be one continuous zone, now referred to as Capire 17
  • 18.
    APPENDIX II: CapireDrill Highlights A Selection of Capire Drill Highlights Drill Hole From (m) To (m) Interval (m) Ag (g/t) Au (g/t) Pb (%) Zn (%) Cu (%) C12-06 78.25 80.30 2.05 507 1.81 2.20 4.02 0.41 including 79.30 80.30 1.00 929 3.27 2.77 5.27 0.63 and 105.70 110.80 5.10 183 0.20 1.05 2.45 0.13 C12-21 83.35 100.10 16.75 153 0.40 1.14 2.71 0.21 including 92.40 97.00 4.60 435 0.71 3.13 5.99 0.48 C12-25 13.20 23.35 10.15 107 0.58 0.90 2.43 0.10 including 13.20 15.25 2.05 315 0.91 2.93 8.19 0.25 • Drill holes listed above were drilled vertically and all intersections are estimated to be close to true width • See News Release dated October 25, 2012 18
  • 19.
    APPENDIX III: MirasolDrill Highlights A Selection of Mirasol Drill Highlights Drill Hole Vein Name From (m) To (m) Interval (m) Ag (g/t) Au (g/t) Pb (%) Zn (%) Z12-71 Mirasol Central 73.9 82.9 8.98 183 0.030 0.07 0.14 including Mirasol Central 75.2 82.4 7.15 216 0.040 0.08 0.16 Z12-79 Mirasol Arriba 4 111.22 113.36 2.14 119 0.014 0.07 0.18 and Mirasol Arriba 3 127.25 128.40 1.15 400 0.034 0.13 0.08 and Mirasol Arriba 1 162.60 164.48 1.88 529 0.283 0.37 1.31 Z12-80 El Deshuesadero 83.45 85.15 1.70 931 0.30 1.03 2.10 Z12-85 Mirasol Arriba 3 114.65 116.00 1.35 792 0.143 0.48 0.16 Z12-86 Mirasol 176.56 177.60 1.04 337 0.023 0.15 0.76 • Discovered in November 2012, located 5.5km from Guadalupe Processing Plant, Zacualpan • Several high grade silver values discovered, with drill hole Z12-79 encountering seven distinct veins, all of which are contributing potentially economic silver intersections. See News Releases dated January 28, 2013 and November 26, 2012 19
  • 20.
    APPENDIX IV: Cuchara-OscarDrill Highlights A Selection of Cuchara-Oscar Drill Highlights Drill Hole To (m) From (m) Interval (m) Ag (g/t) Au (g/t) Pb (%) Zn (%) Z11-46 92.10 97.75 5.65 1,007 0.07 0.50 1.1 including 96.70 97.75 1.05 4,580 0.26 1.70 4.0 and 108.95 111.70 2.75 1,128 0.51 0.90 1.4 Z11-55 21.80 22.85 1.05 435 0.01 0.15 0.24 Z11-64 36.60 43.20 6.60 223 0.08 0.18 0.52 Z11-69 0.70 3.35 2.65 408 0.62 0.73 1.12 Z11-74 21.35 22.35 1.00 1,875 0.74 2.65 6.88 Z12-05 92.50 97.60 5.10 234 0.05 0.14 0.49 Z12-08 22.36 45.75 23.39 115 0.02 0.12 0.36 • See News Releases dated October 26, 2011 and April 23, 2012 20
  • 21.
    APPENDIX V: Vallede Oro Drill Highlights A Selection of Carlos Pacheco Drill Highlights Drill Hole From (m) To (m) Interval (m) Au (g/t) Ag (g/t) Cu (%) Z08-68 Top of intercept - 85.74 2.90 19.6 68 0.29 including Top of intercept - 85.74 1.0 49.7 59 0.31 Z12-13 192.30 199.00 6.70 3.84 28 0.54 including 192.30 195.05 2.75 8.47 56 1.12 Z12-23 229.85 230.95 1.10 3.82 84 0.54 A Selection of Intermediate Vein Drill Highlights Drill Hole From (m) To (m) Interval (m) Au (g/t) Ag (g/t) Pb (%) Zn (%) Z12-16 100.00 114.30 14.30 0.04 82 0.09 0.19 including 100.00 106.50 6.50 0.06 119 0.06 0.14 Z12-18 57.00 59.00 2.00 0.20 337 0.23 0.43 Z12-23 26.10 28.10 2.00 0.22 207 0.10 0.15 • In addition to the gold-copper mineralization in the Carlos Pacheco vein, other drill holes intersected Ag-Pb-Zn mineralization in the Intermediate vein cluster, located midway between the Carlos Pacheco and Noche Buena veins. See News Releases dated December 4, 2008 and July 11, 2012 21
  • 22.
    APPENDIX VI: LaCondesa Drill Highlights A Selection of La Condesa Drill Highlights Drill Hole To (m) From (m) Interval (m) Ag (g/t) Au (g/t) Pb (%) Zn (%) Z12-39 167.30 171.00 3.70 312 0.029 0.27 0.90 Z12-42 136.00 139.78 3.78 214 0.269 0.15 0.37 Z12-45 177.90 179.00 1.10 1,655 0.010 0.25 0.08 Z12-46 151.40 154.25 2.85 255 0.111 0.22 0.46 Z12-55 57.80 59.60 1.80 245 0.030 0.12 0.36 Z12-63 106.50 108.85 2.35 231 0.010 0.16 0.26 Z12-64 101.10 105.55 4.45 200 0.035 0.21 0.49 Z12-68 46.40 50.30 3.90 250 0.009 0.07 0.16 • La Condesa accessed through the underground workings of the historic Cuchara Mine, which is also used to access the Cuchara-Oscar Mine • Mineralization from La Condesa is planned to augment the production from Cuchara-Oscar • See News Release dated November 19, 2012 22
  • 23.