Invaders around the world in 2018
•
1 like•2,988 views

This document summarizes Space Invader's art installations around the world from 1998 to 2018. It provides details on the number of installations, location references, missing images or locations, point values, and news/map references for installations in over 75 cities worldwide. The majority of installations have been in Paris, with 1375 total. Other locations with many installations include London, Tokyo, Los Angeles, New York, and Hong Kong. In 2018 alone there were installations in Cap Ferret, Bhutan, Los Angeles (twice), Luberon, Clermont-Ferrand, and Paris.

Recommended
More Related Content
Similar to Invaders around the world in 2018
Similar to Invaders around the world in 2018 (20)
More from Prénom RVLEB
More from Prénom RVLEB (20)
Recently uploaded
Recently uploaded (20)
Invaders around the world in 2018
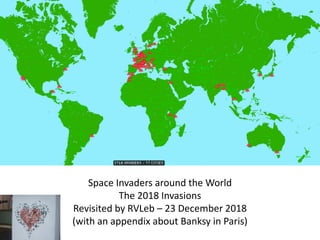
- 1. Space Invaders around the World The 2018 Invasions Revisited by RVLeb – 23 December 2018 (with an appendix about Banksy in Paris)
- 3. My interest for Street Art began with Banksy’s performance in New York in October 2013. I then discovered that Space Invader had invaded Lausanne, Geneva, Bern and Basel in Switzerland. During that period I became aware of beautiful mirror mosaics randomly placed in Pully, near Lausanne. After this initial period, I began to make a virtual trip around the world, looking for Invader’s work online. This is the result of my quest. This document follows a first synthesis made in 2014, a 2nd one in 2017 and a more recent one in January 2018 http://fr.slideshare.net/rvleb/space-invaders-around-the-world https://fr.slideshare.net/rvleb/invaders-around-the-world-as-of-january-2017 https://fr.slideshare.net/rvleb/invaders-around-the-world-in-2017
- 4. New Slideshare and Scribd additions of documents in 2018 http://fr.slideshare.net/rvleb and https://fr.scribd.com/user/24027684/RVLEB
- 7. World invasion by year and places 0 50 100 150 200 250 300 350 1996 1998 1999 2000 2001 2002 2003 2004 2005 2006 2007 2008 2009 2010 2011 2012 2013 2014 2015 2016 2017 2018 Africa Australia Asia America USA Europe France Paris
- 8. Paris invasion by year and arrondissements 0 20 40 60 80 100 120 140 160 1996 1998 1999 2000 2001 2002 2003 2004 2005 2006 2007 2008 2009 2010 2011 2012 2013 2014 2015 2016 2017 2018 Suburb 20 19 18 17 16 15 14 13 12 11 10 9 8 7 6 5 4 3 2 1 Year / Arrdt 1 2 3 4 5 6 7 8 9 10 11 12 13 14 15 16 17 18 19 20 Suburb Total 1996 1 1 1998 17 6 12 15 6 12 3 1 1 5 23 9 20 2 1 1 5 1 6 146 1999 5 2 4 7 7 8 1 4 1 9 7 14 6 1 3 13 7 3 1 103 2000 9 5 2 8 3 3 1 3 3 10 13 6 10 5 6 16 1 3 2 10 2 121 2001 1 1 8 3 1 1 7 4 6 11 3 7 4 2 2 2 4 11 3 81 2002 4 4 5 4 2 5 1 2 1 4 4 1 2 1 3 2 2 7 1 55 2003 2 3 2 2 1 3 1 2 1 5 3 25 2004 2 2 3 2 1 2 4 5 7 2 1 2 4 1 6 2 46 2005 4 1 3 5 2 6 3 2 1 2 2 2 2 1 7 4 2 4 4 3 60 2006 2 4 2 4 1 10 2 3 2 2 9 5 11 6 5 1 69 2007 2 2 2 1 2 5 4 3 1 1 2 5 9 1 40 2008 1 1 1 4 3 2 3 2 1 14 1 3 1 3 8 48 2009 1 2 2 2 3 2 1 1 1 4 2 4 1 2 28 2010 5 2 1 2 1 4 4 4 5 3 2 2 1 4 12 2 54 2011 3 6 13 5 3 3 6 8 16 12 6 5 11 3 9 10 14 3 11 147 2012 2 2 1 1 3 1 2 1 13 2013 1 4 6 1 4 5 4 5 2 1 1 5 4 5 48 2014 2 3 3 1 3 2 1 2 4 5 1 3 2 4 7 43 2015 3 2 3 5 2 1 1 3 4 3 11 4 1 2 4 1 1 4 3 58 2016 6 2 3 5 6 2 2 4 7 6 4 3 4 2 2 5 4 10 77 2017 4 2 3 2 5 3 2 4 7 7 4 2 5 2 3 2 2 3 2 2 8 74 2018 1 1 2 5 1 2 1 1 2 3 3 3 2 1 1 1 1 7 38 Total 74 41 78 73 53 64 25 46 43 81 133 89 107 23 46 49 35 69 60 107 79 1375
- 9. The 2018 invasions And also 1 in Clermont-Ferrand and 38 in Paris CITY DATE #. No image No locationNo Ref. Missing Not Loc. PTS WAVE # NEWS MAP REF CAP FERRET déc-17 10 310 10 CAPF_ BHUTAN janv-18 11 3 490 11 BT_ LOS ANGELES mai-18 29 1170 9 5230 LA_ LUBERON juil-18 8 290 8 LBR_ CLERMONT FERRAND oct-18 1 70 3 40 CLR_ LOS ANGELES nov-18 14 580 10 214 5810 LA_
- 10. The previous slide gives the list of the 2018 Space Invader (SI) invasions. Here is the meaning of each column. CITY: SI has invaded 77 places so far, some such as Cote D’Azur include many towns… #: Number of invasions in city. Ref: The 2 to 4 letter acronym SI uses for the references of the work. PA_1234 is the 1234th invasion in Paris. Sometimes there is a zero such as #LA_047 . No Reference: Number of references in location for which I could not find any image. Ref. missing: The list of references missing for a city. When too many, the ones founded are in-between (). Images missing: Number of images missing in any location (different from previous as some images exist without a ref.) Not located: Place not located in city corresponding Google map. Points: SI give a value in points to each invasion, just like in the video game. This gives the points per city. Waves: SI may have invaded a city multiple times. Each invasion is called a wave. News: SI published newsletters. This gives the newsletter in which the city is mentioned. For example www.space-invaders.com/inl22.html#english Map: SI published maps with some cities. This gives the map number according to SI’s web site.
- 11. CITY DATE #. No image No locationNo Ref. Missing Not Loc. PTS WAVE # NEWS MAP REF PARIS 1998 1375 6 1 6 6 6 36020 on going 1375 1-20 PA_ LONDON juin-99 150 5 9 5 9 9 3630 18 150 21 LDN_ AIX EN PROVENCE 1999 10 160 10 AIX_ ANVERS janv-99 2 20 2 ANVR_ MONTPELLIER août-99 42 9 9 9 9 14 720 2 42 2 MPL_ TOKYO oct-99 33 1 13 19 410 1 3 9 TK_ TOKYO sept-01 42 20 29 2 5 TK_ TOKYO avr-02 3 3 TK_ TOKYO oct-10 10 1440 4 TK_ AMSTERDAM nov-99 26 3 3 5 3 3 330 26 AMS_ GRENOBLE déc-99 57 44 43 46 32 33 570 57 3 GRN_ LOS ANGELES déc-99 41 3 10 670 1 LA_ LOS ANGELES déc-02 24 4 1 480 2 7 LA_ LOS ANGELES déc-03 28 1 480 3 12 LA_ LOS ANGELES avr-04 11 180 4 9 LA_ LOS ANGELES 2005 25 10 10 10 10 10 340 5 LA_ LOS ANGELES 2006-11 42 3 5 3 3 5 1910 6-8 10-12 LA_ NEW YORK févr-00 33 9 2 630 1 3 NY_ NEW YORK juil-03 52 9 1 1060 2 8 11 NY_ NEW YORK déc-07 28 1 1 3 28 NY_ NEW YORK juil-09 7 1 1 4 NY_ NEW YORK nov-13 26 1 1 1530 5 NY_ NEW YORK nov-15 42 2110 6 NY_ NEW YORK mai-16 27 24 27 24 21 27 1310 7 215 NY_ AVIGNON mai-00 41 700 41 5 AVI_ BERN mai-00 29 460 29 4 BRN_ LAUSANNE juil-00 18 3 3 3 270 18 LSN_ GENEVE 2000 33 530 2 33 6 GNV_ PAU 2000 10 1 1 120 10 PAU_ CLERMONT FERRAND 2001 8 90 1 CLR_ CLERMONT FERRAND janv-16 31 1370 2 CLR_ LYON mai-01 48 3 3 3 3 4 640 4 48 7 LY_ HONG KONG sept-01 19 5 1 5 1 2 HK_ HONG KONG 2002 6 2 HK_ HONG KONG 2014-15 74 2 3530 3-5 HK_ ROTTERDAM déc-01 26 4 4 4 4 4 340 2 26 4 8 RTD_
- 12. CITY DATE #. No image No locationNo Ref. Missing Not Loc. PTS WAVE # NEWS MAP REF BERLIN mai-02 12 1 1 1 2 300 2 12 6 BRL_ AUSTRALIA - MELBOURNE juin-02 25 13 13 13 2 5 440 25 7 10 MLB_ AUSTRALIA - PERTH juin-02 26 10 10 10 8 10 400 26 7 10 PRT_ LILLE sept-02 6 100 2 6 6 LIL_ BARCELONE sept-02 17 5 5 5 5 5 290 17 6 BRC_ ISTANBUL sept-03 20 10 11 10 7 12 360 20 8 IST_ DHAKA nov-03 6 1 6 6 200 6 8 DHK_ MANCHESTER juin-04 47 6 5 970 47 9 13 MAN_ NIMES 2004 5 2 2 2 1 1 90 5 NIM_ MARSEILLE juil-04 13 220 3 13 MARS_ BANGKOK juil-05 51 20 20 20 13 13 890 51 13 BGK_ BASTIA oct-05 34 1 2 1 1 2 530 34 14 14 BTA_ MOMBASA janv-06 10 3 7 3 1 7 220 10 15 MBSA_ LJUBLJANA mars-06 20 1 2 340 20 16 LJU_ NEWCASTLE juin-06 25 510 3 25 18 NCL_ VIENNA juin-06 56 4 4 1220 2 56 18-19 15 WN_ COLOGNE févr-07 27 3 670 3 27 22 KLN_ COTE D'AZUR juin-07 40 1 1140 3 40 24 16 (24 CAZ_ BILBAO déc-07 40 1110 2 40 28 17 BBO_ EILAT 2007 2 20 2 ELT_ KATMANDU févr-08 28 14 1 1 14 530 28 29 18 KAT_ VARANASI (BENARES) mars-08 14 3 13 3 1 12 300 14 29 VRN_ RENNES 2009 2 1 1 1 60 2 RN_ MONTAUBAN juin-09 11 230 11 32 MTB_ DAEJEON sept-09 23 3 3 4 4 3 500 23 34 DJN_ CONTIS 2010 2 100 2 CON_ GRUDE 2010 3 1 1 1 1 1 40 3 GRU_ SAN DIEGO juin-10 21 1 4 1 4 700 21 36 SD_ ROMA juil-10 75 1 1 2370 3 75 37-38 19 ROM_ MIAMI nov-10 28 770 1 39 MIA_ MIAMI 2012 57 7 7 7 7 2080 2-3 85 43 23 MIA_ CANCUN 2012 3 80 3 CCU_ SAO PAULO août-11 52 2130 52 41 21 SP_ BRUSSELS avr-12 40 1130 40 42 22 BXL_ BALE juin-13 24 740 24 BSL_ PERPIGNAN juil-13 8 230 8 PRP_
- 13. CITY DATE #. No image No locationNo Ref. Missing Not Loc. PTS WAVE # NEWS MAP REF ANZERE (CH) janv-14 4 110 4 ANZR_ TOKYO mai-14 50 1 1 1390 5-6 138 TK_ RAVENNA oct-14 40 1550 1-2 40 RA_ CHARLEROI juin-14 1 100 1 CHAR_ LA CIOTAT août-14 9 280 1-4 9 LCT_ TANZANIA SAVANNA janv-15 8 1 8 1 1 8 280 8 GRTI_ NOORDWIJK mars-15 10 480 10 NOO_ FRANKFURT avr-15 14 430 14 FKF_ REDU 2015 6 280 6 RDU_ TOULOUSE juil-16 10 330 1 TLS_ FARO août-16 4 110 4 FAO_ NANTES ? 2008 3 1 1 1 1 1 40 3 NA_ MINORQUE ? 2011 5 2 1 1 2 140 5 MEN_ VISBY ? 2005 3 1 1 1 1 1 30 3 VSB_ MARRAKECH févr-17 4 120 4 MRAK_ RABAT mars-17 20 680 20 RBA_ TOULOUSE mars-17 1 30 2 11 TLS_ HONG KONG avr-17 1 30 6 HK_ FORCALQUIER avr.-17 4 100 4 FRQ_ MALAGA mai-17 29 1020 29 MLGA_ VERSAILLES juin-17 22 700 8 22 VRS_ VALMOREL août-17 3 80 3 VMRL_ HALMSTAD ? 2002 2 60 2 HALM_ HONG KONG sept-17 32 1240 7 132 4800 HK_ CAP FERRET déc-17 10 310 10 CAPF_ BHUTAN janv-18 11 3 490 11 BT_ LOS ANGELES mai-18 29 1170 9 5230 LA_ LUBERON juil-18 8 290 8 LBR_ CLERMONT FERRAND oct-18 1 70 3 40 CLR_ LOS ANGELES nov-18 14 580 10 214 5810 LA_ Total 77 cities 3710 201 333 204 151 320 96580 3710
- 14. Location Area 1996 1998 1999 2000 2001 2002 2003 2004 2005 2006 2007 2008 2009 2010 2011 2012 2013 2014 2015 2016 2017 2018 Total PA_ Paris 1 146 103 121 81 55 25 46 60 69 40 48 28 54 147 13 48 43 58 77 74 38 1375 LDN_ Europe 49 6 39 7 25 12 12 150 AIX_ France 10 10 ANVR_ Europe 2 2 MPL_ France 42 42 TK_ Asia 33 42 3 10 50 138 AMS_ Europe 26 26 GRN_ France 57 57 LA_ USA 13 28 24 28 11 19 11 6 5 26 43 214 NY_ USA 33 52 28 7 26 42 27 215 AVI_ France 41 41 BRN_ Europe 29 29 LSN_ Europe 18 18 GNV_ Europe 33 33 PAU_ France 10 10 CLR_ France 8 31 1 40 LY_ France 42 6 48 HK_ Asia 19 13 43 24 33 132 RTD_ Europe 26 26 BRL_ Europe 11 1 12 MLB_ PRT_ Australia 51 51 LIL_ France 6 6 BRC_ Europe 17 17 IST_ Europe 20 20 DHK_ Asia 6 6 MAN_ Europe 47 47 NIM_ France 5 5 MARS_ France 9 2 2 13 BGK_ Asia 51 51 BTA_ France 34 34 MBSA_ Africa 10 10 LJU_ Europe 20 20 NCL_ Europe 25 25 WN_ Europe 52 4 56 KLN_ Europe 24 3 27 CAZ_ France 35 1 4 40 BBO_ Europe 40 40 ELT_ Asia 2 2 KAT_ Asia 28 28 VRN_ Asia 14 14 RN_ France 2 2 MTB_ France 11 11 DJN_ Asia 23 23 CON_ France 2 2 GRU_ Europe 3 3 SD_ USA 21 21 ROM_ Europe 69 6 75 MIA_ USA 28 57 85 CCU_ America 3 3 SP_ America 52 52 BXL_ Europe 40 40 BSL_ Europe 24 24 PRP_ France 8 8 ANZR_ Europe 4 4 RA_ Europe 24 16 40 CHAR_ Europe 1 1 LCT_ France 6 2 1 9 GRTI_ Africa 8 8 NOO_ Europe 10 10 FKF_ Europe 14 14 RDU_ Europe 6 6 TLS_ France 10 1 11 FAO_ Europe 4 4 NA_ France 3 3 MEN_ Europe 5 5 VSB_ Europe 3 3 MRAK_ Africa 4 4 RBA_ Africa 20 20 FRQ_ France 4 4 MLGA_ Europe 29 29 VRS_ France 22 22 VMRL_ France 3 3 HALM_ Europe 2 2 CAPF_ France 10 10 BT_ Asia 11 11 LBR_ France 8 8 Total 1 146 335 313 218 177 140 118 173 226 184 102 96 187 230 119 118 169 185 165 197 111 3710
- 15. Old Slideshare cover pages of documents http://fr.slideshare.net/rvleb