1 1 0 1 0 1 0 0 0 1 0 1 0 0 1 1 1 0 1 0 1 1 0 0 1 1 0 11 1 0 1 0 1 0 0 0 1 0 1 0 0 1 1 1 0 1 0 1 1 0 0 1 1 0 11 1 0 1 0 1 0 0 0 1 0 1 0 0 1 1 1 0 1 0 1 1 0 0 1 1 0 11 1 0 1 0 1 0 0 0 1 0 1 0 0 1 1 1 0 1 0 1 1 0 0 1 1 0 11 1 0 1 0 1 0 0 0 1 0 1 0 0 1 1 1 0 1 0 1 1 0 0 1 1 0 11 1 0 1 0 1 0 0 0 1 0 1 0 0 1 1 1 0 1 0 1 1 0 0 1 1 0 11 1 0 1 0 1 0 0 0 1 0 1 0 0 1 1 1 0 1 0 1 1 0 0 1 1 0 11 1 0 1 0 1 0 0 0 1 0 1 0 0 1 1 1 0 1 0 1 1 0 0 1 1 0 11 1 0 1 0 1 0 0 0 1 0 1 0 0 1 1 1 0 1 0 1 1 0 0 1 1 0 11 1 0 1 0 1 0 0 0 1 0 1 0 0 1 1 1 0 1 0 1 1 0 0 1 1 0 11 1 0 1 0 1 0 0 0 1 0 1 0 0 1 1 1 0 1 0 1 1 0 0 1 1 0 11 1 0 1 0 1 0 0 0 1 0 1 0 0 1 1 1 0 1 0 1 1 0 0 1 1 0 11 1 0 1 0 1 0 0 0 1 0 1 0 0 1 1 1 0 1 0 1 1 0 0 1 1 0 11 1 0 1 0 1 0 0 0 1 0 1 0 0 1 1 1 0 1 0 1 1 0 0 1 1 0 11 1 0 1 0 1 0 0 0 1 0 1 0 0 1 1 1 0 1 0 1 1 0 0 1 1 0 11 1 0 1 0 1 0 0 0 1 0 1 0 0 1 1 1 0 1 0 1 1 0 0 1 1 0 11 1 0 1 0 1 0 0 0 1 0 1 0 0 1 1 1 0 1 0 1 1 0 0 1 1 0 11 1 0 1 0 1 0 0 0 1 0 1 0 0 1 1 1 0 1 0 1 1 0 0 1 1 0 11 1 0 1 0 1 0 0 0 1 0 1 0 0 1 1 1 0 1 0 1 1 0 0 1 1 0 11 1 0 1 0 1 0 0 0 1 0 1 0 0 1 1 1 0 1 0 1 1 0 0 1 1 0 11 1 0 1 0 1 0 0 0 1 0 1 0 0 1 1 1 0 1 0 1 1 0 0 1 1 0 11 1 0 1 0 1 0 0 0 1 0 1 0 0 1 1 1 0 1 0 1 1 0 0 1 1 0 11 1 0 1 0 1 0 0 0 1 0 1 0 0 1 1 1 0 1 0 1 1 0 0 1 1 0 11 1 0 1 0 1 0 0 0 1 0 1 0 0 1 1 1 0 1 0 1 1 0 0 1 1 0 11 1 0 1 0 1 0 0 0 1 0 1 0 0 1 1 1 0 1 0 1 1 0 0 1 1 0 11 1 0 1 0 1 0 0 0 1 0 1 0 0 1 1 1 0 1 0 1 1 0 0 1 1 0 11 1 0 1 0 1 0 0 0 1 0 1 0 0 1 1 1 0 1 0 1 1 0 0 1 1 0 11 1 0 1 0 1 0 0 0 1 0 1 0 0 1 1 1 0 1 0 1 1 0 0 1 1 0 11 1 0 1 0 1 0 0 0 1 0 1 0 0 1 1 1 0 1 0 1 1 0 0 1 1 0 11 1 0 1 0 1 0 0 0 1 0 1 0 0 1 1 1 0 1 0 1 1 0 0 1 1 0 11 1 0 1 0 1 0 0 0 1 0 1 0 0 1 1 1 0 1 0 1 1 0 0 1 1 011 1 0 1 0 1 0 0 0 1 0 1 0 0 1 1 1 0 1 0 1 1 0 0 1 1 0 11 1 0 1 0 1 0 0 0 1 0 1 0 0 1 1 1 0 1 0 1 1 0 0 1 1 0 11 1 0 1 0 1 0 0 0 1 0 1 0 0 1 1 1 0 1 0 1 1 0 0 1 1 0 11 1 0 1 0 1 0 0 0 1 0 1 0 0 1 1 1 0 1 0 1 1 0 0 1 1 0 11 1 0 1 0 1 0 0 0 1 0 1 0 0 1 1 1 0 1 0 1 1 0 0 1 1 0 11 1 0 1 0 1 0 0 0 1 0 1 0 0 1 1 1 0 1 0 1 1 0 0 1 1 0 1 0 0 1 0 1 0 0 1 1 1 0 1 0 1 1 0 0 1 1 0 11 1 0 1 0 1 0 0 0 1 0 1 0 0 1 1 1 0 1 0 1 1 0 0 1 1 0 11 1 0 1 0 1 0 0 0 1 0 1 0 0 1 1 1 0 1 0 1 1 0 0 1 1 0 11 1 0 1 0 1 0 0 0 1 0 1 0 0 1 1 1 0 1 0 1 1 0 0 1 1 0 11 1 0 1 0 1 0 0 0 1 0 1 0 0 1 1 1 0 1 0 1 1 0 0 1 1 0 11 1 0 1 0 1 0 0 0 1 0 1 0 0 1 1 1 0 1 0 1 1 0 0 1 1 0 11 1 0 1 0 1 0 0 0 1 0 1 0 0 1 1 1 0 1 0 1 1 0 0 1 1 0 11 1 0 1 0 1 0 0 0 1 0 1 0 0 1 1 1 0 1 0 1 1 0 0 1 1 0 11 1 0 1 0 1 0 0 0 1 0 1 0 0 1 1 1 0 1 0 1 1 0 0 1 1 0 11 1 0 1 0 1 0 0 0 1 0 1 0 0 1 1 1 0 1 0 1 1 0 0 1 1 0 11 1 0 1 0 1 0 0 0 1 0 1 0 0 1 1 1 0 1 0 1 1 0 0 1 1 0 11 1 0 1 0 1 0 0 0 1 0 1 0 0 1 1 1 0 1 0 1 1 0 0 1 1 0 11 1 0 1 0 1 0 0 0 1 0 1 0 0 1 1 1 0 1 0 1 1 0 0 1 1 0 11 1 0 1 0 1 0 0 0 1 0 1 0 0 1 1 1 0 1 0 1 1 0 0 1 1 0 11 1 0 1 0 1 0 0 0 1 0 1 0 0 1 1 1 0 1 0 1 1 0 0 1 1 0 11 1 0 1 0 1 0 0 0 1 0 1 0 0 1 1 1 0 1 0 1 1 0 0 1 1 0 11 1 0 1 0 1 0 0 0 1 0 1 0 0 1 1 1 0 1 0 1 1 0 0 1 1 0 11 1 0 1 0 1 0 0 0 1 0 1 0 0 1 1 1 0 1 0 10 0 1 0 1 0 0 1 1 1 0 1 0 1 1 0 0 1 1 0 11 1 0 1 0 1 0 0 0 1 0 1 0 0 1 1 1 0 1 0 1 1 0 0 1 1 0 11 1 0 1 0 1 0 0 0 1 0 1 0 0 1 1 1 0 1 0 1 1 0 0 1 1 0 11 1 0 1 0 1 0 0 0 1 0 1 0 0 1 1 1 0 1 0 1 1 0 0 1 1 0 11 1 0 1 0 1 0 0 0 1 0 1 0 0 1 1 1 0 1 0 1 1 0 0 1 1 0 11 1 0 1 0 1 0 0 0 1 0 1 0 0 1 1 1 0 1 0 1 1 0 0 1 1 0 11 1 0 1 0 1 0 0 0 1 0 1 0 0 1 1 1 0 1 0 1 1 0 0 1 1 0 11 1 0 1 0 1 0 0 0 1 0 1 0 0 1 1 1 0 1 0 1 1 0 0 1 1 0 11 1 0 1 0 1 0 0 0 1 0 1 0 0 1 1 1 0 1 0 1 1 0 0 1 1 0 11 1 0 1 0 1 0 0 0 1 0 1 0 0 1 1 1 0 1 0 1 1 0 0 1 1 0 11 1 0 1 0 1 0 0 0 1 0 1 0 0 1 1 1 0 1 0 1 1 0 0 1 1 0 11 1 0 1 0 1 0 0 0 1 0 1 0 0 1 1 1 0 1 0 1 1 0 0 1 1 0 11 1 0 1 0 1 0 0 0 1 0 1 0 0 1 1 1 0 1 0 1 1 0 0 1 1 0 11 1 0 1 0 1 0 0 0 1 0 1 0 0 1 1 1 0 1 0 1 1 0 0 1 1 0 11 1 0 1 0 1 0 0 0 1 0 1 0 0 1 1 1 0 1 0 1 1 0 0 1 1 0 11 1 0 1 0 1 0 0 0 1 0 1 0 0 1 1 1 0 1 0 1 1 0 0 1 1 0 11 1 0 1 0 1 0 0 0 1 0 1 0 0 1 1 1 0 1 0 1 1 0 0 1 1 0 11 1 0 1 0 1 0 0 0 1 0 1 0 0 1 1 1 0 1 0 10 0 1 0 1 0 0 1 1 1 0 1 0 1 1 0 0 1 1 0 11 1 0 1 0 1 0 0 0 1 0 1 0 0 1 1 1 0 1 0 1 1 0 0 1 1 0 11 1 0 1 0 1 0 0 0 1 0 1 0 0 1 1 1 0 1 0 1 1 0 0 1 1 0 11 1 0 1 0 1 0 0 0 1 0 1 0 0 1 1 1 0 1 0 1 1 0 0 1 1 0 11 1 0 1 0 1 0 0 0 1 0 1 0 0 1 1 1 0 1 0 1 1 0 0 1 1 0 11 1 0 1 0 1 0 0 0 1 0 1 0 0 1 1 1 0 1 0 1 1 0 0 1 1 0 11 1 0 1 0 1 0 0 0 1 0 1 0 0 1 1 1 0 1 0 1 1 0 0 1 1 0 11 1 0 1 0 1 0 0 0 1 0 1 0 0 1 1 1 0 1 0 1 1 0 0 1 1 0 11 1 0 1 0 1 0 0 0 1 0 1 0 0 1 1 1 0 1 0 1 1 0 0 1 1 0 11 1 0 1 0 1 0 0 0 1 0 1 0 0 1 1 1 0 1 0 1 1 0 0 1 1 0 11 1 0 1 0 1 0 0 0 1 0 1 0 0 1 1 1 0 1 0 1 1 0 0 1 1 0 11 1 0 1 0 1 0 0 0 1 0 1 0 0 1 1 1 0 1 0 1 1 0 0 1 1 0 11 1 0 1 0 1 0 0 0 1 0 1 0 0 1 1 1 0 1 0 1 1 0 0 1 1 0 11 1 0 1 0 1 0 0 0 1 0 1 0 0 1 1 1 0 1 0 1 1 0 0 1 1 0 11 1 0 1 0 1 0 0 0 1 0 1 0 0 1 1 1 0 1 0 1 1 0 0 1 1 0 11 1 0 1 0 1 0 0 0 1 0 1 0 0 1 1 1 0 1 0 1 1 0 0 1 1 0 11 1 0 1 0 1 0 0 0 1 0 1 0 0 1 1 1 0 1 0 1 1 0 0 1 1 0 11 1 0 1 0 1 0r 0 0 1 0 1 0 0 1 1 1 0 1 0 10 0 1 0 1 0 0 1 1 1 0 1 0 1 1 0 0 1 1 0 11 1 0 1 0 1 0 0 0 1 0 1 0 0 1 1 1 0 1 0 1 1 0 0 1 1 0 11 1 0 1 0 1 0 0 0 1 0 1 0 0 1 1 1 0 1 0 1 1 0 0 1 1 0 11 1 0 1 0 1 0 0 0 1 0 1 0 0 1 1 1 0 1 0 1 1 0 0 1 1 0 11 1 0 1 0 1 0 0 0 1 0 1 0 0 1 1 1 0 1 0 1 1 0 0 1 1 0 11 1 0 1 0 1 0 0 0 1 0 1 0 0 1 1 1 0 1 0 1 1 0 0 1 1 0 11 1 0 1 0 1 0 0 0 1 0 1 0 0 1 1 1 0 1 0 1 1 0 0 1 1 0 11 1 0 1 0 1 0 0 0 1 0 1 0 0 1 1 1 0 1 0 1 1 0 0 1 1 0 11 1 0 1 0 1 0 0 0 1 0 1 0 0 1 1 1 0 1 0 1 1 0 0 1 1 0 11 1 0 1 0 1 0 0 0 1 0 1 0 0 1 1 1 0 1 0 1 1 0 0 1 1 0 11 1 0 1 0 1 0 0 0 1 0 1 0 0 1 1 1 0 1 0 1 1 0 0 1 1 0 11 1 0 1 0 1 0 0 0 1 0 1 0 0 1 1 1 0 1 0 1 1 0 0 1 1 0 11 1 0 1 0 1 0 0 0 1 0 1 0 0 1 1 1 0 1 0 1 1 0 0 1 1 0 11 1 0 1 0 1 0 0 0 1 0 1 0 0 1 1 1 0 1 0 1 1 0 0 1 1 0 11 1 0 1 0 1 0 0 0 1 0 1 0 0 1 1 1 0 1 0 1 1 0 0 1 1 0 11 1 0 1 0 1 0 0 0 1 0 1 0 0 1 1 1 0 1 0 1 1 0 0 1 1 0 11 1 0 1 0 1 0 0 0 1 0 1 0 0 1 1 1 0 1 0 1 1 0 0 1 1 0 11 1 0 1 0 1 0 0 0 1 0 1 0 0 1 1 1 0 1 0 1Introduction to UAE & MENATrading Strategies By Peter BarrTrading Strategy Developer
Peter Barr: ProfileLondon School of Economics Graduate: BSc EconomicsMasters Degree in Computer ScienceEducationDubai:Over six years local/regional trading and investment management experience2007 - 2010: Investment Manager – Daman Investments2004 - 2007: Trading Manager – Nasdaq Dubai Professional ExperienceLondon:Seven years front office experience with three top tier investment banks2002 – 2004: Program Trading - SociétéGénérale1997 - 2000: Program Trading - Credit Suisse1996: Equity Syndication - Morgan Stanley
UAE Trading StrategiesUAE Equity Trend Following Strategy&UAE Equity Trend Following Strategy: Plus+
UAE Equity Trend Following StrategyStrategy Description:In common with other frontier and emerging markets, the UAE equity market tends to exhibit strong price persistency.  Price persistency refers to the tendency for stock prices to continue moving in the direction of established trends.  More specifically, when stock prices begin to rise they tend to continue to rise in the future. Similarly, when stock prices begin to fall they tend to carry on falling.This type of price action can be exploited by using trend following trading strategies.  The UAE Equity Trend Following Strategy utilises an algorithm that objectively identifies stocks that have begun to increase in price and that are likely to continue rising in the future.The strategy is long only and trades a basket of stocks listed on the DFM and ADX.  All performance returns are net of transactions costs and assume dividends are reinvested in the strategy.
UAE Equity Trend Following StrategyPerformance Stats:UAE Equity Trend Following Strategy:	CAGR:	38%	Max Drawdown:	-26%	Sharpe Ratio:	1.45DFM General Index – Buy & Hold:	CAGR:	6%	Max Drawdown:	-85%	Sharpe Ratio:	0.32ADX Index – Buy & Hold:	CAGR:	6%	Max Drawdown:	-66%	Sharpe Ratio:	0.31Performance Notes:During periods of rising prices the UAE Equity Trend Following Strategy captures significant profits.   The strategy sidesteps falling prices during bear markets by moving to cash.
UAE Equity Trend Following Strategy: Plus+Strategy Description:Although the UAE Equity Trend Following Strategy is able to successfully exploit price persistency during bull markets the best it can achieve during bear markets is to protect returns by moving to cash.For example, the adjacent chart plots the DFM General Index versus the corresponding percentage of the UAE Equity Trend Following Strategy in cash.  As highlighted, during periods when the DFM General Index is falling the percentage of the UAE Equity Trend Following Strategy in cash approaches 100%.  During these bear market periods strategy returns are flat to slightly negative.Unfortunately, as is characteristic with frontier and emerging markets, periods of rapid price appreciation tend to be interspersed with periods of significant price decreases.  In the UAE market this has been evidenced over the last 5 years.  During these periods the UAE Equity Trend Following Strategy is unable to generate significant profits.DFM General Index versus Cash Position of UAE Equity Trend Following StrategyFully in CashFully Invested
UAE Equity Trend Following Strategy: Plus+Strategy Description:The UAE Equity Trend Following Strategy: Plus+ seeks to enhance returns by combining the original UAE Equity Trend Following Strategy with a short-term trading strategy on the S&P 500 Index.The UAE Equity Trend Following Strategy: Plus+ utilises the same trend following algorithm as in the original strategy.  However, unlike the original strategy the UAE Equity Trend Following Strategy: Plus+ diverts any unused cash to the short-term S&P 500 Index strategy.The S&P 500 strategy exploits very short-term mean reversion tendencies in the price movements of the index.  Mean reversion is the opposite of trend following.  It refers to the tendency of rising prices to be followed by price decreases and vice versa.By diverting unutilised cash to the S&P 500 strategy positive returns  can be generated during periods when the original strategy would only be able to return flat or negative performance.  The UAE Equity Trend Following: Plus+ strategy  comes in several “flavours” depending on risk appetite and long/short preferences:UAE EquityTrend Following StrategyUAE EquityTrend Following: Plus+S&P 500 IndexMean ReversionStrategyThe UAE Equity Trend Following: Plus+Unleveraged  - Long/ShortLeveraged - Long/ShortUnleveraged - Long OnlyLeveraged  - Long Only
UAE Equity Trend Following Strategy: Plus+Strategy Description:Unleveraged – Long/ShortThis version of the UAE Equity Trend Following Strategy: Plus+ does not employ any leverage.  Both long and short trades are initiated for S&P 500 Index Mean Reversion strategy.All performance returns are net of transactions costs and reinvestment of dividends.		Leverage	Long/Short--------------------------------------------------------------UAE Equity TF	None	Long OnlyS&P 500 MR	None	Long/Short--------------------------------------------------------------Performance Stats:Unleveraged – Long/Short:	CAGR:	57%	Max Drawdown:	-26%	Sharpe Ratio:	1.86
UAE Equity Trend Following Strategy: Plus+Strategy Description:Leveraged – Long/ShortThis version of the UAE Equity Trend Following Strategy: Plus+ employs 2:1 leverage on all trades initiated for the S&P 500 Index Mean Reversion strategy.  No leverage is applied to the capital allocated to the UAE Equity Trend Following strategy.  Both long and short trades are initiated for S&P 500 Index Mean Reversion strategy.All performance returns are net of transactions costs and reinvestment of dividends.		Leverage	Long/Short--------------------------------------------------------------UAE Equity TF	None	Long OnlyS&P 500 MR	2:1	Long/Short--------------------------------------------------------------Performance Stats:Leveraged – Long/Short :	CAGR:	76%	Max Drawdown:	-27%	Sharpe Ratio:	1.92
UAE Equity Trend Following Strategy: Plus+Strategy Description:Unleveraged – Long OnlyThis version of the UAE Equity Trend Following Strategy: Plus+ does not employ any leverage. Only long trades are initiated the for S&P 500 Index Mean Reversion strategy.All performance returns are net of transactions costs and reinvestment of dividends.		Leverage	Long/Short--------------------------------------------------------------UAE Equity TF	None	Long OnlyS&P 500 MR	None	Long Only--------------------------------------------------------------Performance Stats:Unleveraged – Long Only:	CAGR:	49%	Max Drawdown:	-25%	Sharpe Ratio:	1.68
UAE Equity Trend Following Strategy: Plus+Strategy Description:Leveraged – Long OnlyThis version of the UAE Equity Trend Following Strategy: Plus+ employs 2:1 leverage on all trades initiated for the S&P 500 Index Mean Reversion strategy.  No leverage is applied to the capital allocated to the UAE Equity Trend Following strategy. Only long trades are initiated for the S&P 500 Index Mean Reversion strategy.All performance returns are net of transactions costs and reinvestment of dividends.		Leverage	Long/Short--------------------------------------------------------------UAE Equity TF	None	Long OnlyS&P 500 MR	2:1	Long Only--------------------------------------------------------------Performance Stats:Leveraged – Long Only:	CAGR:	59%	Max Drawdown:	-28%	Sharpe Ratio:	1.61
UAE Trading Strategy ComparisonsUAE Trading Strategies Historical Performance ComparisonsGrowth of $100,000 Starting Capital: Jan 2004 – June 2010Notes:1.  The UAE Equity Trend Following Strategy has  outperformed 	the DFM and ADX indexes by over 400% since 20042.  All versions of the UAE Equity Trend Following Strategy: 	Plus+ have significantly outperformed the original UAE 	strategy3.  The UAE Equity Trend Following: Plus+ strategies have been 	able to generate positive returns even during bear markets 	where UAE equities have experienced significant price falls
MENA Trading StrategiesMENA Equity Trend Following Strategy&MENA Equity Trend Following Strategy: Plus+
MENA Equity Trend Following StrategyStrategy Description:Stocks trading on MENA markets, like those in the UAE, tend exhibit a strong tendency to persistent in their current direction.  The MENA Equity Trend Following Strategy applies a similar technique as the UAE Equity Trend Following strategy in order to identify and profit from long, extended trends in price movements.  The strategy trades a basket of stocks listed in Saudi Arabia, Qatar, Kuwait, Bahrain, Oman, UAE, Egypt and Morocco.   Because the strategy trades across a number of markets it is more diversified than the UAE Equity Trend Following Strategy.All returns for this strategy include reinvested dividends and are net of trading costs.Performance Stats:MENA Equity Trend Following Strategy:	CAGR:	31%	Max Drawdown:	-14%	Sharpe Ratio:	2.42
MENA Equity Trend Following Strategy: Plus+Strategy Description:Unleveraged – Long/ShortThis version of the MENA Equity Trend Following Strategy: Plus+  does not employ any leverage.  Both long and short trades are initiated for S&P 500 Index Mean Reversion strategy.All performance returns are net of transactions costs and reinvestment of dividends.		Leverage	Long/Short--------------------------------------------------------------MENA Equity TF	None	Long OnlyS&P 500 MR	None	Long/Short--------------------------------------------------------------Performance Stats:Unleveraged – Long/Short:	CAGR:	46%	Max Drawdown:	-14%	Sharpe Ratio:	2.39
MENA Equity Trend Following Strategy: Plus+Strategy Description:Leveraged – Long/ShortThis version of the MENA Equity Trend Following Strategy: Plus+ employs 2:1 leverage on all trades initiated for the S&P 500 Index Mean Reversion strategy. No leverage is applied to the capital allocated to the MENA Equity Trend Following strategy.  Both long and short trades are initiated for S&P 500 Index Mean Reversion strategy.All performance returns are net of transactions costs and reinvestment of dividends.		Leverage	Long/Short--------------------------------------------------------------MENA Equity TF	None	Long OnlyS&P 500 MR	2:1	Long/Short--------------------------------------------------------------Performance Stats:Leveraged – Long/Short:	CAGR:	63%	Max Drawdown:	-127%	Sharpe Ratio:	2.01
MENA Equity Trend Following Strategy: Plus+Strategy Description:Unleveraged – Long OnlyThis version of the MENA Equity Trend Following Strategy: Plus+ does not employ any leverage .  Only long trades are initiated for S&P 500 Index Mean Reversion strategy.All performance returns are net of transactions costs and assume reinvestment of dividends.		Leverage	Long/Short--------------------------------------------------------------MENA Equity TF	None	Long OnlyS&P 500 MR	None	Long Only--------------------------------------------------------------Performance Stats:Unleveraged – Long Only:	CAGR:	38%	Max Drawdown:	-17%	Sharpe Ratio:	2.06
MENA Equity Trend Following Strategy: Plus+Strategy Description:Leveraged – Long OnlyThis version of the MENA Equity Trend Following Strategy: Plus+ employs 2:1 leverage on all trades initiated for the S&P 500 Index Mean Reversion strategy. No leverage is applied to the capital allocated to the MENA Equity Trend Following strategy. Only long trades are initiated for the S&P 500 Index Mean Reversion strategy.All performance returns are net of transactions costs and reinvestment of dividends		Leverage	Long/Short--------------------------------------------------------------MENA Equity TF	None	Long OnlyS&P 500 MR	2:1	Long Only--------------------------------------------------------------Performance Stats:Leveraged – Long Only:	CAGR:	45%	Max Drawdown:	-28%	Sharpe Ratio:	1.58
MENA Trading Strategy ComparisonsMENA Trading Strategies Historical Performance ComparisonsGrowth of $100,000 Starting Capital: Jan 2004 – June 2010Notes:All MENA Equity Trend Following strategies significantly outperform the DFM and Saudi Tadawul indexesThe MENA Equity Trend Following: Plus+ strategies generate superior returns when compared to the original MENA Equity Trend Following StrategyThe MENA Equity Trend Following: Plus+ strategies are able to generate positive returns across all market environments
Summary: Strategy Performance StatsCAGR*	Max Drawdown	Sharpe RatioTrading Strategies:UAE Equity Trend Following Strategy 	38%	-26%		1.45	UAE Equity Trend Following Strategy: Plus+		1.  Unleveraged – Long/Short	57%	-26%		1.86	2.  Leveraged – Long/Short	76%	-27%		1.92		3.  Unleveraged – Long Only	49%	-25%		1.08	4.  Leveraged – Long Only	59%	-28%		1.61	MENA Equity Trend Following Strategy 	31%	-14%		2.42MENA Equity Trend Following Strategy: Plus+	1.  Unleveraged – Long/Short	46%	-14%		2.39	2.  Leveraged – Long/Short	63%	-27%		2.01	3.  Unleveraged – Long Only	38%	-17%		2.06	4.  Leveraged – Long Only	45%	-28%		1.58Benchmarks:DFM General Index	6%	-85%		0.32ADX Index	6%	-66%		0.31Saudi Tadawul Index	5%	-80%		0.29	* Compound Annual Growth Rate

Introduction To Uae & Mena Trading Strategies By Peter Barr

  • 1.
    1 1 01 0 1 0 0 0 1 0 1 0 0 1 1 1 0 1 0 1 1 0 0 1 1 0 11 1 0 1 0 1 0 0 0 1 0 1 0 0 1 1 1 0 1 0 1 1 0 0 1 1 0 11 1 0 1 0 1 0 0 0 1 0 1 0 0 1 1 1 0 1 0 1 1 0 0 1 1 0 11 1 0 1 0 1 0 0 0 1 0 1 0 0 1 1 1 0 1 0 1 1 0 0 1 1 0 11 1 0 1 0 1 0 0 0 1 0 1 0 0 1 1 1 0 1 0 1 1 0 0 1 1 0 11 1 0 1 0 1 0 0 0 1 0 1 0 0 1 1 1 0 1 0 1 1 0 0 1 1 0 11 1 0 1 0 1 0 0 0 1 0 1 0 0 1 1 1 0 1 0 1 1 0 0 1 1 0 11 1 0 1 0 1 0 0 0 1 0 1 0 0 1 1 1 0 1 0 1 1 0 0 1 1 0 11 1 0 1 0 1 0 0 0 1 0 1 0 0 1 1 1 0 1 0 1 1 0 0 1 1 0 11 1 0 1 0 1 0 0 0 1 0 1 0 0 1 1 1 0 1 0 1 1 0 0 1 1 0 11 1 0 1 0 1 0 0 0 1 0 1 0 0 1 1 1 0 1 0 1 1 0 0 1 1 0 11 1 0 1 0 1 0 0 0 1 0 1 0 0 1 1 1 0 1 0 1 1 0 0 1 1 0 11 1 0 1 0 1 0 0 0 1 0 1 0 0 1 1 1 0 1 0 1 1 0 0 1 1 0 11 1 0 1 0 1 0 0 0 1 0 1 0 0 1 1 1 0 1 0 1 1 0 0 1 1 0 11 1 0 1 0 1 0 0 0 1 0 1 0 0 1 1 1 0 1 0 1 1 0 0 1 1 0 11 1 0 1 0 1 0 0 0 1 0 1 0 0 1 1 1 0 1 0 1 1 0 0 1 1 0 11 1 0 1 0 1 0 0 0 1 0 1 0 0 1 1 1 0 1 0 1 1 0 0 1 1 0 11 1 0 1 0 1 0 0 0 1 0 1 0 0 1 1 1 0 1 0 1 1 0 0 1 1 0 11 1 0 1 0 1 0 0 0 1 0 1 0 0 1 1 1 0 1 0 1 1 0 0 1 1 0 11 1 0 1 0 1 0 0 0 1 0 1 0 0 1 1 1 0 1 0 1 1 0 0 1 1 0 11 1 0 1 0 1 0 0 0 1 0 1 0 0 1 1 1 0 1 0 1 1 0 0 1 1 0 11 1 0 1 0 1 0 0 0 1 0 1 0 0 1 1 1 0 1 0 1 1 0 0 1 1 0 11 1 0 1 0 1 0 0 0 1 0 1 0 0 1 1 1 0 1 0 1 1 0 0 1 1 0 11 1 0 1 0 1 0 0 0 1 0 1 0 0 1 1 1 0 1 0 1 1 0 0 1 1 0 11 1 0 1 0 1 0 0 0 1 0 1 0 0 1 1 1 0 1 0 1 1 0 0 1 1 0 11 1 0 1 0 1 0 0 0 1 0 1 0 0 1 1 1 0 1 0 1 1 0 0 1 1 0 11 1 0 1 0 1 0 0 0 1 0 1 0 0 1 1 1 0 1 0 1 1 0 0 1 1 0 11 1 0 1 0 1 0 0 0 1 0 1 0 0 1 1 1 0 1 0 1 1 0 0 1 1 0 11 1 0 1 0 1 0 0 0 1 0 1 0 0 1 1 1 0 1 0 1 1 0 0 1 1 0 11 1 0 1 0 1 0 0 0 1 0 1 0 0 1 1 1 0 1 0 1 1 0 0 1 1 0 11 1 0 1 0 1 0 0 0 1 0 1 0 0 1 1 1 0 1 0 1 1 0 0 1 1 011 1 0 1 0 1 0 0 0 1 0 1 0 0 1 1 1 0 1 0 1 1 0 0 1 1 0 11 1 0 1 0 1 0 0 0 1 0 1 0 0 1 1 1 0 1 0 1 1 0 0 1 1 0 11 1 0 1 0 1 0 0 0 1 0 1 0 0 1 1 1 0 1 0 1 1 0 0 1 1 0 11 1 0 1 0 1 0 0 0 1 0 1 0 0 1 1 1 0 1 0 1 1 0 0 1 1 0 11 1 0 1 0 1 0 0 0 1 0 1 0 0 1 1 1 0 1 0 1 1 0 0 1 1 0 11 1 0 1 0 1 0 0 0 1 0 1 0 0 1 1 1 0 1 0 1 1 0 0 1 1 0 1 0 0 1 0 1 0 0 1 1 1 0 1 0 1 1 0 0 1 1 0 11 1 0 1 0 1 0 0 0 1 0 1 0 0 1 1 1 0 1 0 1 1 0 0 1 1 0 11 1 0 1 0 1 0 0 0 1 0 1 0 0 1 1 1 0 1 0 1 1 0 0 1 1 0 11 1 0 1 0 1 0 0 0 1 0 1 0 0 1 1 1 0 1 0 1 1 0 0 1 1 0 11 1 0 1 0 1 0 0 0 1 0 1 0 0 1 1 1 0 1 0 1 1 0 0 1 1 0 11 1 0 1 0 1 0 0 0 1 0 1 0 0 1 1 1 0 1 0 1 1 0 0 1 1 0 11 1 0 1 0 1 0 0 0 1 0 1 0 0 1 1 1 0 1 0 1 1 0 0 1 1 0 11 1 0 1 0 1 0 0 0 1 0 1 0 0 1 1 1 0 1 0 1 1 0 0 1 1 0 11 1 0 1 0 1 0 0 0 1 0 1 0 0 1 1 1 0 1 0 1 1 0 0 1 1 0 11 1 0 1 0 1 0 0 0 1 0 1 0 0 1 1 1 0 1 0 1 1 0 0 1 1 0 11 1 0 1 0 1 0 0 0 1 0 1 0 0 1 1 1 0 1 0 1 1 0 0 1 1 0 11 1 0 1 0 1 0 0 0 1 0 1 0 0 1 1 1 0 1 0 1 1 0 0 1 1 0 11 1 0 1 0 1 0 0 0 1 0 1 0 0 1 1 1 0 1 0 1 1 0 0 1 1 0 11 1 0 1 0 1 0 0 0 1 0 1 0 0 1 1 1 0 1 0 1 1 0 0 1 1 0 11 1 0 1 0 1 0 0 0 1 0 1 0 0 1 1 1 0 1 0 1 1 0 0 1 1 0 11 1 0 1 0 1 0 0 0 1 0 1 0 0 1 1 1 0 1 0 1 1 0 0 1 1 0 11 1 0 1 0 1 0 0 0 1 0 1 0 0 1 1 1 0 1 0 1 1 0 0 1 1 0 11 1 0 1 0 1 0 0 0 1 0 1 0 0 1 1 1 0 1 0 10 0 1 0 1 0 0 1 1 1 0 1 0 1 1 0 0 1 1 0 11 1 0 1 0 1 0 0 0 1 0 1 0 0 1 1 1 0 1 0 1 1 0 0 1 1 0 11 1 0 1 0 1 0 0 0 1 0 1 0 0 1 1 1 0 1 0 1 1 0 0 1 1 0 11 1 0 1 0 1 0 0 0 1 0 1 0 0 1 1 1 0 1 0 1 1 0 0 1 1 0 11 1 0 1 0 1 0 0 0 1 0 1 0 0 1 1 1 0 1 0 1 1 0 0 1 1 0 11 1 0 1 0 1 0 0 0 1 0 1 0 0 1 1 1 0 1 0 1 1 0 0 1 1 0 11 1 0 1 0 1 0 0 0 1 0 1 0 0 1 1 1 0 1 0 1 1 0 0 1 1 0 11 1 0 1 0 1 0 0 0 1 0 1 0 0 1 1 1 0 1 0 1 1 0 0 1 1 0 11 1 0 1 0 1 0 0 0 1 0 1 0 0 1 1 1 0 1 0 1 1 0 0 1 1 0 11 1 0 1 0 1 0 0 0 1 0 1 0 0 1 1 1 0 1 0 1 1 0 0 1 1 0 11 1 0 1 0 1 0 0 0 1 0 1 0 0 1 1 1 0 1 0 1 1 0 0 1 1 0 11 1 0 1 0 1 0 0 0 1 0 1 0 0 1 1 1 0 1 0 1 1 0 0 1 1 0 11 1 0 1 0 1 0 0 0 1 0 1 0 0 1 1 1 0 1 0 1 1 0 0 1 1 0 11 1 0 1 0 1 0 0 0 1 0 1 0 0 1 1 1 0 1 0 1 1 0 0 1 1 0 11 1 0 1 0 1 0 0 0 1 0 1 0 0 1 1 1 0 1 0 1 1 0 0 1 1 0 11 1 0 1 0 1 0 0 0 1 0 1 0 0 1 1 1 0 1 0 1 1 0 0 1 1 0 11 1 0 1 0 1 0 0 0 1 0 1 0 0 1 1 1 0 1 0 1 1 0 0 1 1 0 11 1 0 1 0 1 0 0 0 1 0 1 0 0 1 1 1 0 1 0 10 0 1 0 1 0 0 1 1 1 0 1 0 1 1 0 0 1 1 0 11 1 0 1 0 1 0 0 0 1 0 1 0 0 1 1 1 0 1 0 1 1 0 0 1 1 0 11 1 0 1 0 1 0 0 0 1 0 1 0 0 1 1 1 0 1 0 1 1 0 0 1 1 0 11 1 0 1 0 1 0 0 0 1 0 1 0 0 1 1 1 0 1 0 1 1 0 0 1 1 0 11 1 0 1 0 1 0 0 0 1 0 1 0 0 1 1 1 0 1 0 1 1 0 0 1 1 0 11 1 0 1 0 1 0 0 0 1 0 1 0 0 1 1 1 0 1 0 1 1 0 0 1 1 0 11 1 0 1 0 1 0 0 0 1 0 1 0 0 1 1 1 0 1 0 1 1 0 0 1 1 0 11 1 0 1 0 1 0 0 0 1 0 1 0 0 1 1 1 0 1 0 1 1 0 0 1 1 0 11 1 0 1 0 1 0 0 0 1 0 1 0 0 1 1 1 0 1 0 1 1 0 0 1 1 0 11 1 0 1 0 1 0 0 0 1 0 1 0 0 1 1 1 0 1 0 1 1 0 0 1 1 0 11 1 0 1 0 1 0 0 0 1 0 1 0 0 1 1 1 0 1 0 1 1 0 0 1 1 0 11 1 0 1 0 1 0 0 0 1 0 1 0 0 1 1 1 0 1 0 1 1 0 0 1 1 0 11 1 0 1 0 1 0 0 0 1 0 1 0 0 1 1 1 0 1 0 1 1 0 0 1 1 0 11 1 0 1 0 1 0 0 0 1 0 1 0 0 1 1 1 0 1 0 1 1 0 0 1 1 0 11 1 0 1 0 1 0 0 0 1 0 1 0 0 1 1 1 0 1 0 1 1 0 0 1 1 0 11 1 0 1 0 1 0 0 0 1 0 1 0 0 1 1 1 0 1 0 1 1 0 0 1 1 0 11 1 0 1 0 1 0 0 0 1 0 1 0 0 1 1 1 0 1 0 1 1 0 0 1 1 0 11 1 0 1 0 1 0r 0 0 1 0 1 0 0 1 1 1 0 1 0 10 0 1 0 1 0 0 1 1 1 0 1 0 1 1 0 0 1 1 0 11 1 0 1 0 1 0 0 0 1 0 1 0 0 1 1 1 0 1 0 1 1 0 0 1 1 0 11 1 0 1 0 1 0 0 0 1 0 1 0 0 1 1 1 0 1 0 1 1 0 0 1 1 0 11 1 0 1 0 1 0 0 0 1 0 1 0 0 1 1 1 0 1 0 1 1 0 0 1 1 0 11 1 0 1 0 1 0 0 0 1 0 1 0 0 1 1 1 0 1 0 1 1 0 0 1 1 0 11 1 0 1 0 1 0 0 0 1 0 1 0 0 1 1 1 0 1 0 1 1 0 0 1 1 0 11 1 0 1 0 1 0 0 0 1 0 1 0 0 1 1 1 0 1 0 1 1 0 0 1 1 0 11 1 0 1 0 1 0 0 0 1 0 1 0 0 1 1 1 0 1 0 1 1 0 0 1 1 0 11 1 0 1 0 1 0 0 0 1 0 1 0 0 1 1 1 0 1 0 1 1 0 0 1 1 0 11 1 0 1 0 1 0 0 0 1 0 1 0 0 1 1 1 0 1 0 1 1 0 0 1 1 0 11 1 0 1 0 1 0 0 0 1 0 1 0 0 1 1 1 0 1 0 1 1 0 0 1 1 0 11 1 0 1 0 1 0 0 0 1 0 1 0 0 1 1 1 0 1 0 1 1 0 0 1 1 0 11 1 0 1 0 1 0 0 0 1 0 1 0 0 1 1 1 0 1 0 1 1 0 0 1 1 0 11 1 0 1 0 1 0 0 0 1 0 1 0 0 1 1 1 0 1 0 1 1 0 0 1 1 0 11 1 0 1 0 1 0 0 0 1 0 1 0 0 1 1 1 0 1 0 1 1 0 0 1 1 0 11 1 0 1 0 1 0 0 0 1 0 1 0 0 1 1 1 0 1 0 1 1 0 0 1 1 0 11 1 0 1 0 1 0 0 0 1 0 1 0 0 1 1 1 0 1 0 1 1 0 0 1 1 0 11 1 0 1 0 1 0 0 0 1 0 1 0 0 1 1 1 0 1 0 1Introduction to UAE & MENATrading Strategies By Peter BarrTrading Strategy Developer
  • 2.
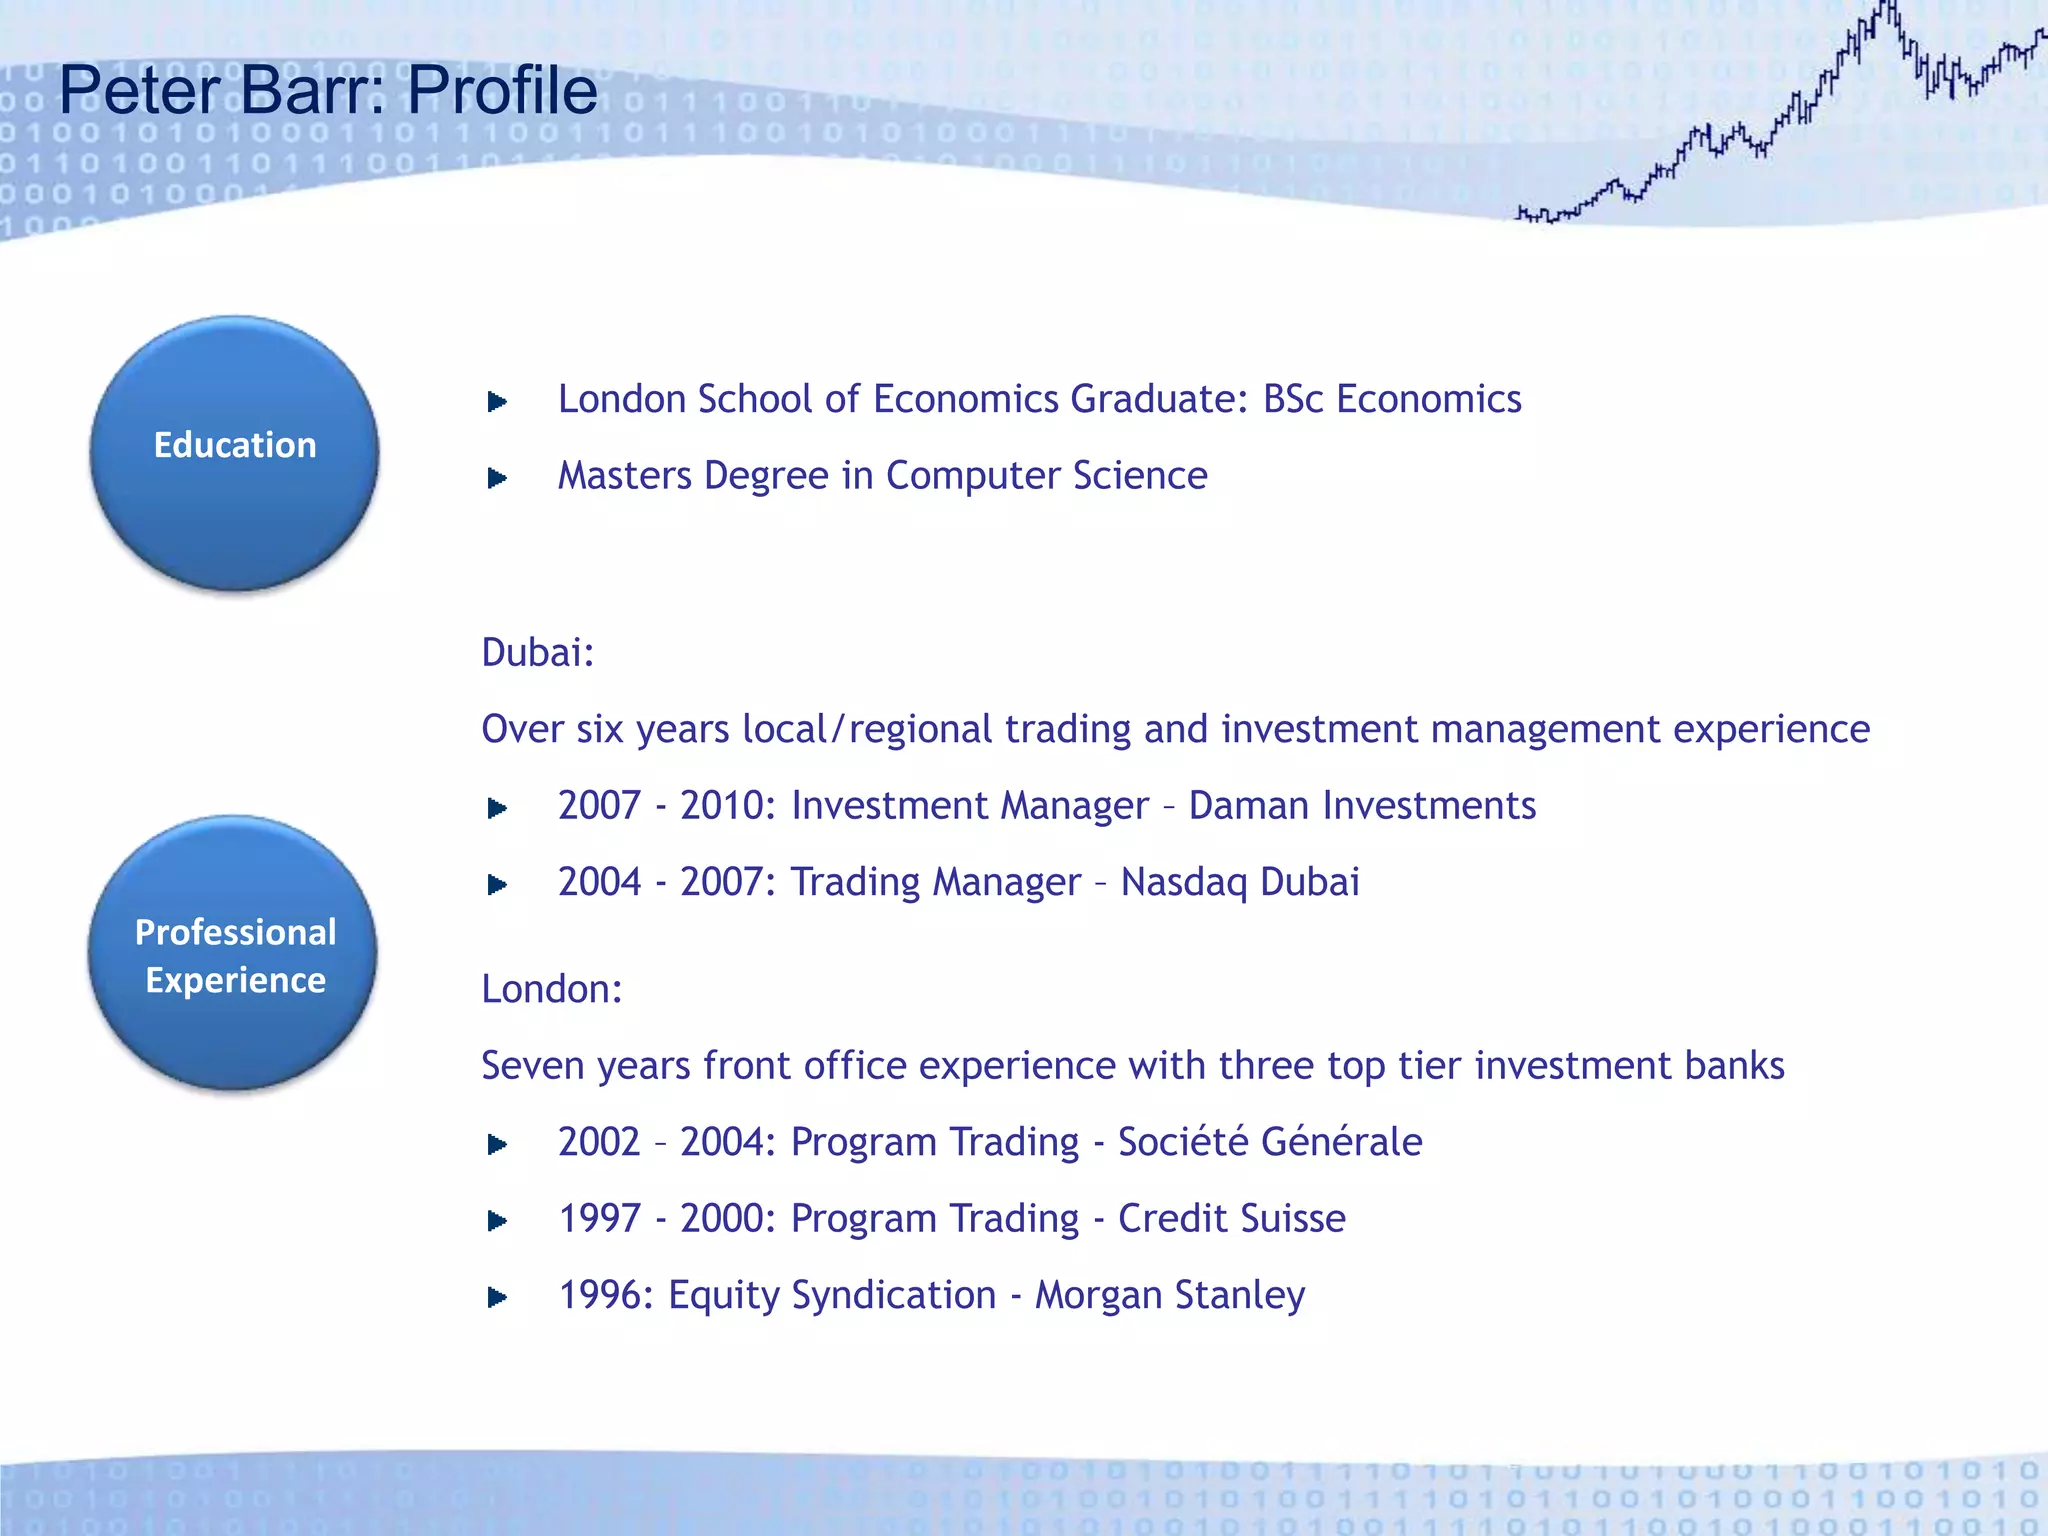
    Peter Barr: ProfileLondonSchool of Economics Graduate: BSc EconomicsMasters Degree in Computer ScienceEducationDubai:Over six years local/regional trading and investment management experience2007 - 2010: Investment Manager – Daman Investments2004 - 2007: Trading Manager – Nasdaq Dubai Professional ExperienceLondon:Seven years front office experience with three top tier investment banks2002 – 2004: Program Trading - SociétéGénérale1997 - 2000: Program Trading - Credit Suisse1996: Equity Syndication - Morgan Stanley
  • 3.
    UAE Trading StrategiesUAEEquity Trend Following Strategy&UAE Equity Trend Following Strategy: Plus+
  • 4.
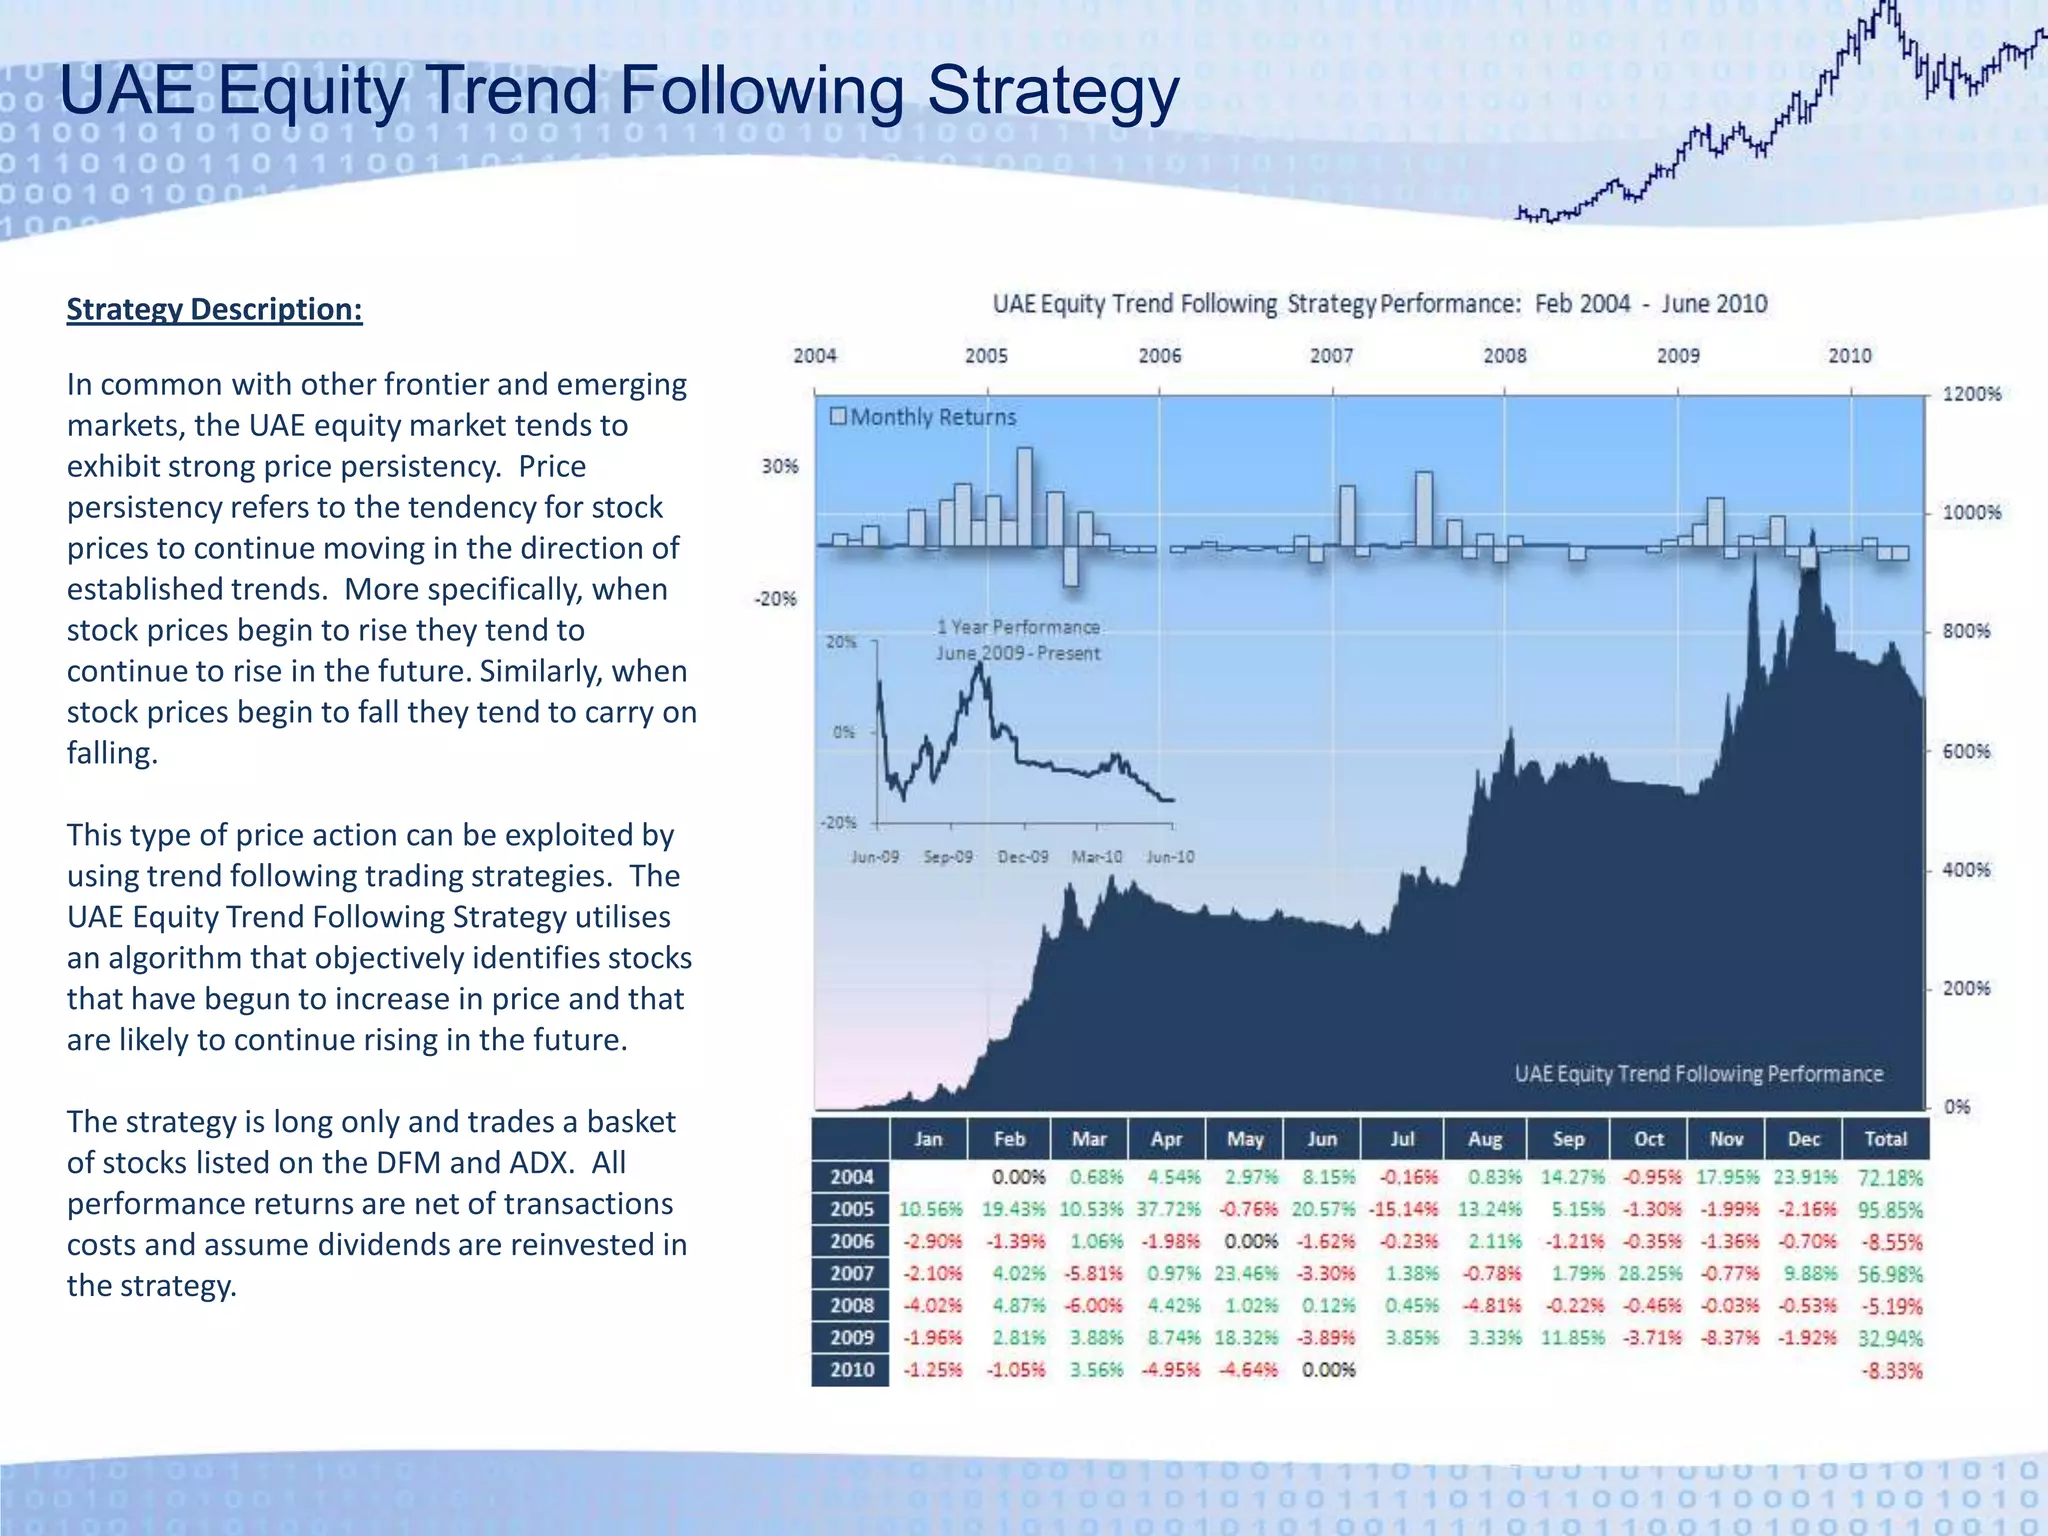
    UAE Equity TrendFollowing StrategyStrategy Description:In common with other frontier and emerging markets, the UAE equity market tends to exhibit strong price persistency. Price persistency refers to the tendency for stock prices to continue moving in the direction of established trends. More specifically, when stock prices begin to rise they tend to continue to rise in the future. Similarly, when stock prices begin to fall they tend to carry on falling.This type of price action can be exploited by using trend following trading strategies. The UAE Equity Trend Following Strategy utilises an algorithm that objectively identifies stocks that have begun to increase in price and that are likely to continue rising in the future.The strategy is long only and trades a basket of stocks listed on the DFM and ADX. All performance returns are net of transactions costs and assume dividends are reinvested in the strategy.
  • 5.
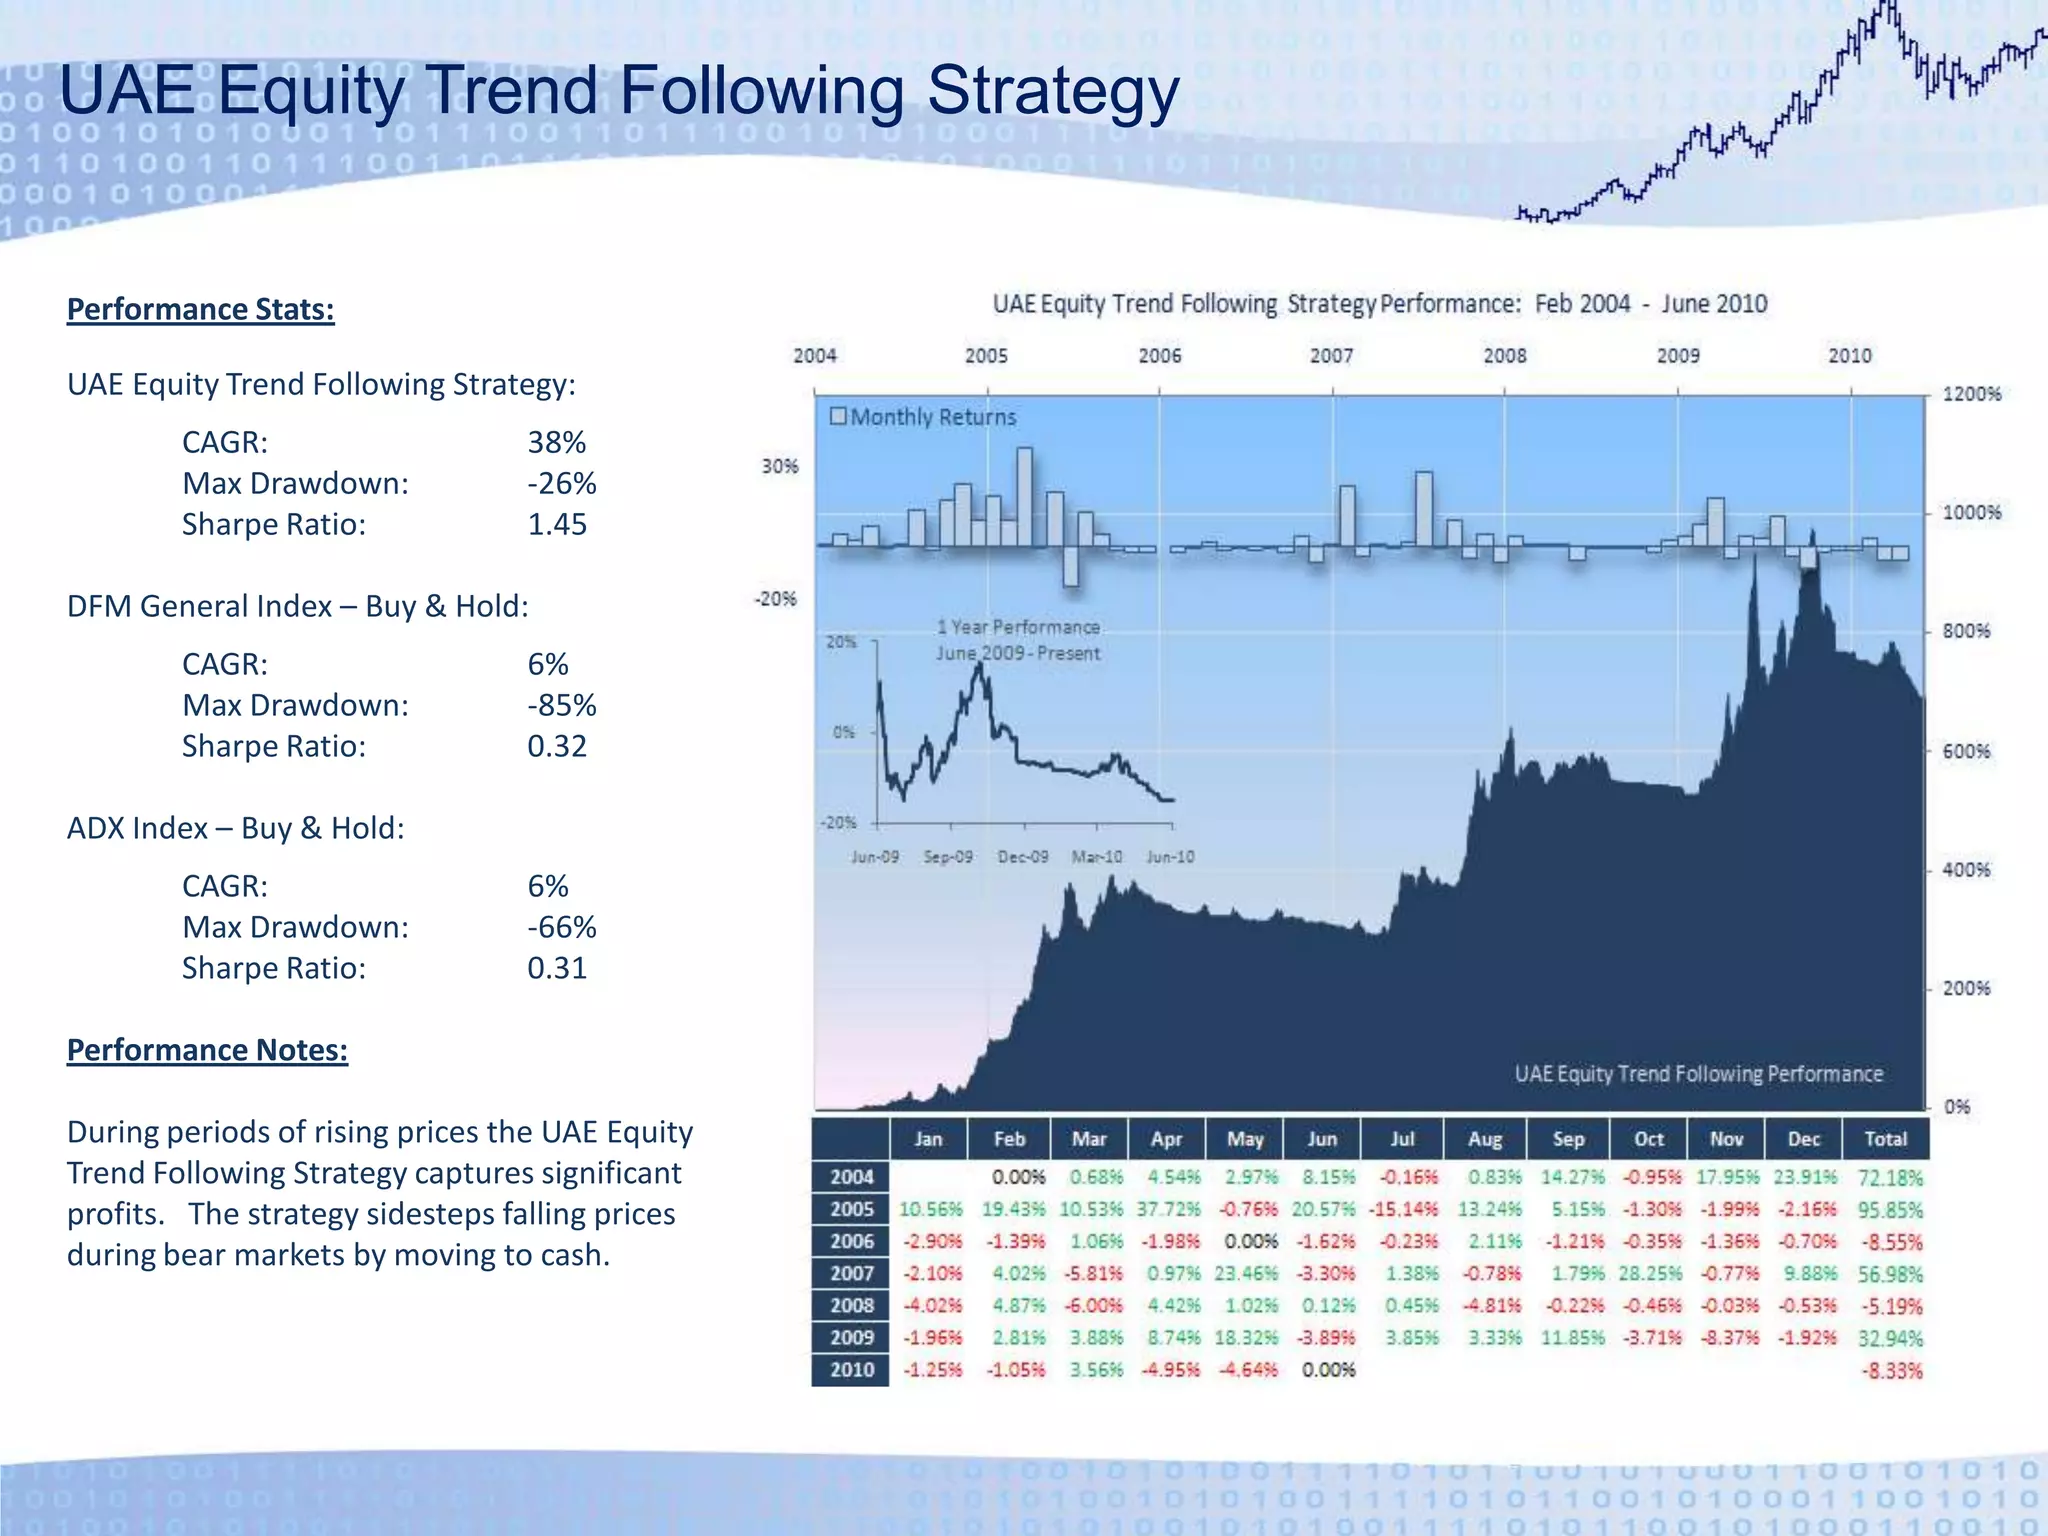
    UAE Equity TrendFollowing StrategyPerformance Stats:UAE Equity Trend Following Strategy: CAGR: 38% Max Drawdown: -26% Sharpe Ratio: 1.45DFM General Index – Buy & Hold: CAGR: 6% Max Drawdown: -85% Sharpe Ratio: 0.32ADX Index – Buy & Hold: CAGR: 6% Max Drawdown: -66% Sharpe Ratio: 0.31Performance Notes:During periods of rising prices the UAE Equity Trend Following Strategy captures significant profits. The strategy sidesteps falling prices during bear markets by moving to cash.
  • 6.
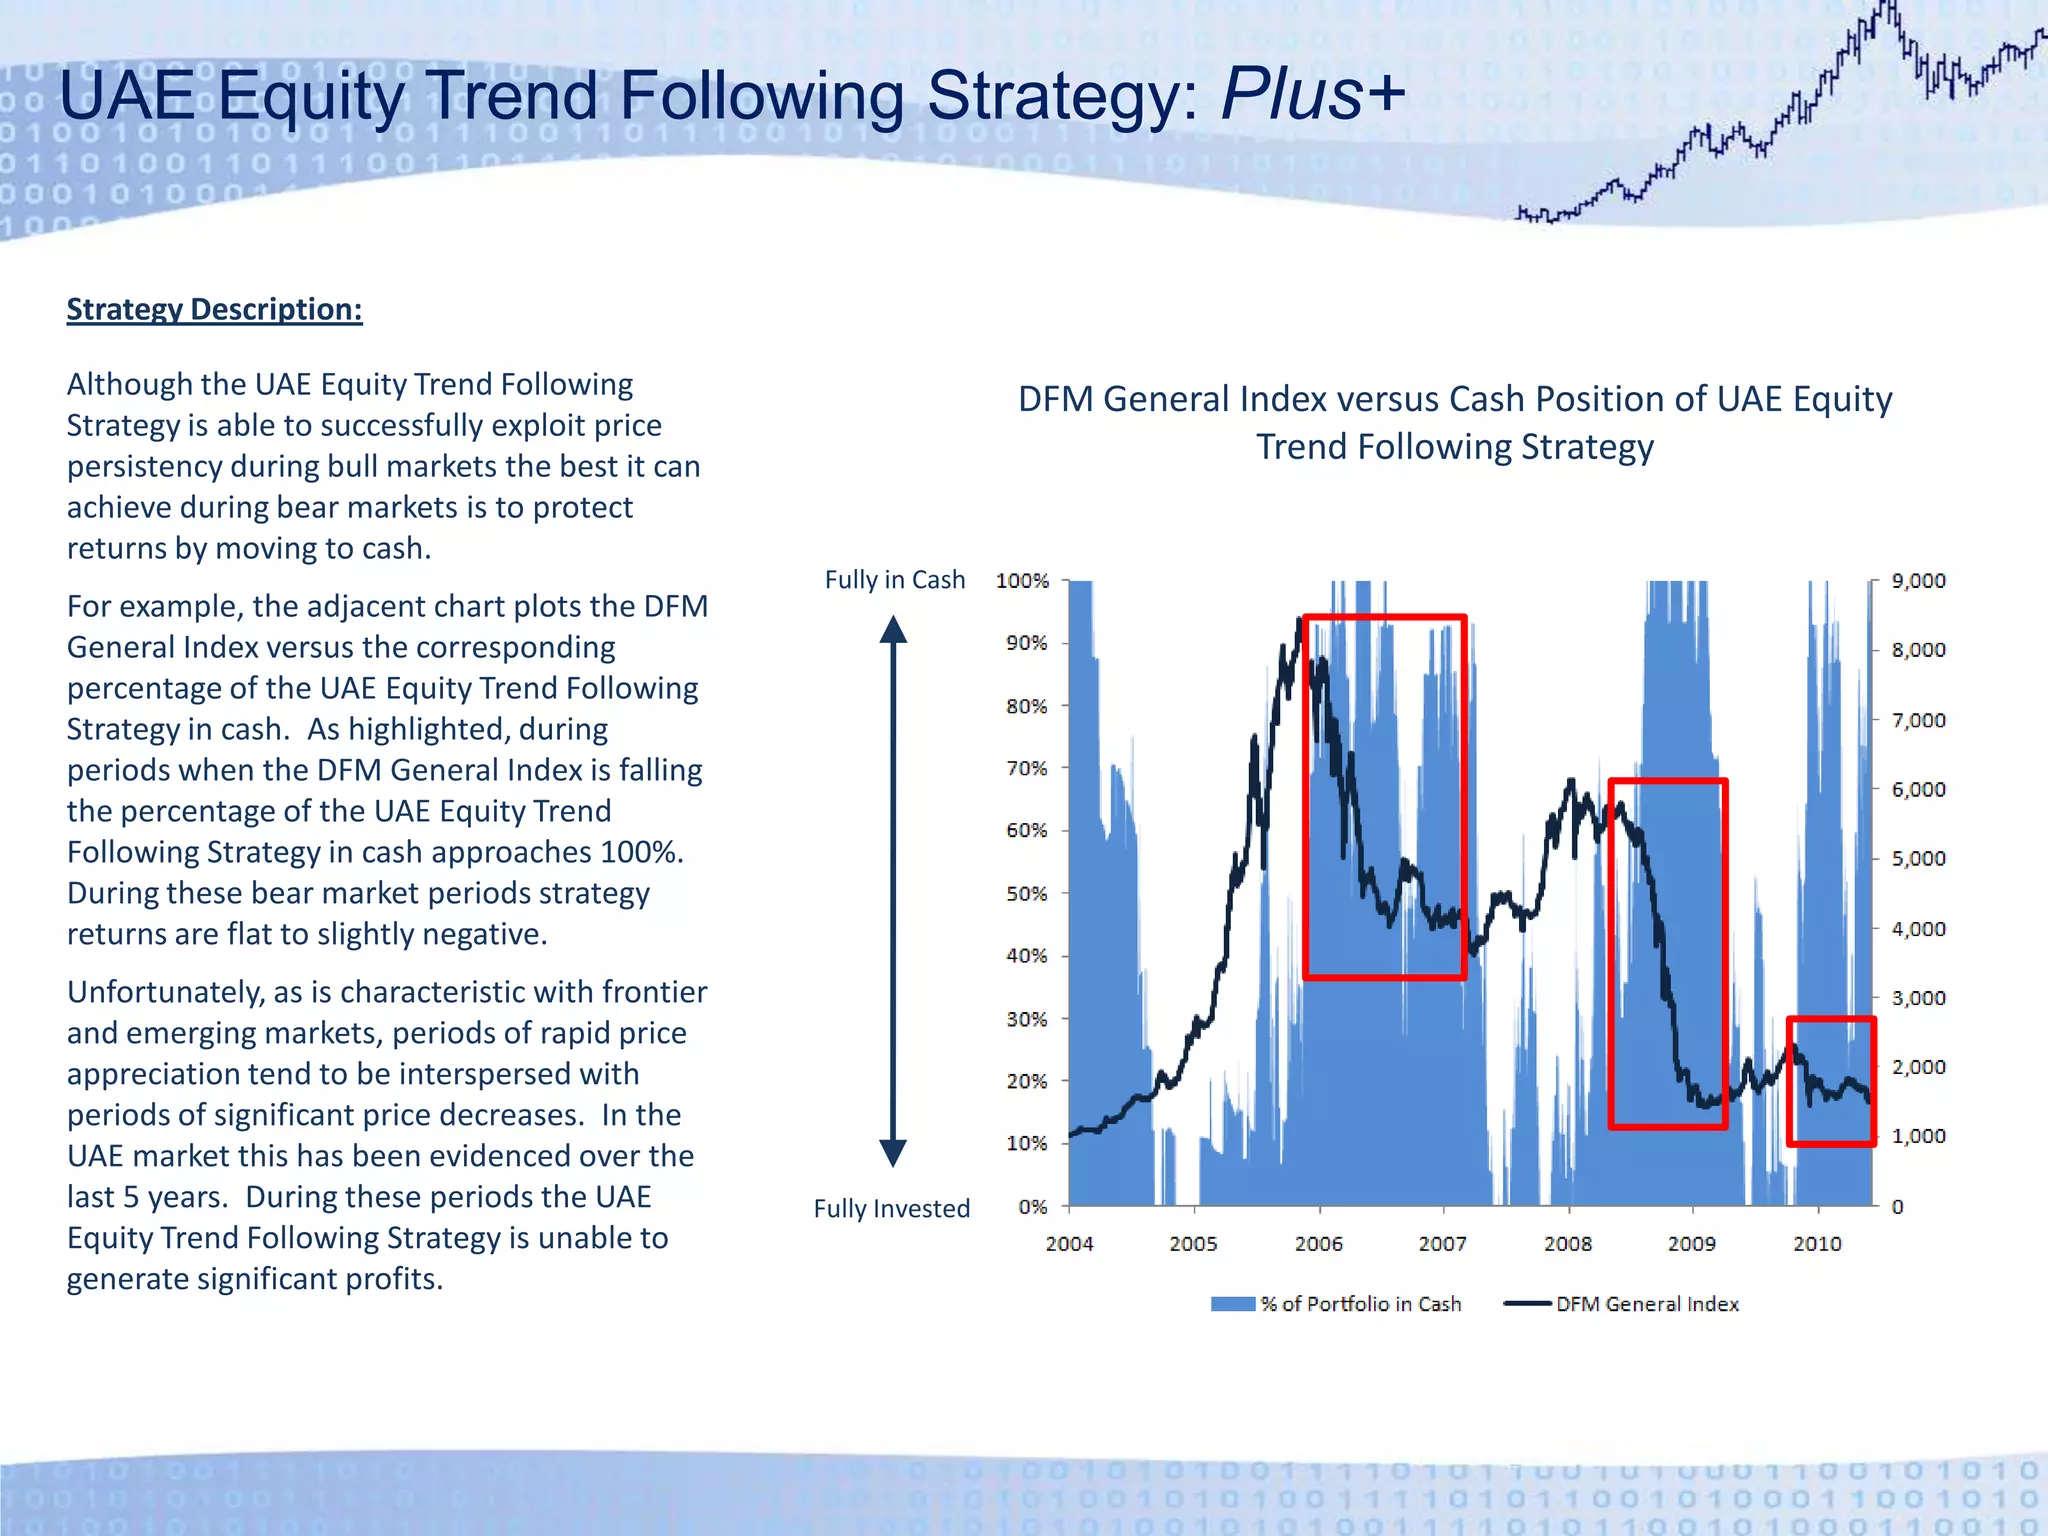
    UAE Equity TrendFollowing Strategy: Plus+Strategy Description:Although the UAE Equity Trend Following Strategy is able to successfully exploit price persistency during bull markets the best it can achieve during bear markets is to protect returns by moving to cash.For example, the adjacent chart plots the DFM General Index versus the corresponding percentage of the UAE Equity Trend Following Strategy in cash. As highlighted, during periods when the DFM General Index is falling the percentage of the UAE Equity Trend Following Strategy in cash approaches 100%. During these bear market periods strategy returns are flat to slightly negative.Unfortunately, as is characteristic with frontier and emerging markets, periods of rapid price appreciation tend to be interspersed with periods of significant price decreases. In the UAE market this has been evidenced over the last 5 years. During these periods the UAE Equity Trend Following Strategy is unable to generate significant profits.DFM General Index versus Cash Position of UAE Equity Trend Following StrategyFully in CashFully Invested
  • 7.
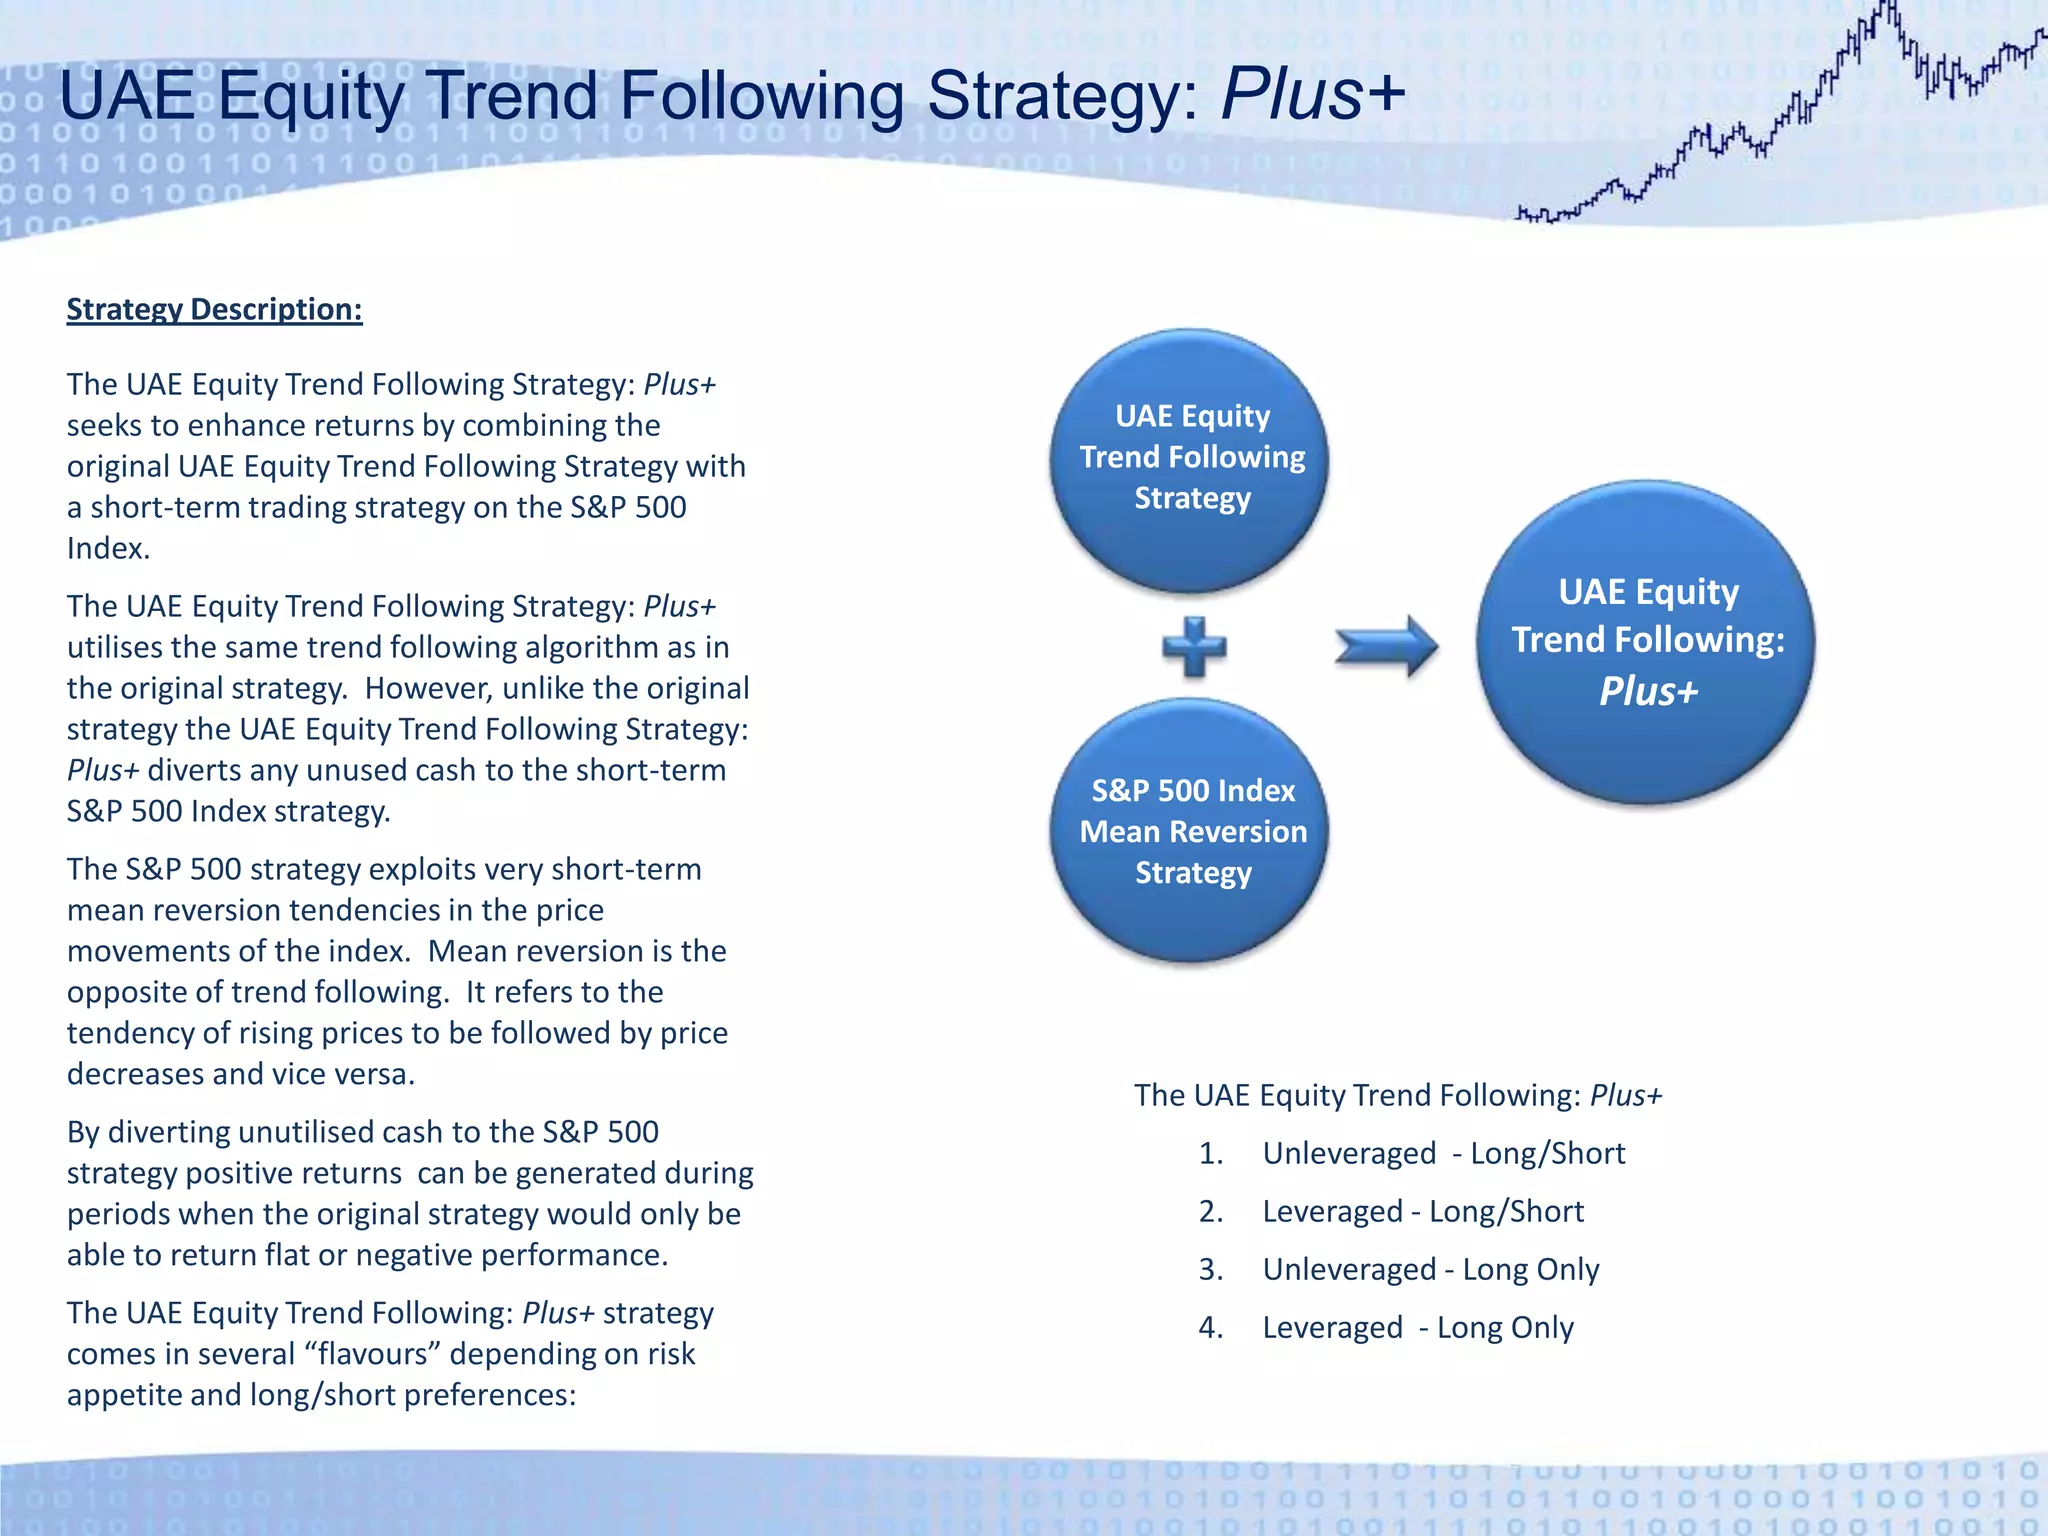
    UAE Equity TrendFollowing Strategy: Plus+Strategy Description:The UAE Equity Trend Following Strategy: Plus+ seeks to enhance returns by combining the original UAE Equity Trend Following Strategy with a short-term trading strategy on the S&P 500 Index.The UAE Equity Trend Following Strategy: Plus+ utilises the same trend following algorithm as in the original strategy. However, unlike the original strategy the UAE Equity Trend Following Strategy: Plus+ diverts any unused cash to the short-term S&P 500 Index strategy.The S&P 500 strategy exploits very short-term mean reversion tendencies in the price movements of the index. Mean reversion is the opposite of trend following. It refers to the tendency of rising prices to be followed by price decreases and vice versa.By diverting unutilised cash to the S&P 500 strategy positive returns can be generated during periods when the original strategy would only be able to return flat or negative performance. The UAE Equity Trend Following: Plus+ strategy comes in several “flavours” depending on risk appetite and long/short preferences:UAE EquityTrend Following StrategyUAE EquityTrend Following: Plus+S&P 500 IndexMean ReversionStrategyThe UAE Equity Trend Following: Plus+Unleveraged - Long/ShortLeveraged - Long/ShortUnleveraged - Long OnlyLeveraged - Long Only
  • 8.
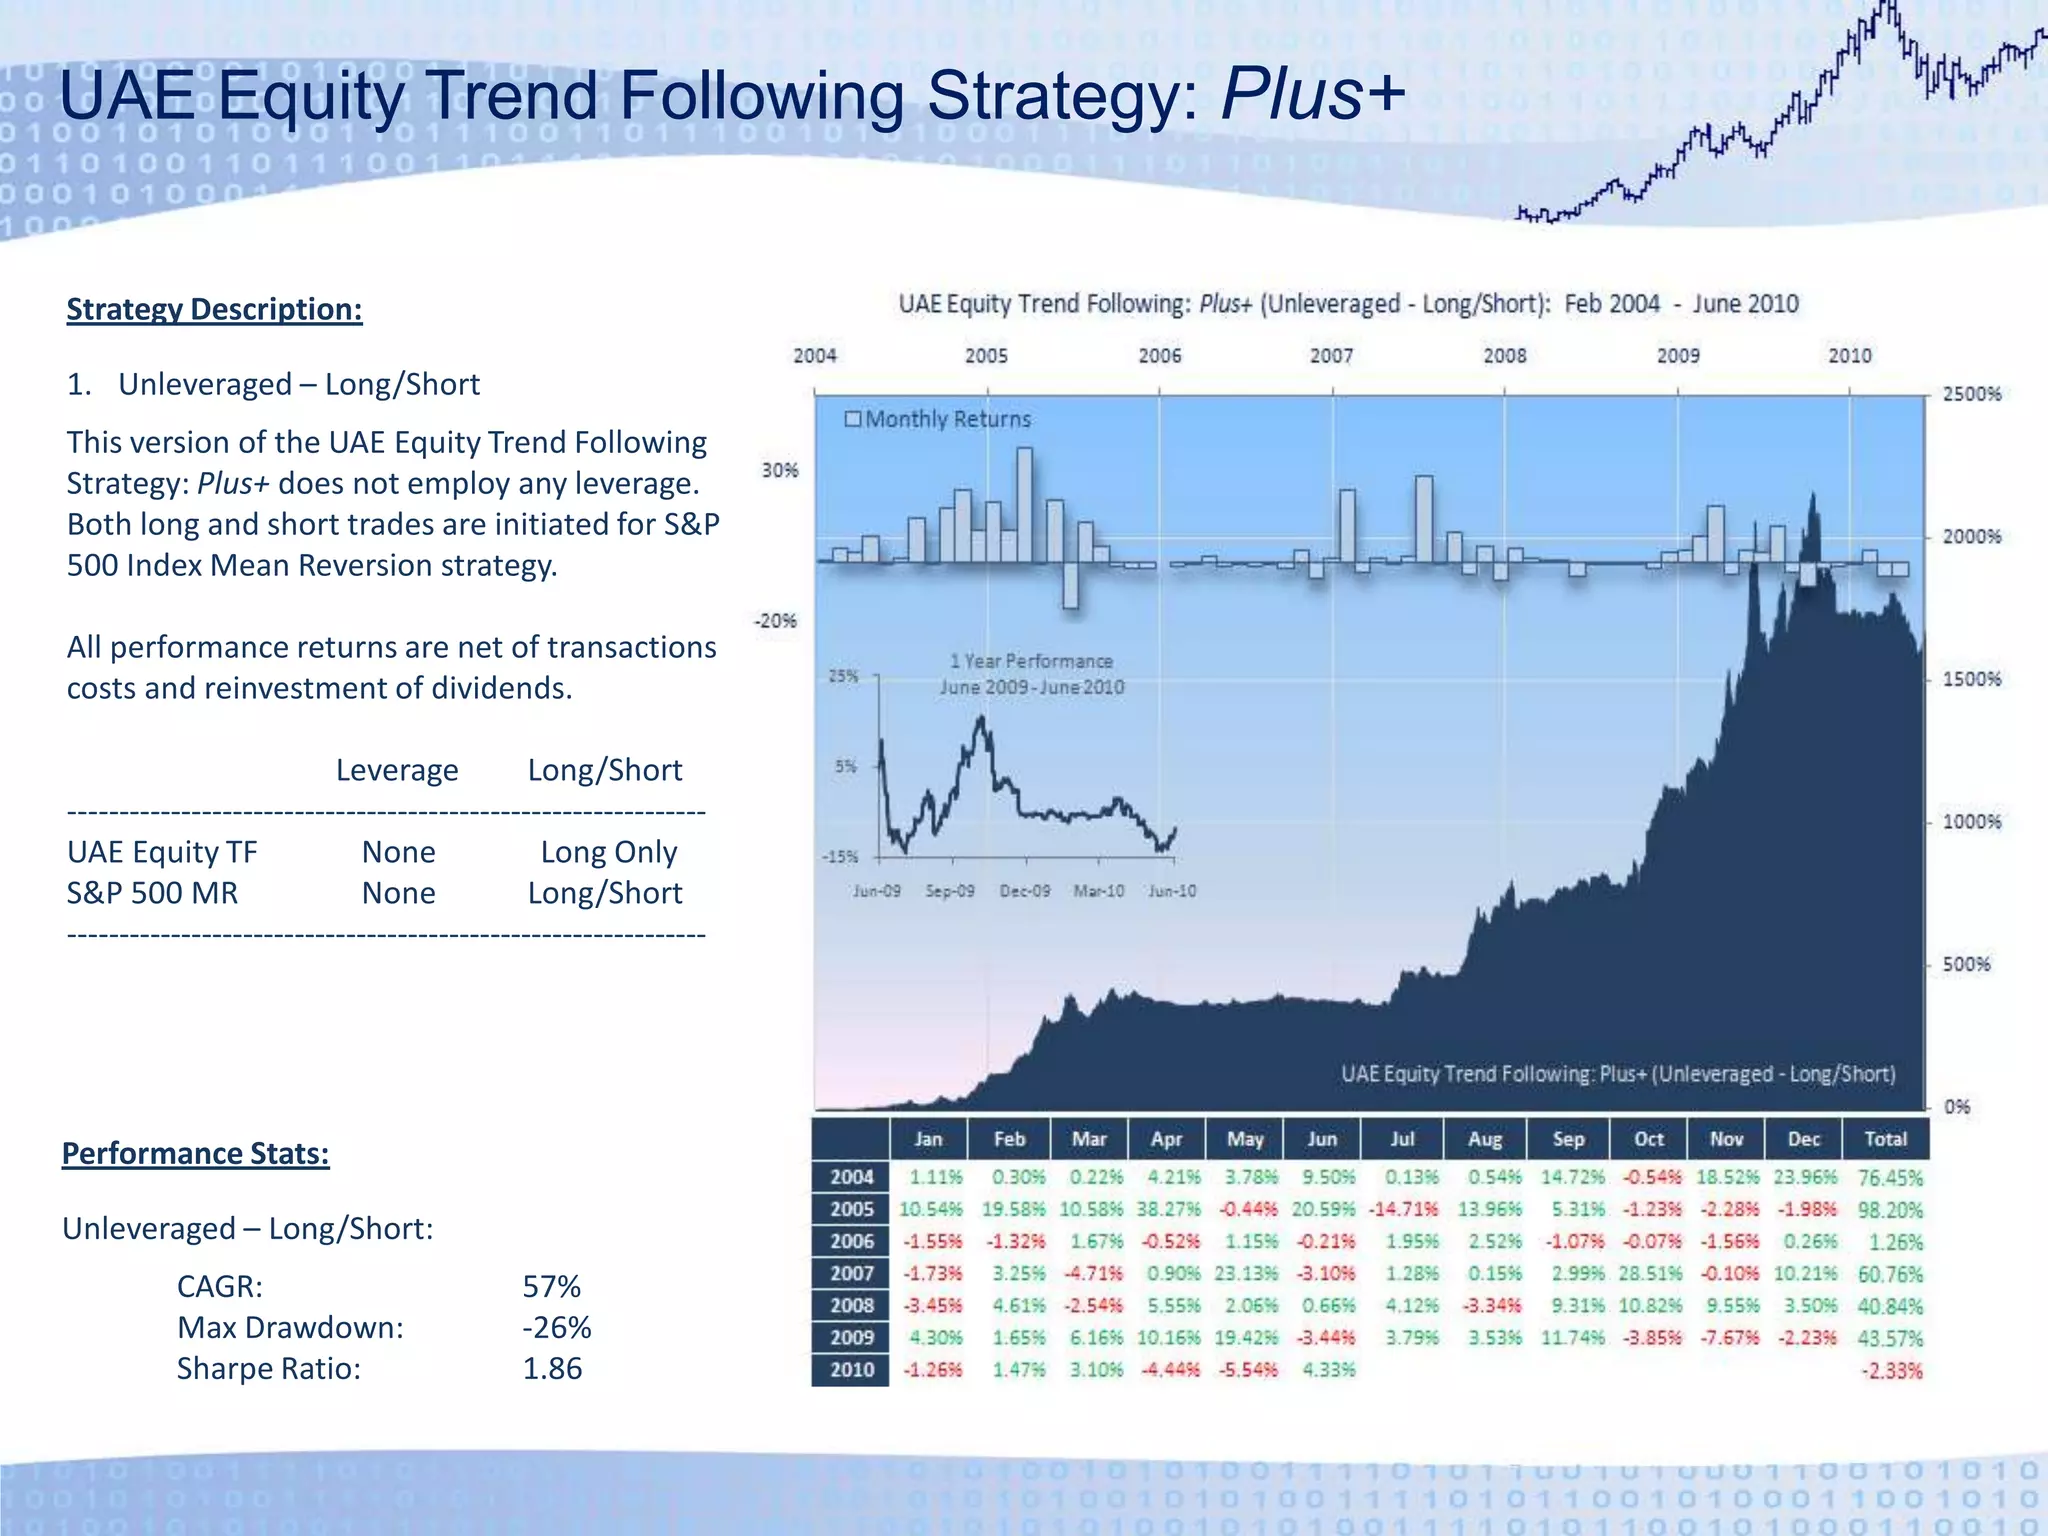
    UAE Equity TrendFollowing Strategy: Plus+Strategy Description:Unleveraged – Long/ShortThis version of the UAE Equity Trend Following Strategy: Plus+ does not employ any leverage. Both long and short trades are initiated for S&P 500 Index Mean Reversion strategy.All performance returns are net of transactions costs and reinvestment of dividends. Leverage Long/Short--------------------------------------------------------------UAE Equity TF None Long OnlyS&P 500 MR None Long/Short--------------------------------------------------------------Performance Stats:Unleveraged – Long/Short: CAGR: 57% Max Drawdown: -26% Sharpe Ratio: 1.86
  • 9.
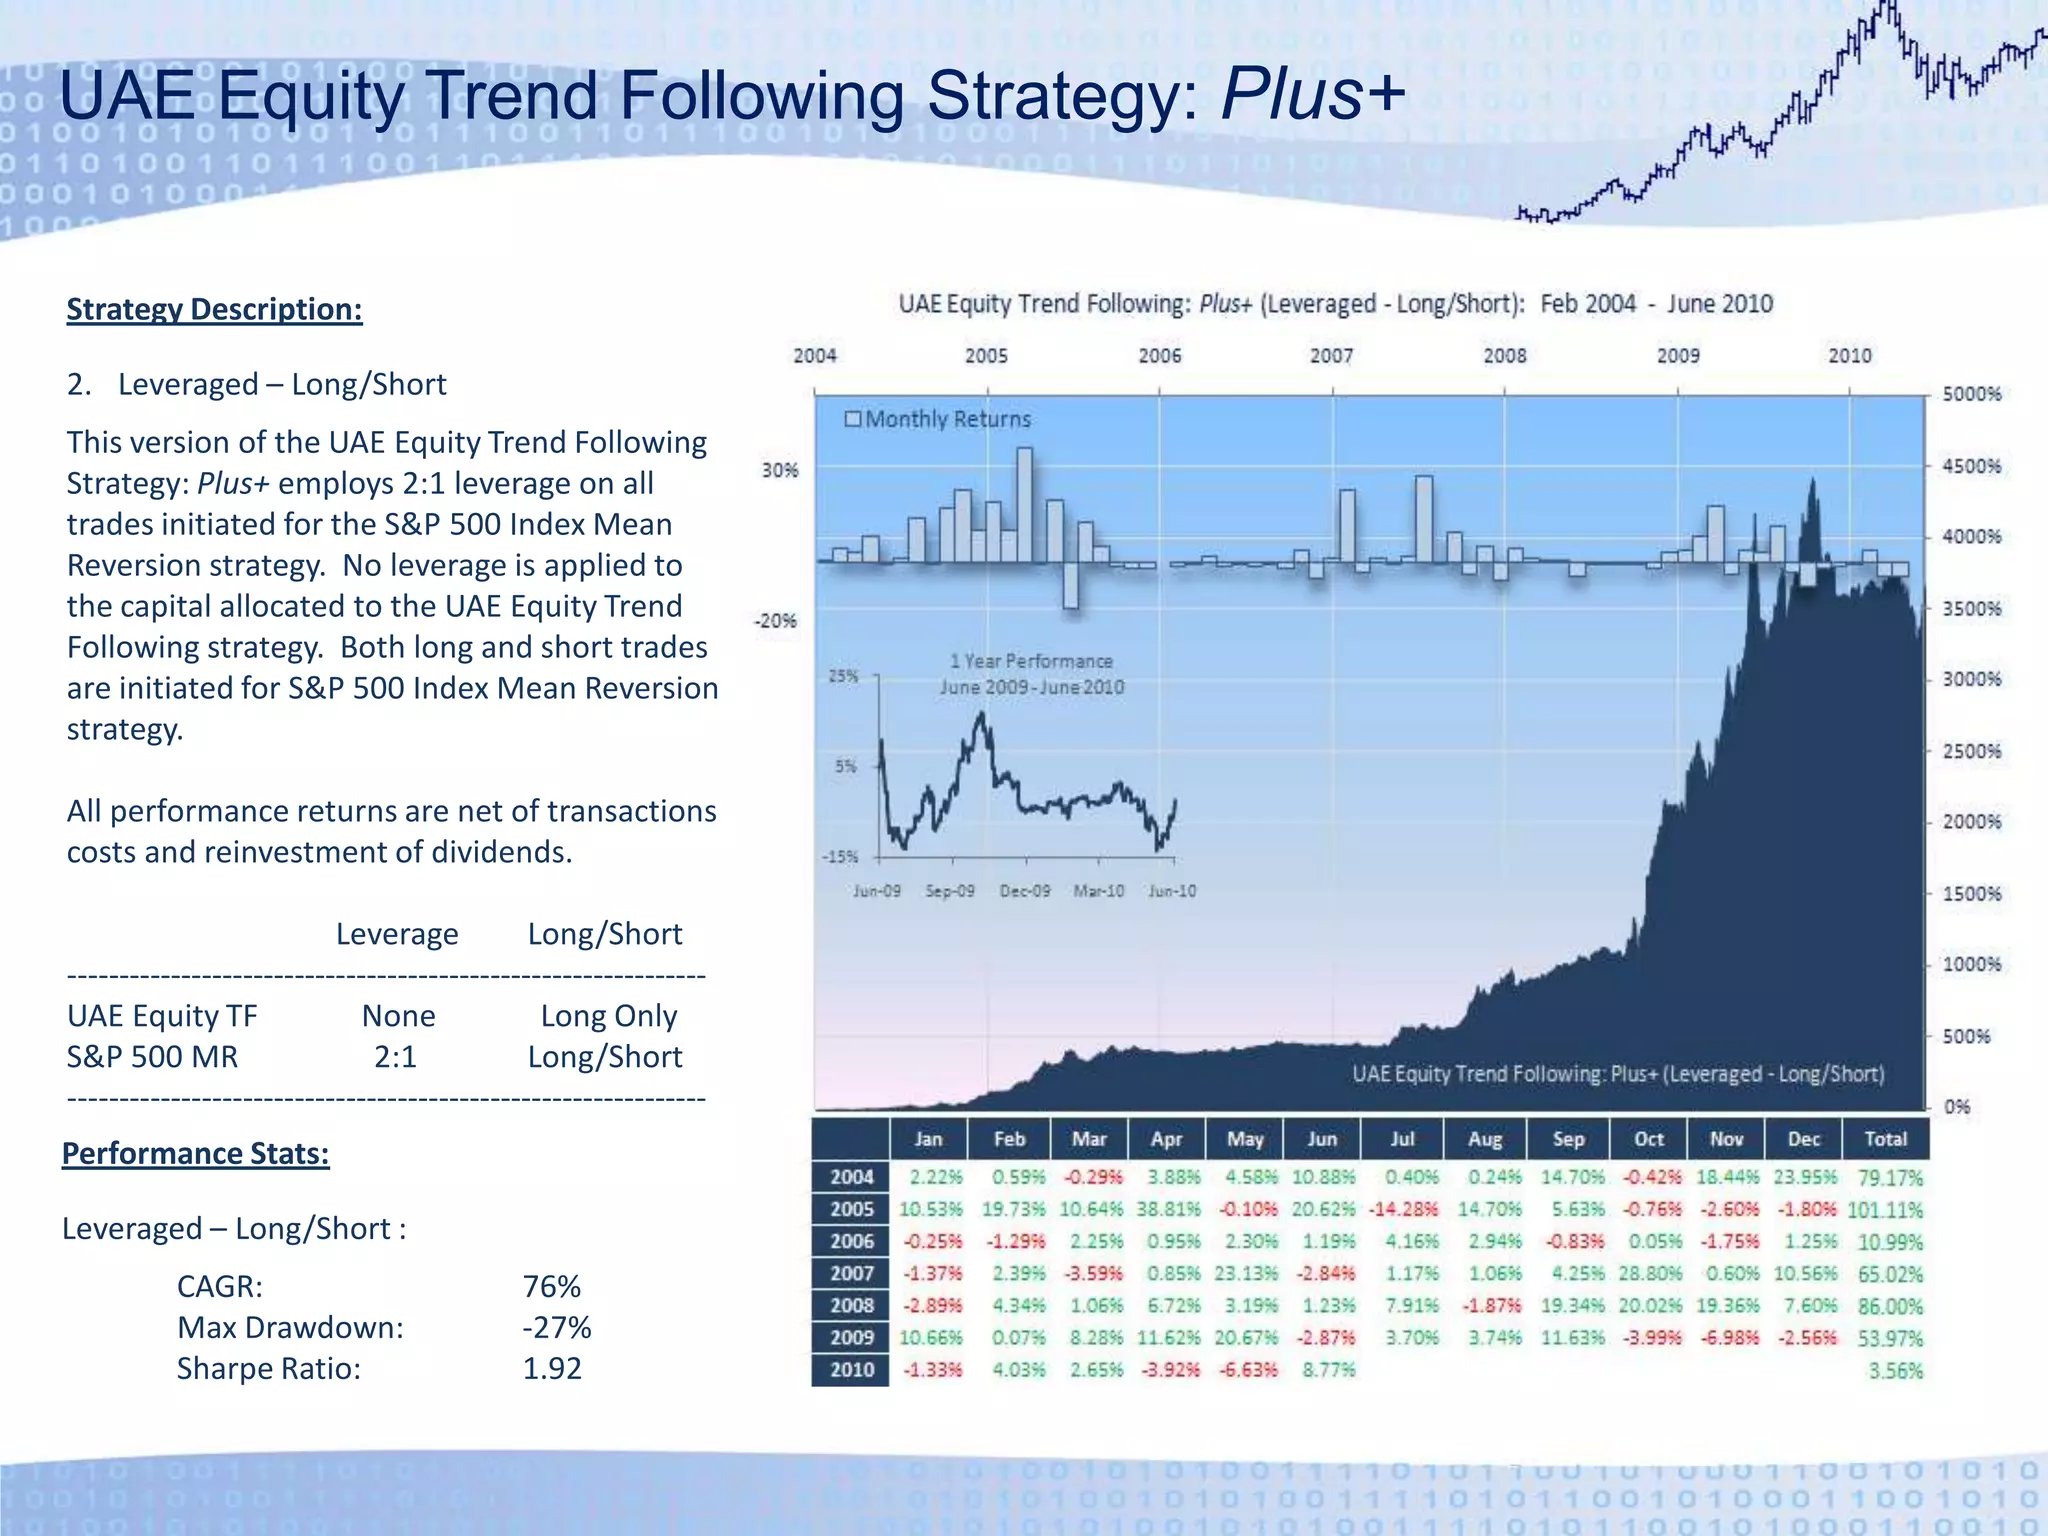
    UAE Equity TrendFollowing Strategy: Plus+Strategy Description:Leveraged – Long/ShortThis version of the UAE Equity Trend Following Strategy: Plus+ employs 2:1 leverage on all trades initiated for the S&P 500 Index Mean Reversion strategy. No leverage is applied to the capital allocated to the UAE Equity Trend Following strategy. Both long and short trades are initiated for S&P 500 Index Mean Reversion strategy.All performance returns are net of transactions costs and reinvestment of dividends. Leverage Long/Short--------------------------------------------------------------UAE Equity TF None Long OnlyS&P 500 MR 2:1 Long/Short--------------------------------------------------------------Performance Stats:Leveraged – Long/Short : CAGR: 76% Max Drawdown: -27% Sharpe Ratio: 1.92
  • 10.
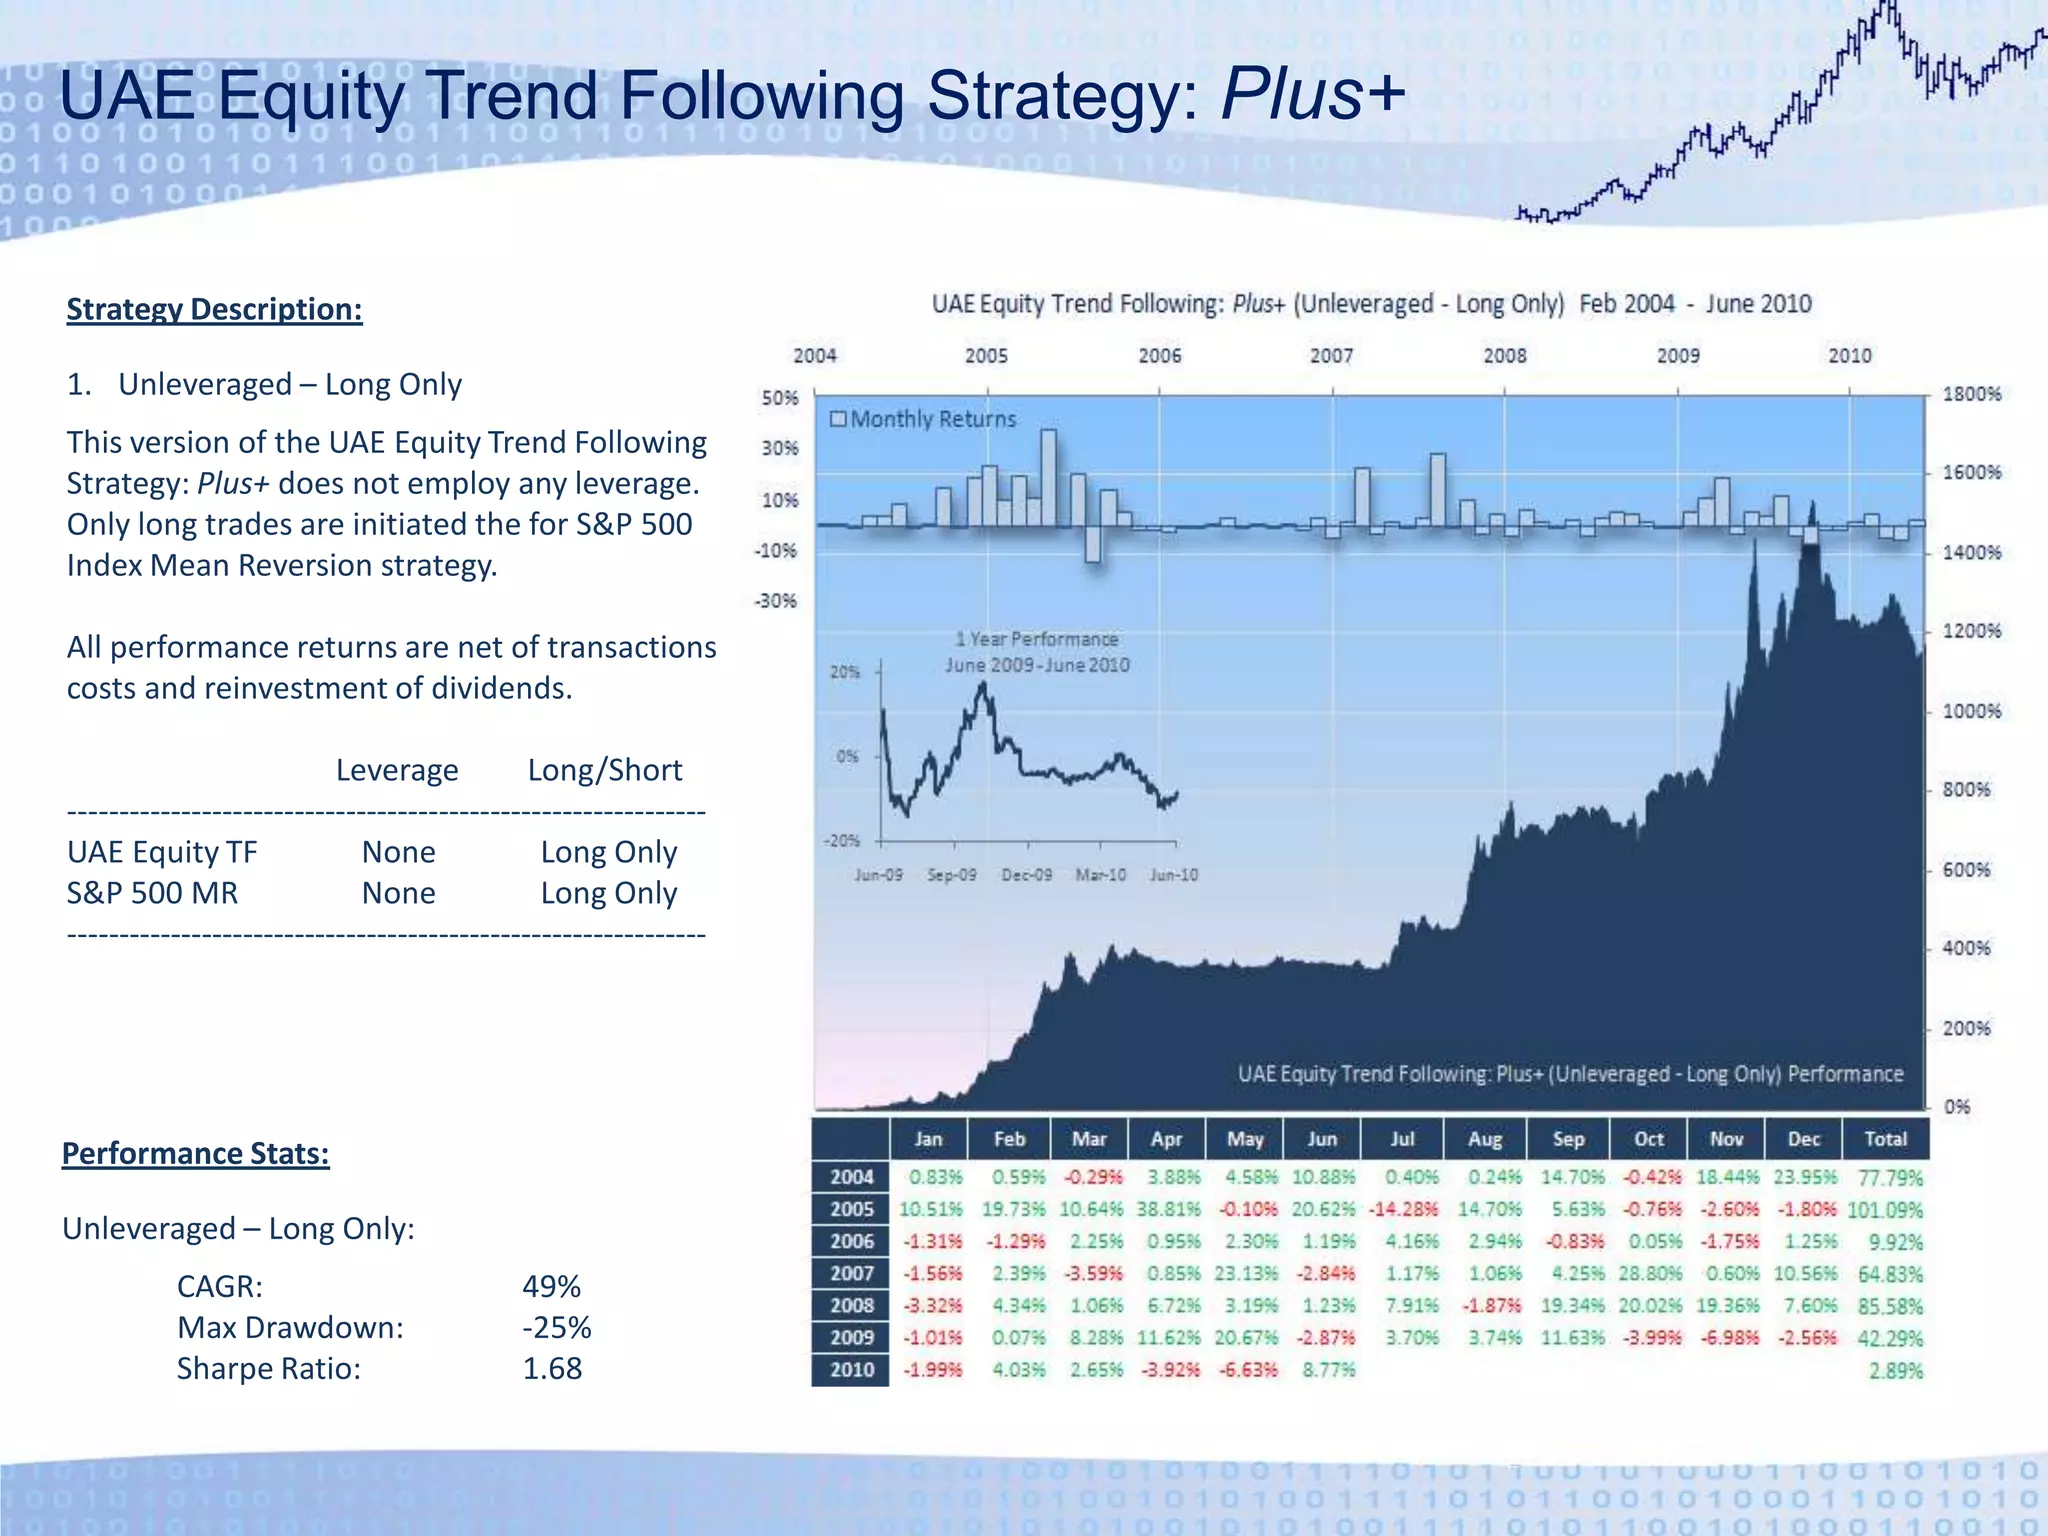
    UAE Equity TrendFollowing Strategy: Plus+Strategy Description:Unleveraged – Long OnlyThis version of the UAE Equity Trend Following Strategy: Plus+ does not employ any leverage. Only long trades are initiated the for S&P 500 Index Mean Reversion strategy.All performance returns are net of transactions costs and reinvestment of dividends. Leverage Long/Short--------------------------------------------------------------UAE Equity TF None Long OnlyS&P 500 MR None Long Only--------------------------------------------------------------Performance Stats:Unleveraged – Long Only: CAGR: 49% Max Drawdown: -25% Sharpe Ratio: 1.68
  • 11.
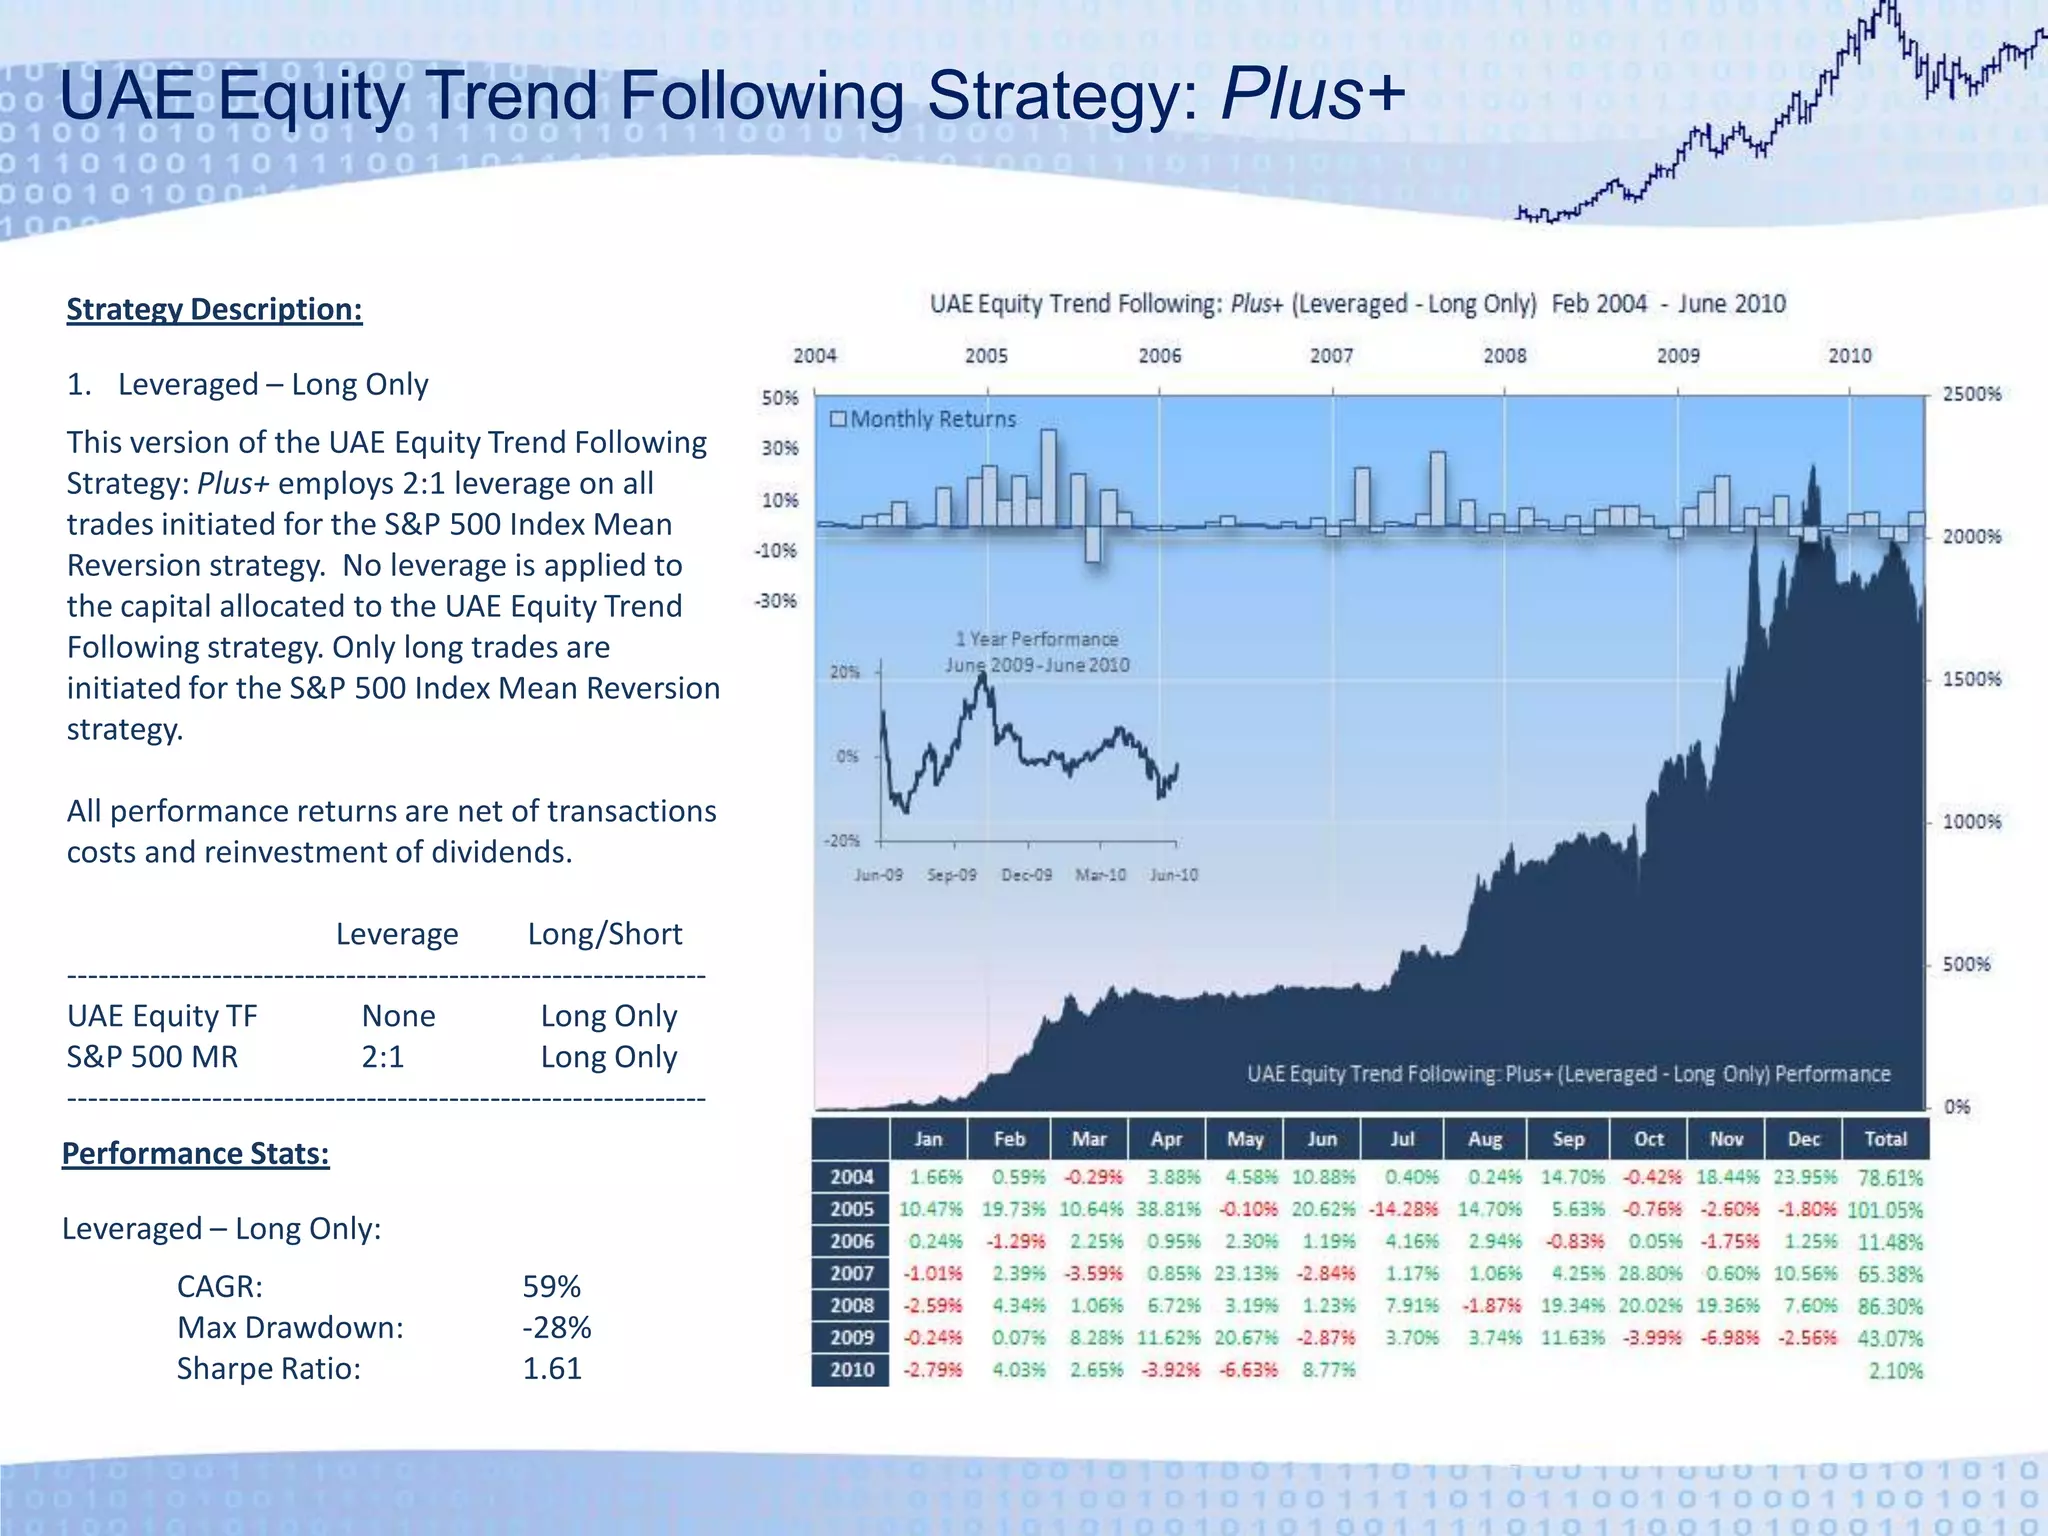
    UAE Equity TrendFollowing Strategy: Plus+Strategy Description:Leveraged – Long OnlyThis version of the UAE Equity Trend Following Strategy: Plus+ employs 2:1 leverage on all trades initiated for the S&P 500 Index Mean Reversion strategy. No leverage is applied to the capital allocated to the UAE Equity Trend Following strategy. Only long trades are initiated for the S&P 500 Index Mean Reversion strategy.All performance returns are net of transactions costs and reinvestment of dividends. Leverage Long/Short--------------------------------------------------------------UAE Equity TF None Long OnlyS&P 500 MR 2:1 Long Only--------------------------------------------------------------Performance Stats:Leveraged – Long Only: CAGR: 59% Max Drawdown: -28% Sharpe Ratio: 1.61
  • 12.
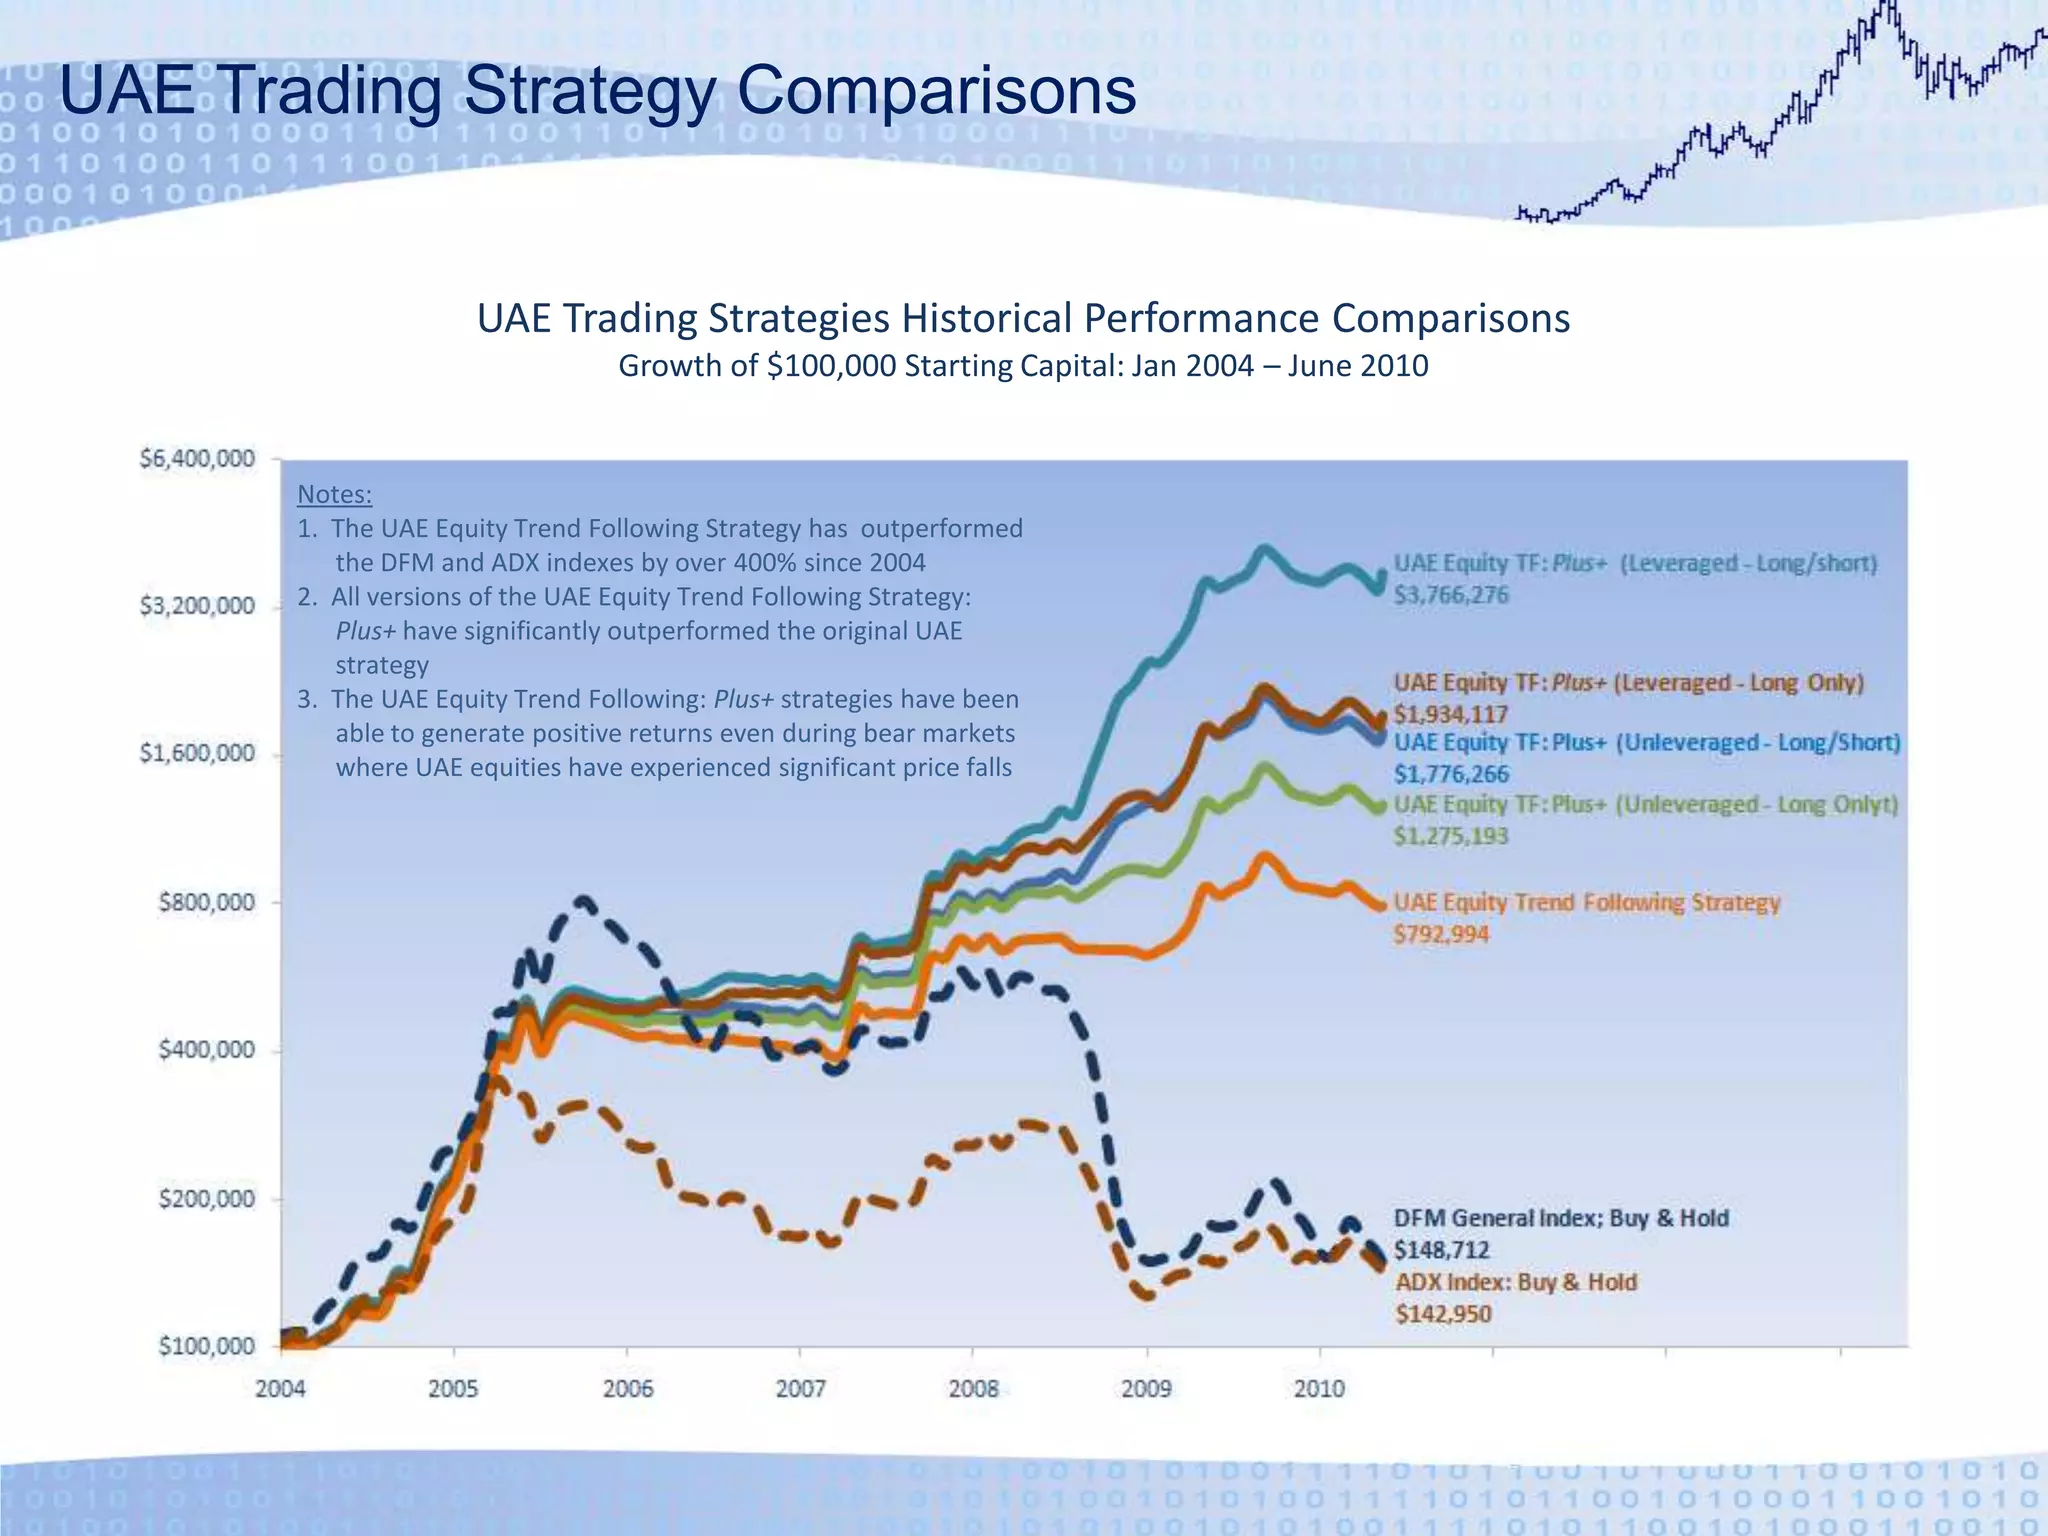
    UAE Trading StrategyComparisonsUAE Trading Strategies Historical Performance ComparisonsGrowth of $100,000 Starting Capital: Jan 2004 – June 2010Notes:1. The UAE Equity Trend Following Strategy has outperformed the DFM and ADX indexes by over 400% since 20042. All versions of the UAE Equity Trend Following Strategy: Plus+ have significantly outperformed the original UAE strategy3. The UAE Equity Trend Following: Plus+ strategies have been able to generate positive returns even during bear markets where UAE equities have experienced significant price falls
  • 13.
    MENA Trading StrategiesMENAEquity Trend Following Strategy&MENA Equity Trend Following Strategy: Plus+
  • 14.
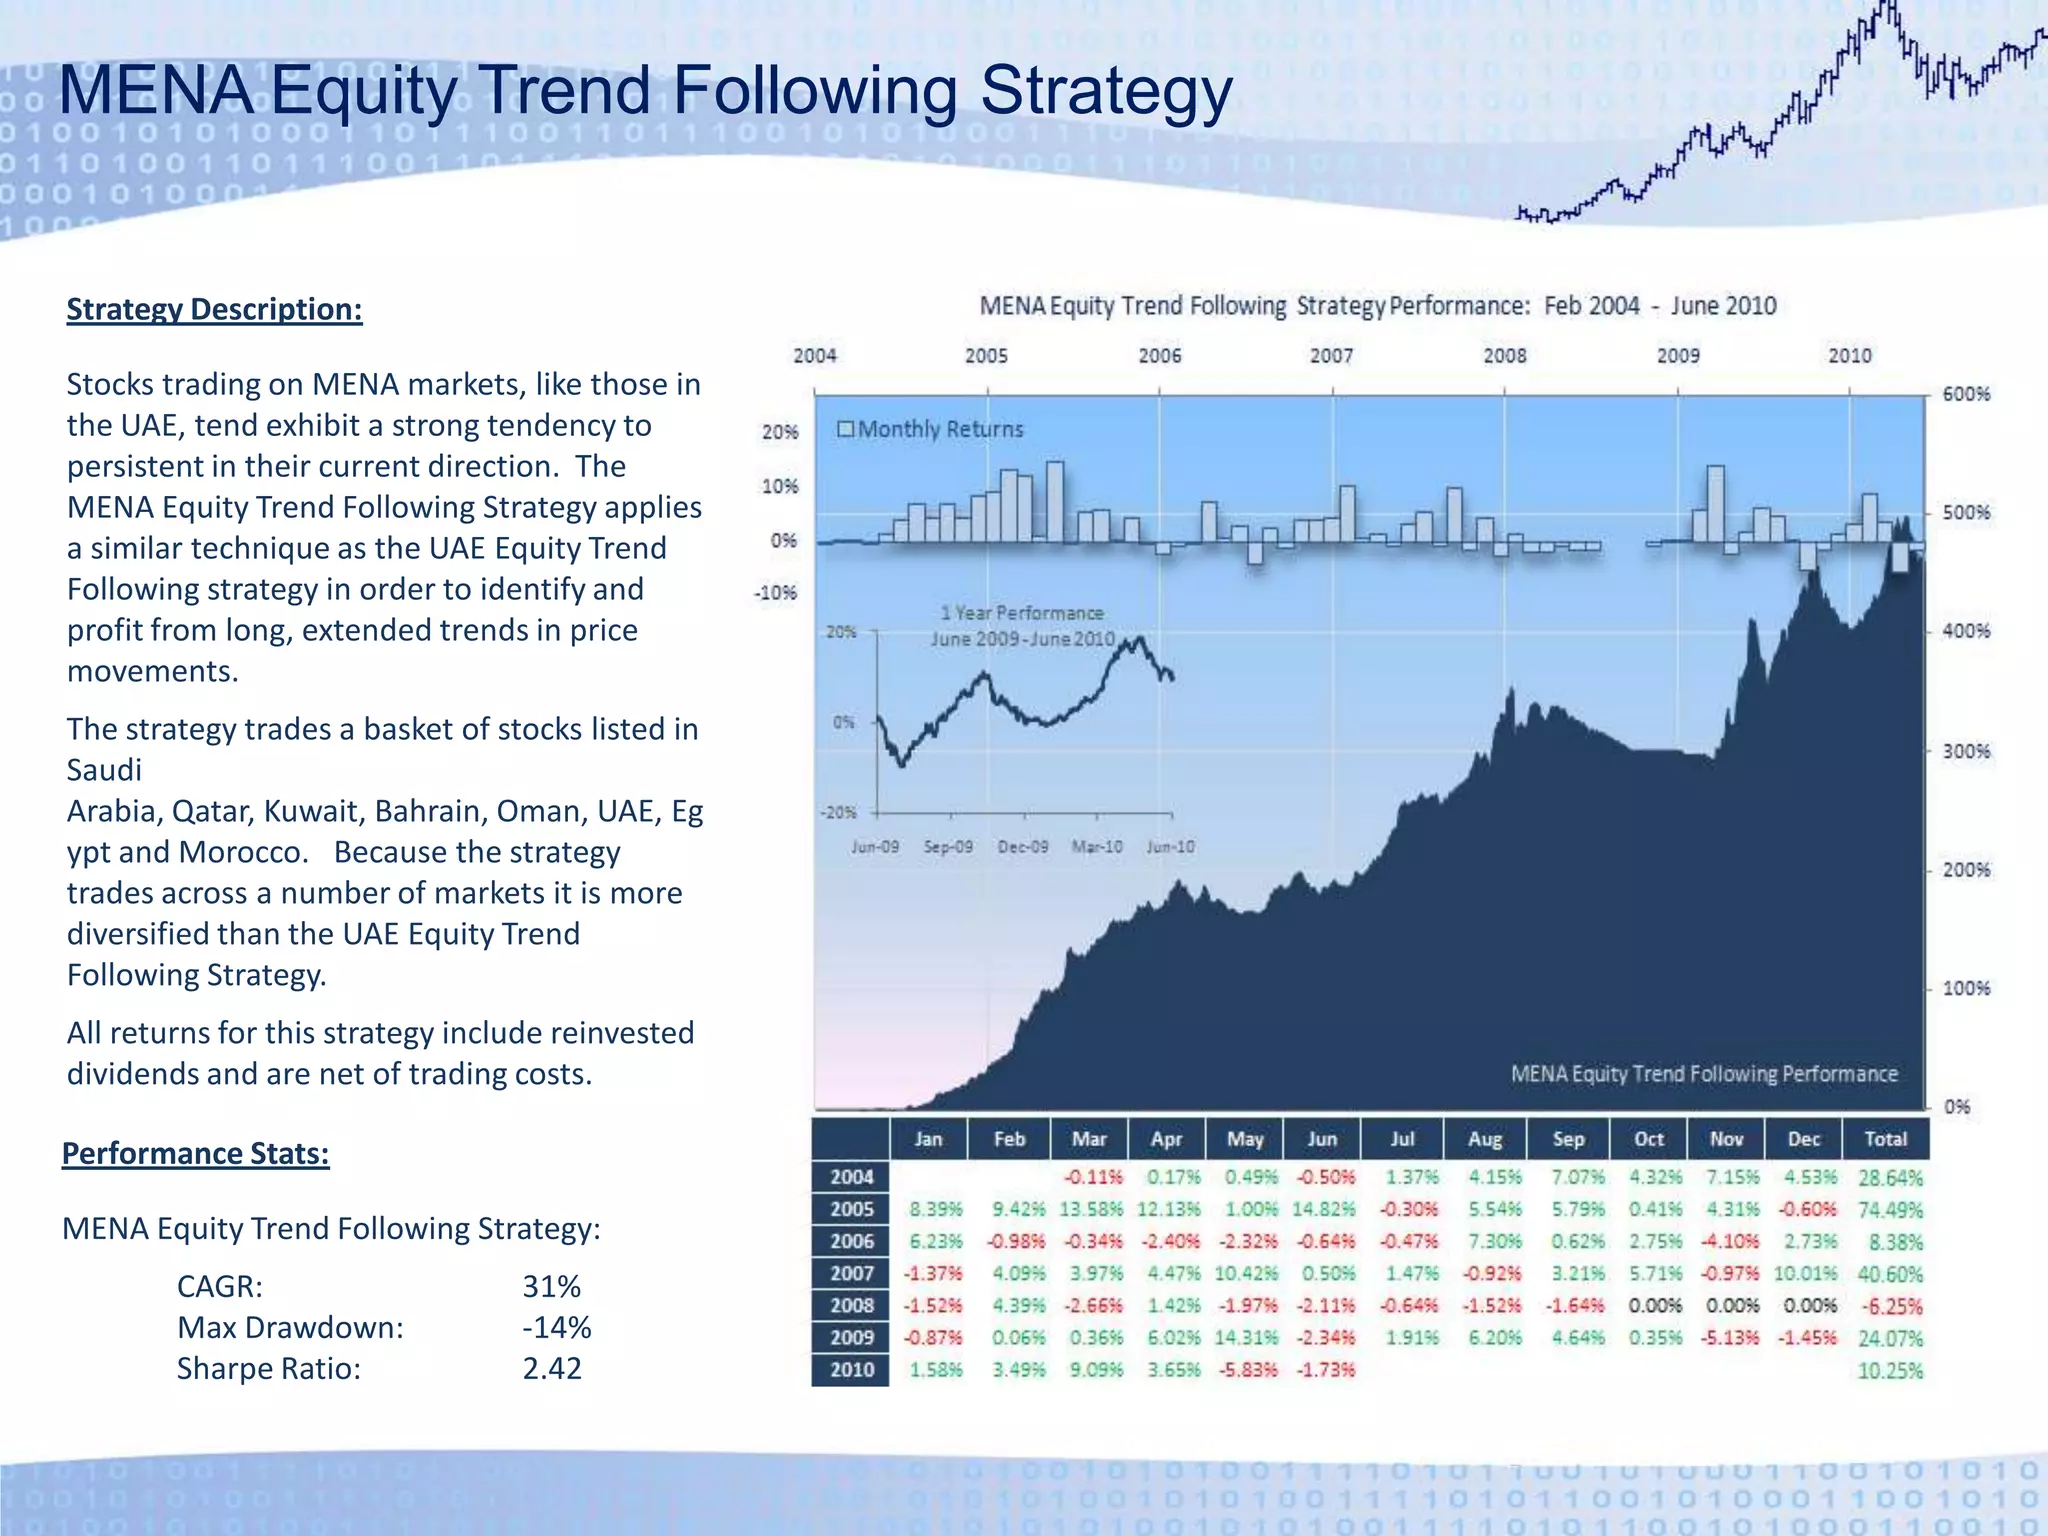
    MENA Equity TrendFollowing StrategyStrategy Description:Stocks trading on MENA markets, like those in the UAE, tend exhibit a strong tendency to persistent in their current direction. The MENA Equity Trend Following Strategy applies a similar technique as the UAE Equity Trend Following strategy in order to identify and profit from long, extended trends in price movements. The strategy trades a basket of stocks listed in Saudi Arabia, Qatar, Kuwait, Bahrain, Oman, UAE, Egypt and Morocco. Because the strategy trades across a number of markets it is more diversified than the UAE Equity Trend Following Strategy.All returns for this strategy include reinvested dividends and are net of trading costs.Performance Stats:MENA Equity Trend Following Strategy: CAGR: 31% Max Drawdown: -14% Sharpe Ratio: 2.42
  • 15.
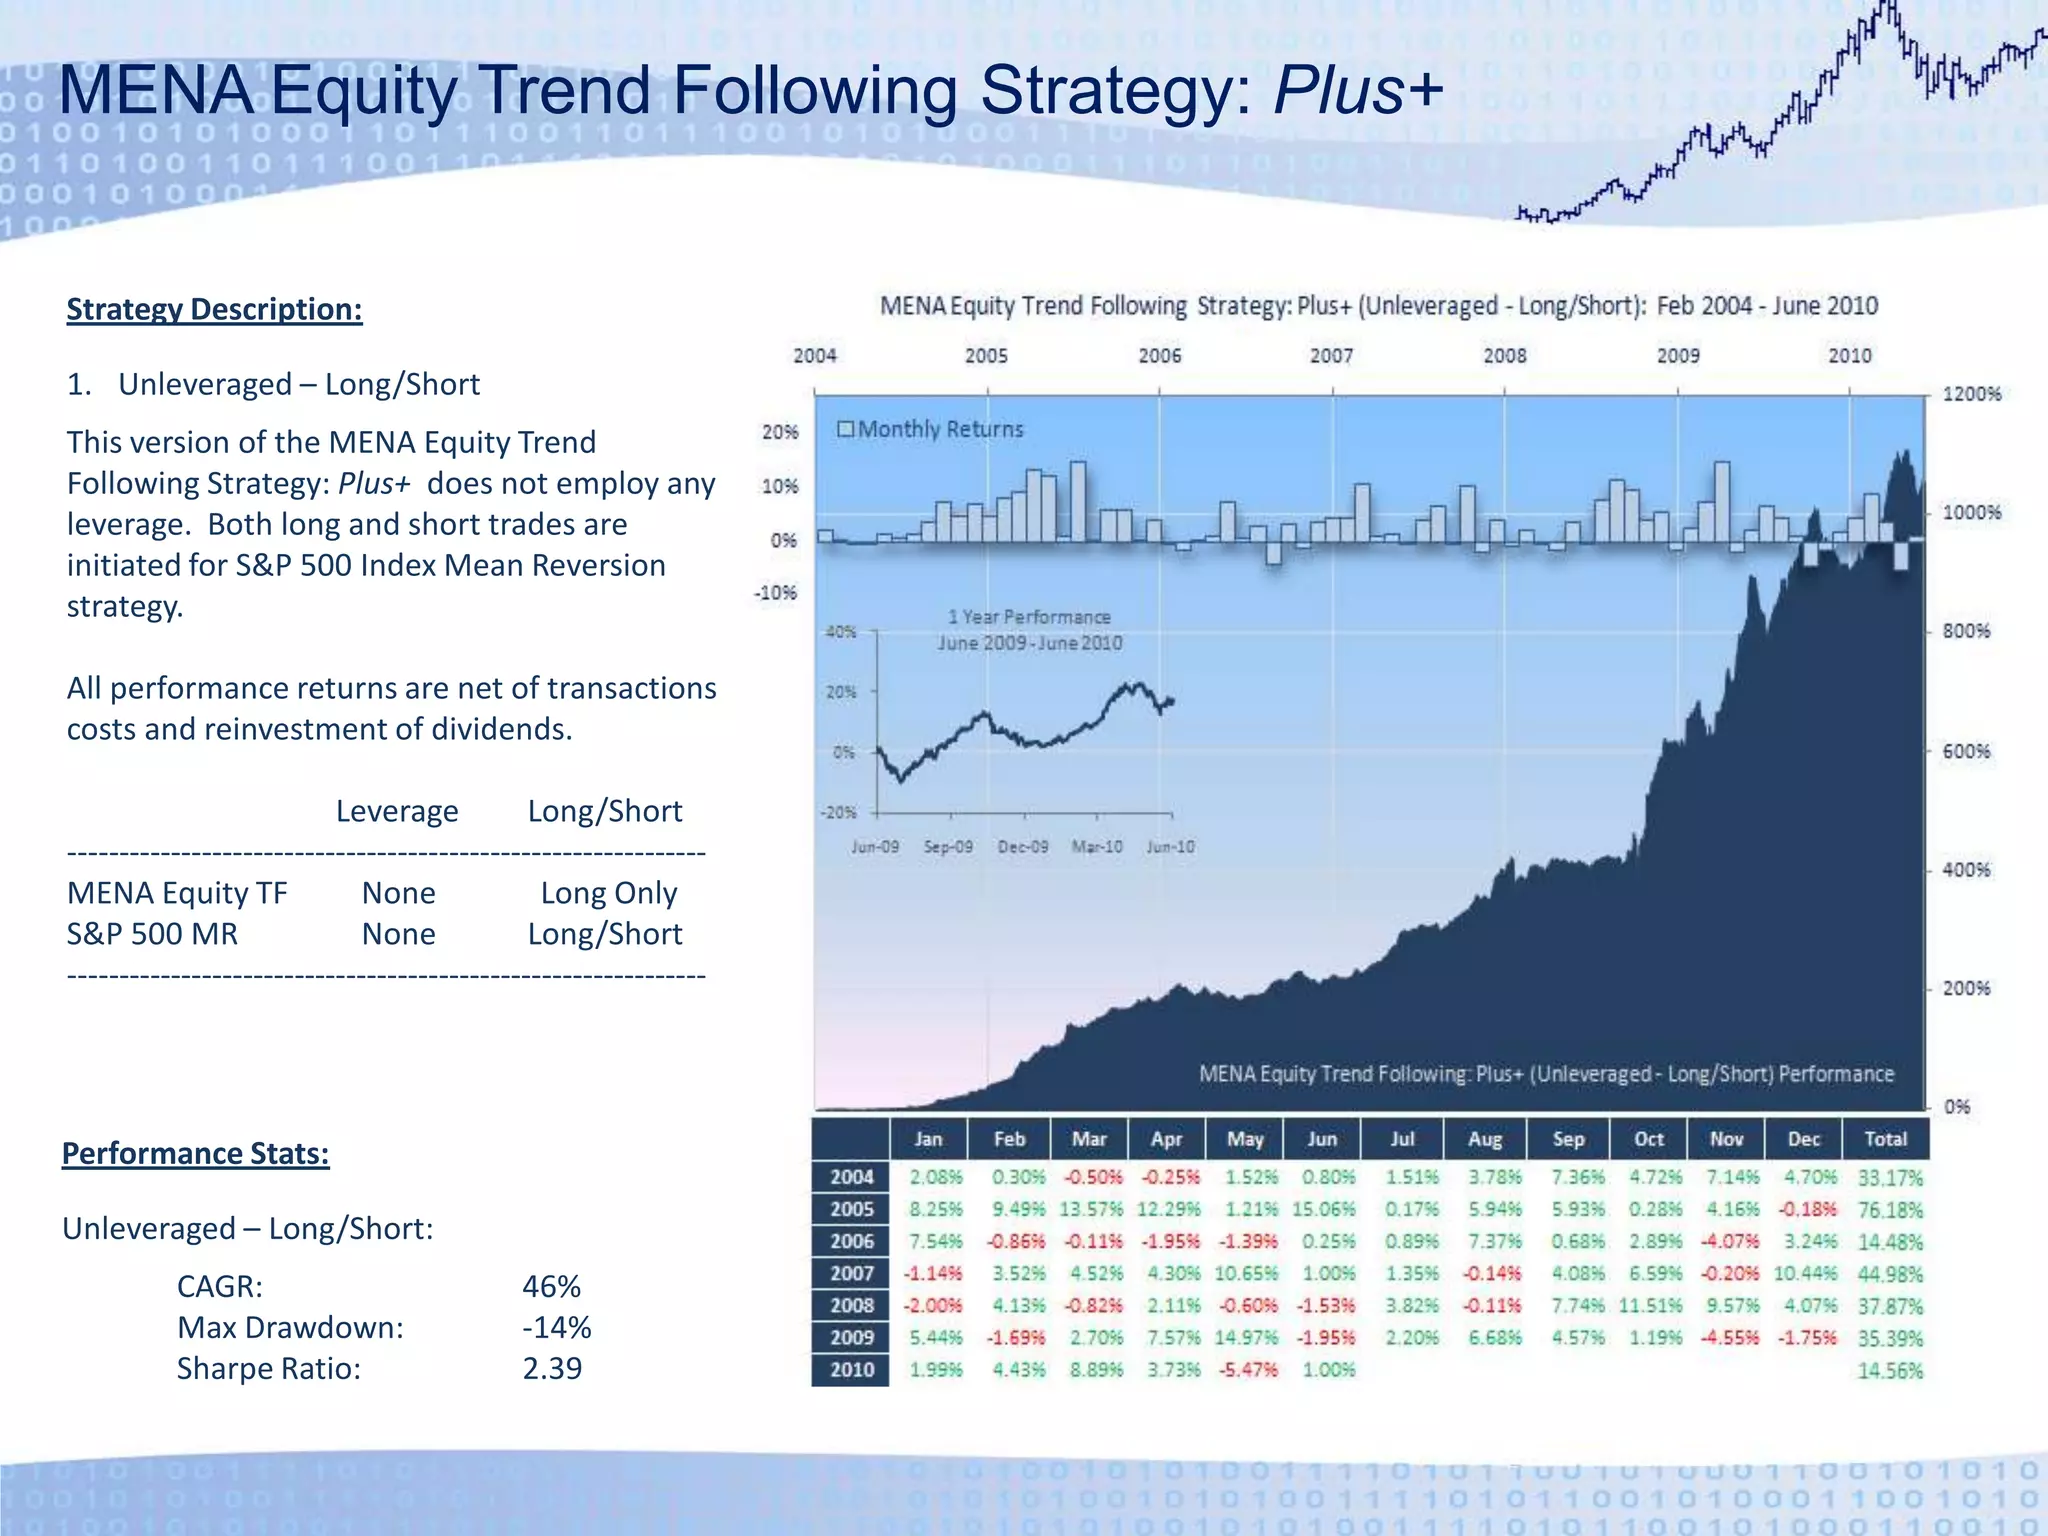
    MENA Equity TrendFollowing Strategy: Plus+Strategy Description:Unleveraged – Long/ShortThis version of the MENA Equity Trend Following Strategy: Plus+ does not employ any leverage. Both long and short trades are initiated for S&P 500 Index Mean Reversion strategy.All performance returns are net of transactions costs and reinvestment of dividends. Leverage Long/Short--------------------------------------------------------------MENA Equity TF None Long OnlyS&P 500 MR None Long/Short--------------------------------------------------------------Performance Stats:Unleveraged – Long/Short: CAGR: 46% Max Drawdown: -14% Sharpe Ratio: 2.39
  • 16.
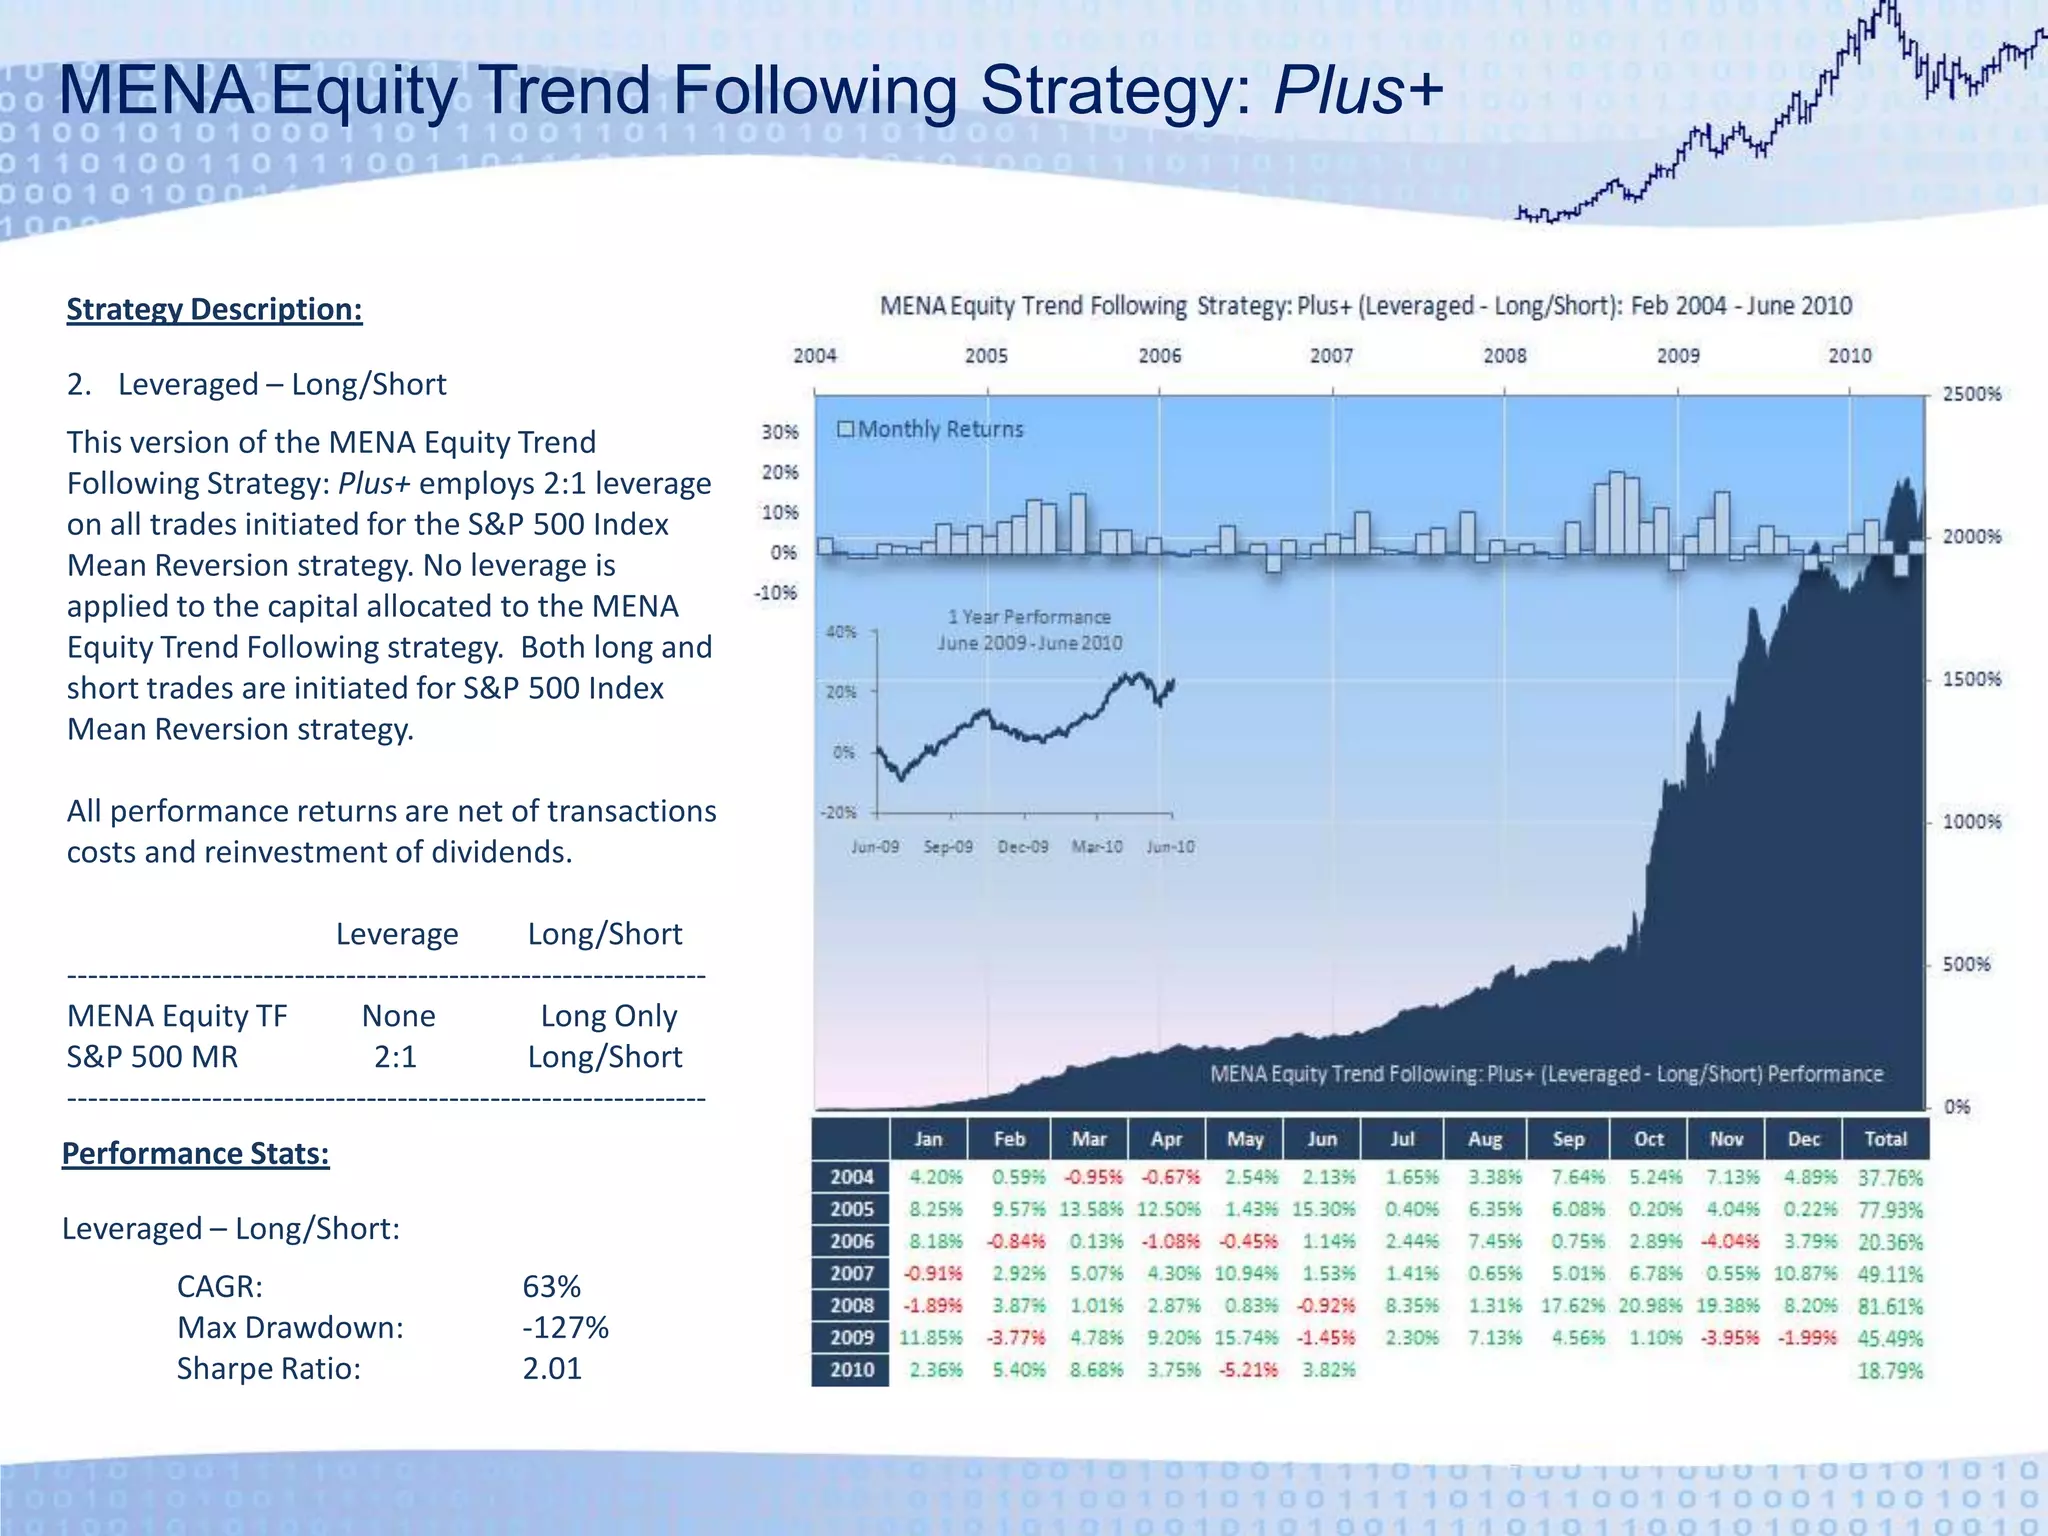
    MENA Equity TrendFollowing Strategy: Plus+Strategy Description:Leveraged – Long/ShortThis version of the MENA Equity Trend Following Strategy: Plus+ employs 2:1 leverage on all trades initiated for the S&P 500 Index Mean Reversion strategy. No leverage is applied to the capital allocated to the MENA Equity Trend Following strategy. Both long and short trades are initiated for S&P 500 Index Mean Reversion strategy.All performance returns are net of transactions costs and reinvestment of dividends. Leverage Long/Short--------------------------------------------------------------MENA Equity TF None Long OnlyS&P 500 MR 2:1 Long/Short--------------------------------------------------------------Performance Stats:Leveraged – Long/Short: CAGR: 63% Max Drawdown: -127% Sharpe Ratio: 2.01
  • 17.
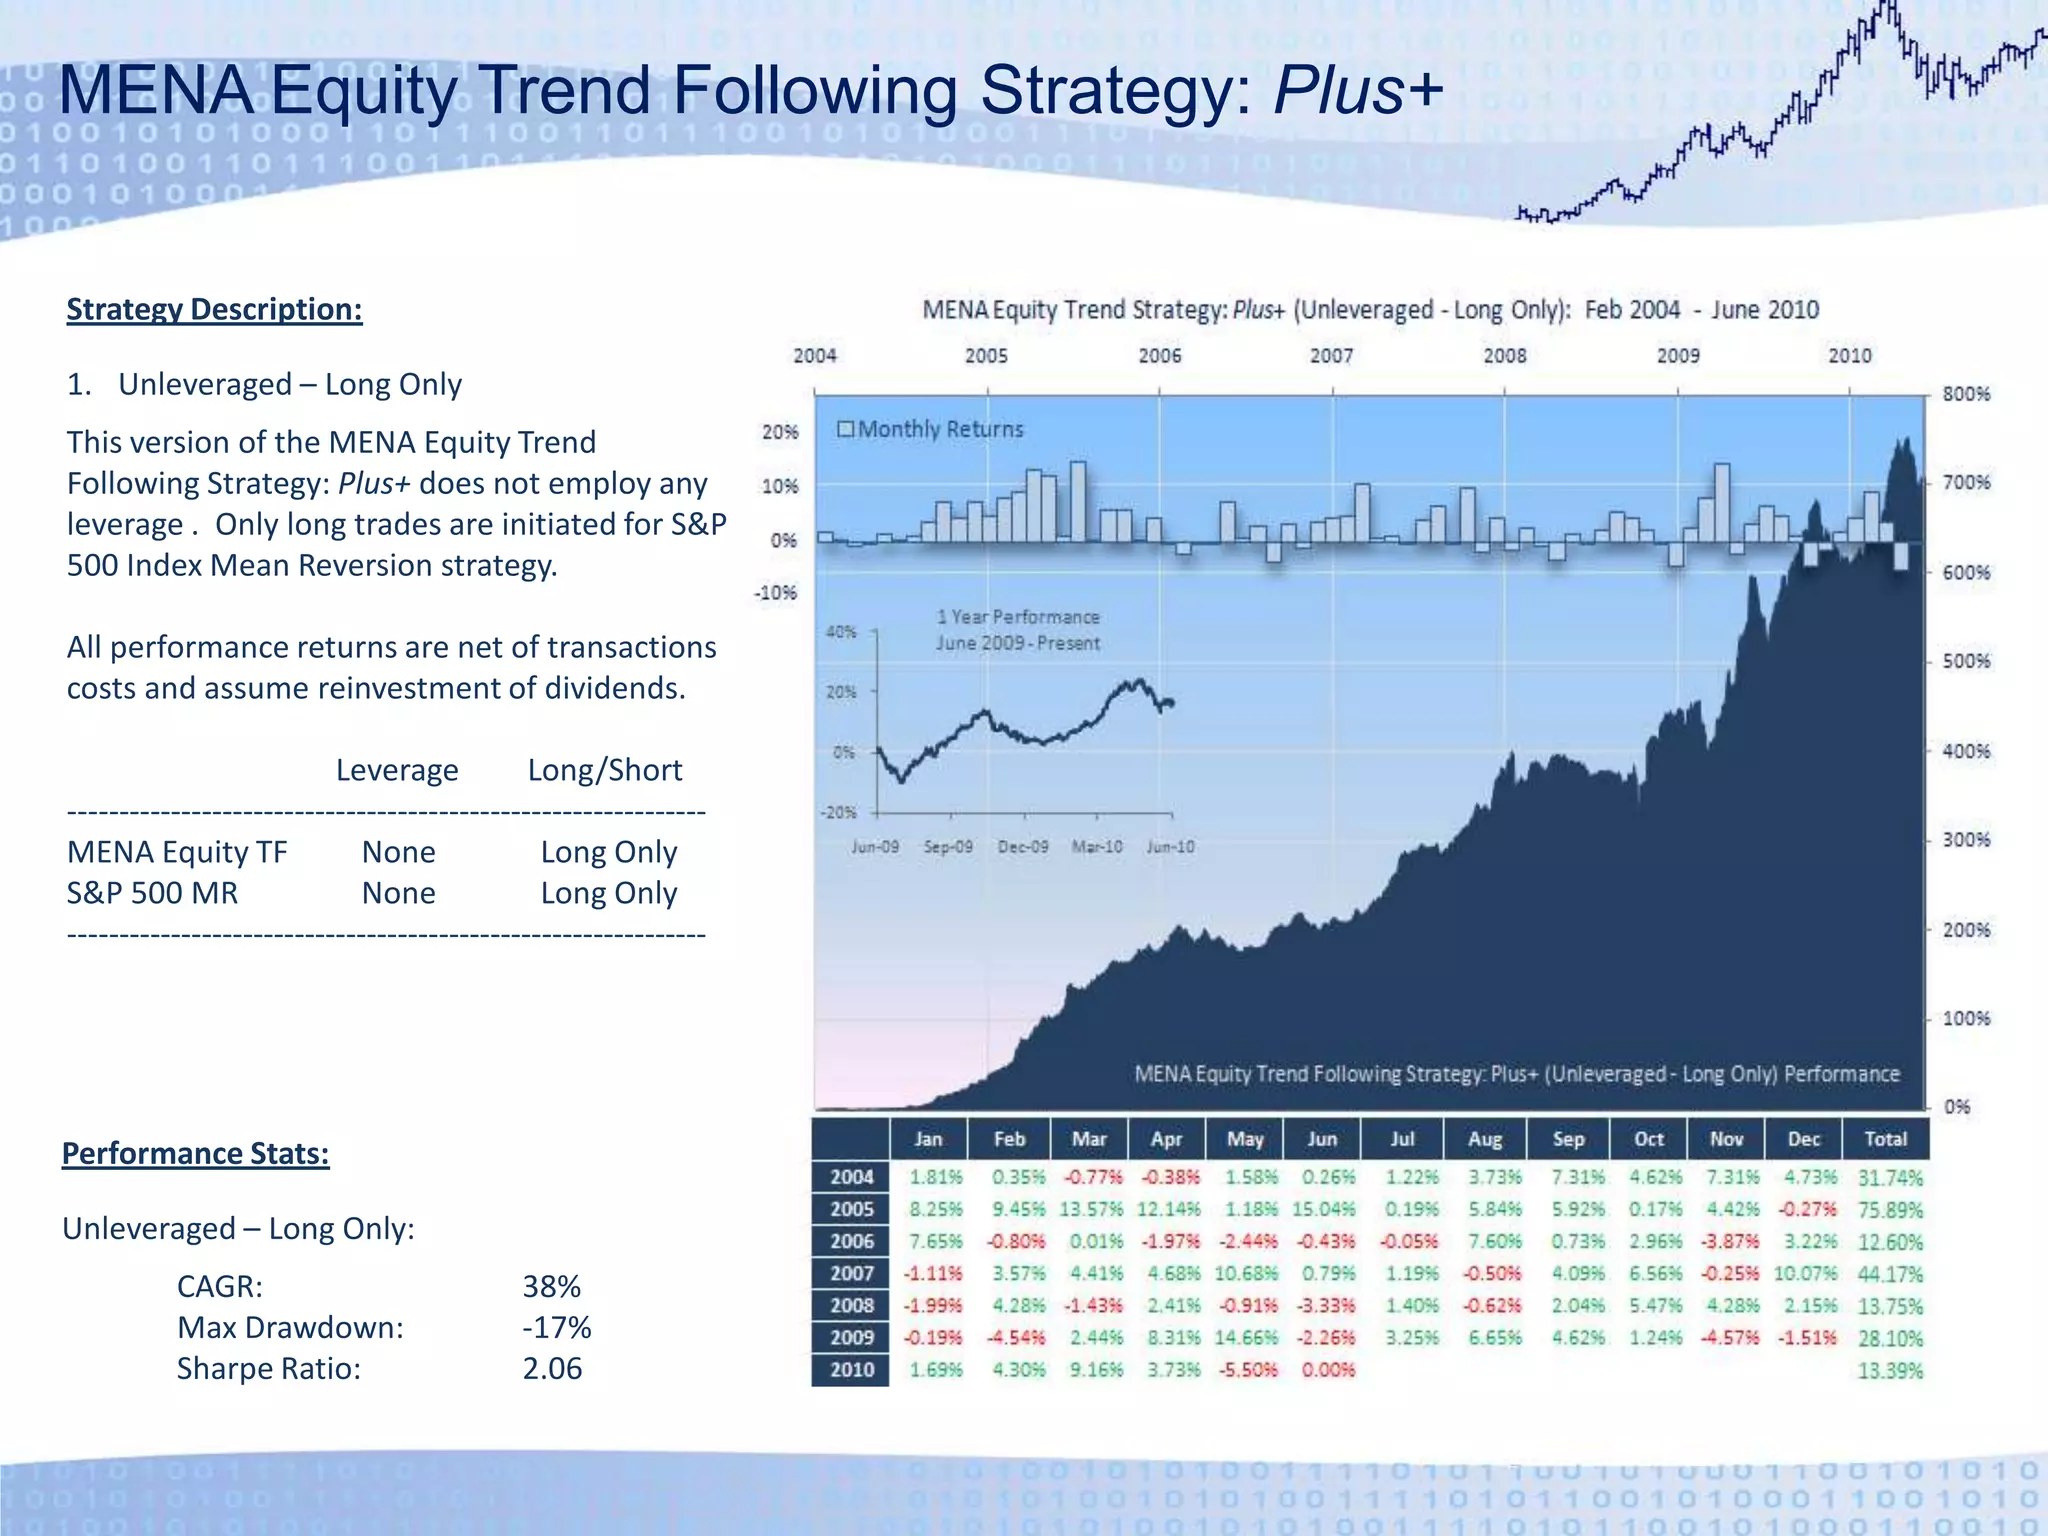
    MENA Equity TrendFollowing Strategy: Plus+Strategy Description:Unleveraged – Long OnlyThis version of the MENA Equity Trend Following Strategy: Plus+ does not employ any leverage . Only long trades are initiated for S&P 500 Index Mean Reversion strategy.All performance returns are net of transactions costs and assume reinvestment of dividends. Leverage Long/Short--------------------------------------------------------------MENA Equity TF None Long OnlyS&P 500 MR None Long Only--------------------------------------------------------------Performance Stats:Unleveraged – Long Only: CAGR: 38% Max Drawdown: -17% Sharpe Ratio: 2.06
  • 18.
    MENA Equity TrendFollowing Strategy: Plus+Strategy Description:Leveraged – Long OnlyThis version of the MENA Equity Trend Following Strategy: Plus+ employs 2:1 leverage on all trades initiated for the S&P 500 Index Mean Reversion strategy. No leverage is applied to the capital allocated to the MENA Equity Trend Following strategy. Only long trades are initiated for the S&P 500 Index Mean Reversion strategy.All performance returns are net of transactions costs and reinvestment of dividends Leverage Long/Short--------------------------------------------------------------MENA Equity TF None Long OnlyS&P 500 MR 2:1 Long Only--------------------------------------------------------------Performance Stats:Leveraged – Long Only: CAGR: 45% Max Drawdown: -28% Sharpe Ratio: 1.58
  • 19.
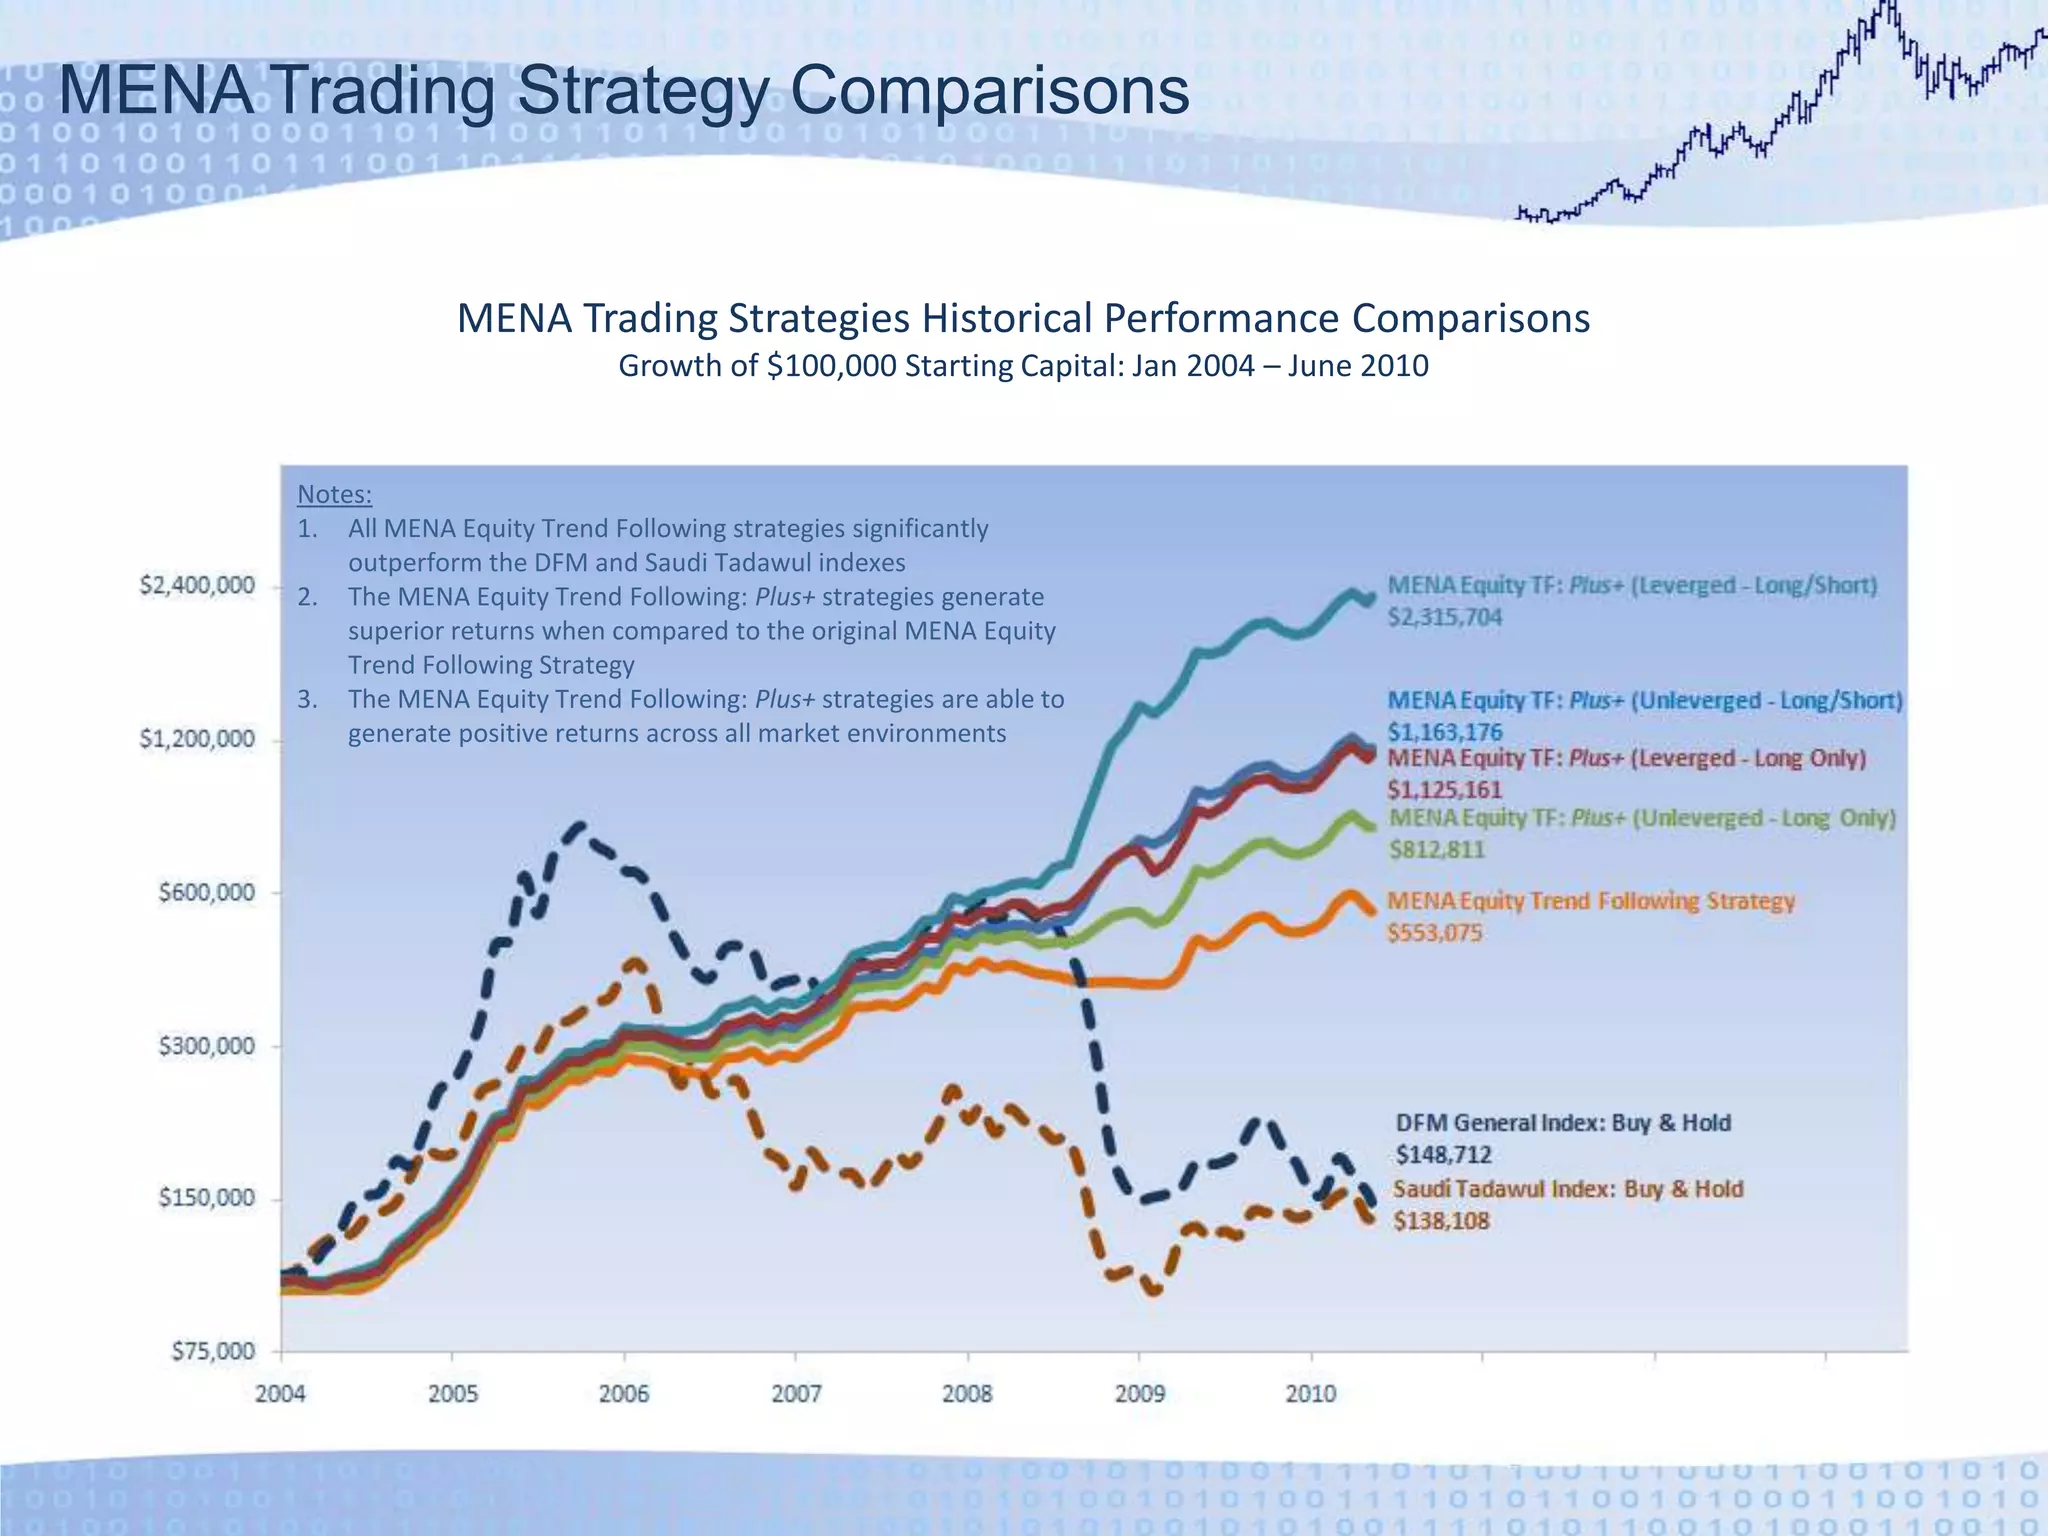
    MENA Trading StrategyComparisonsMENA Trading Strategies Historical Performance ComparisonsGrowth of $100,000 Starting Capital: Jan 2004 – June 2010Notes:All MENA Equity Trend Following strategies significantly outperform the DFM and Saudi Tadawul indexesThe MENA Equity Trend Following: Plus+ strategies generate superior returns when compared to the original MENA Equity Trend Following StrategyThe MENA Equity Trend Following: Plus+ strategies are able to generate positive returns across all market environments
  • 20.
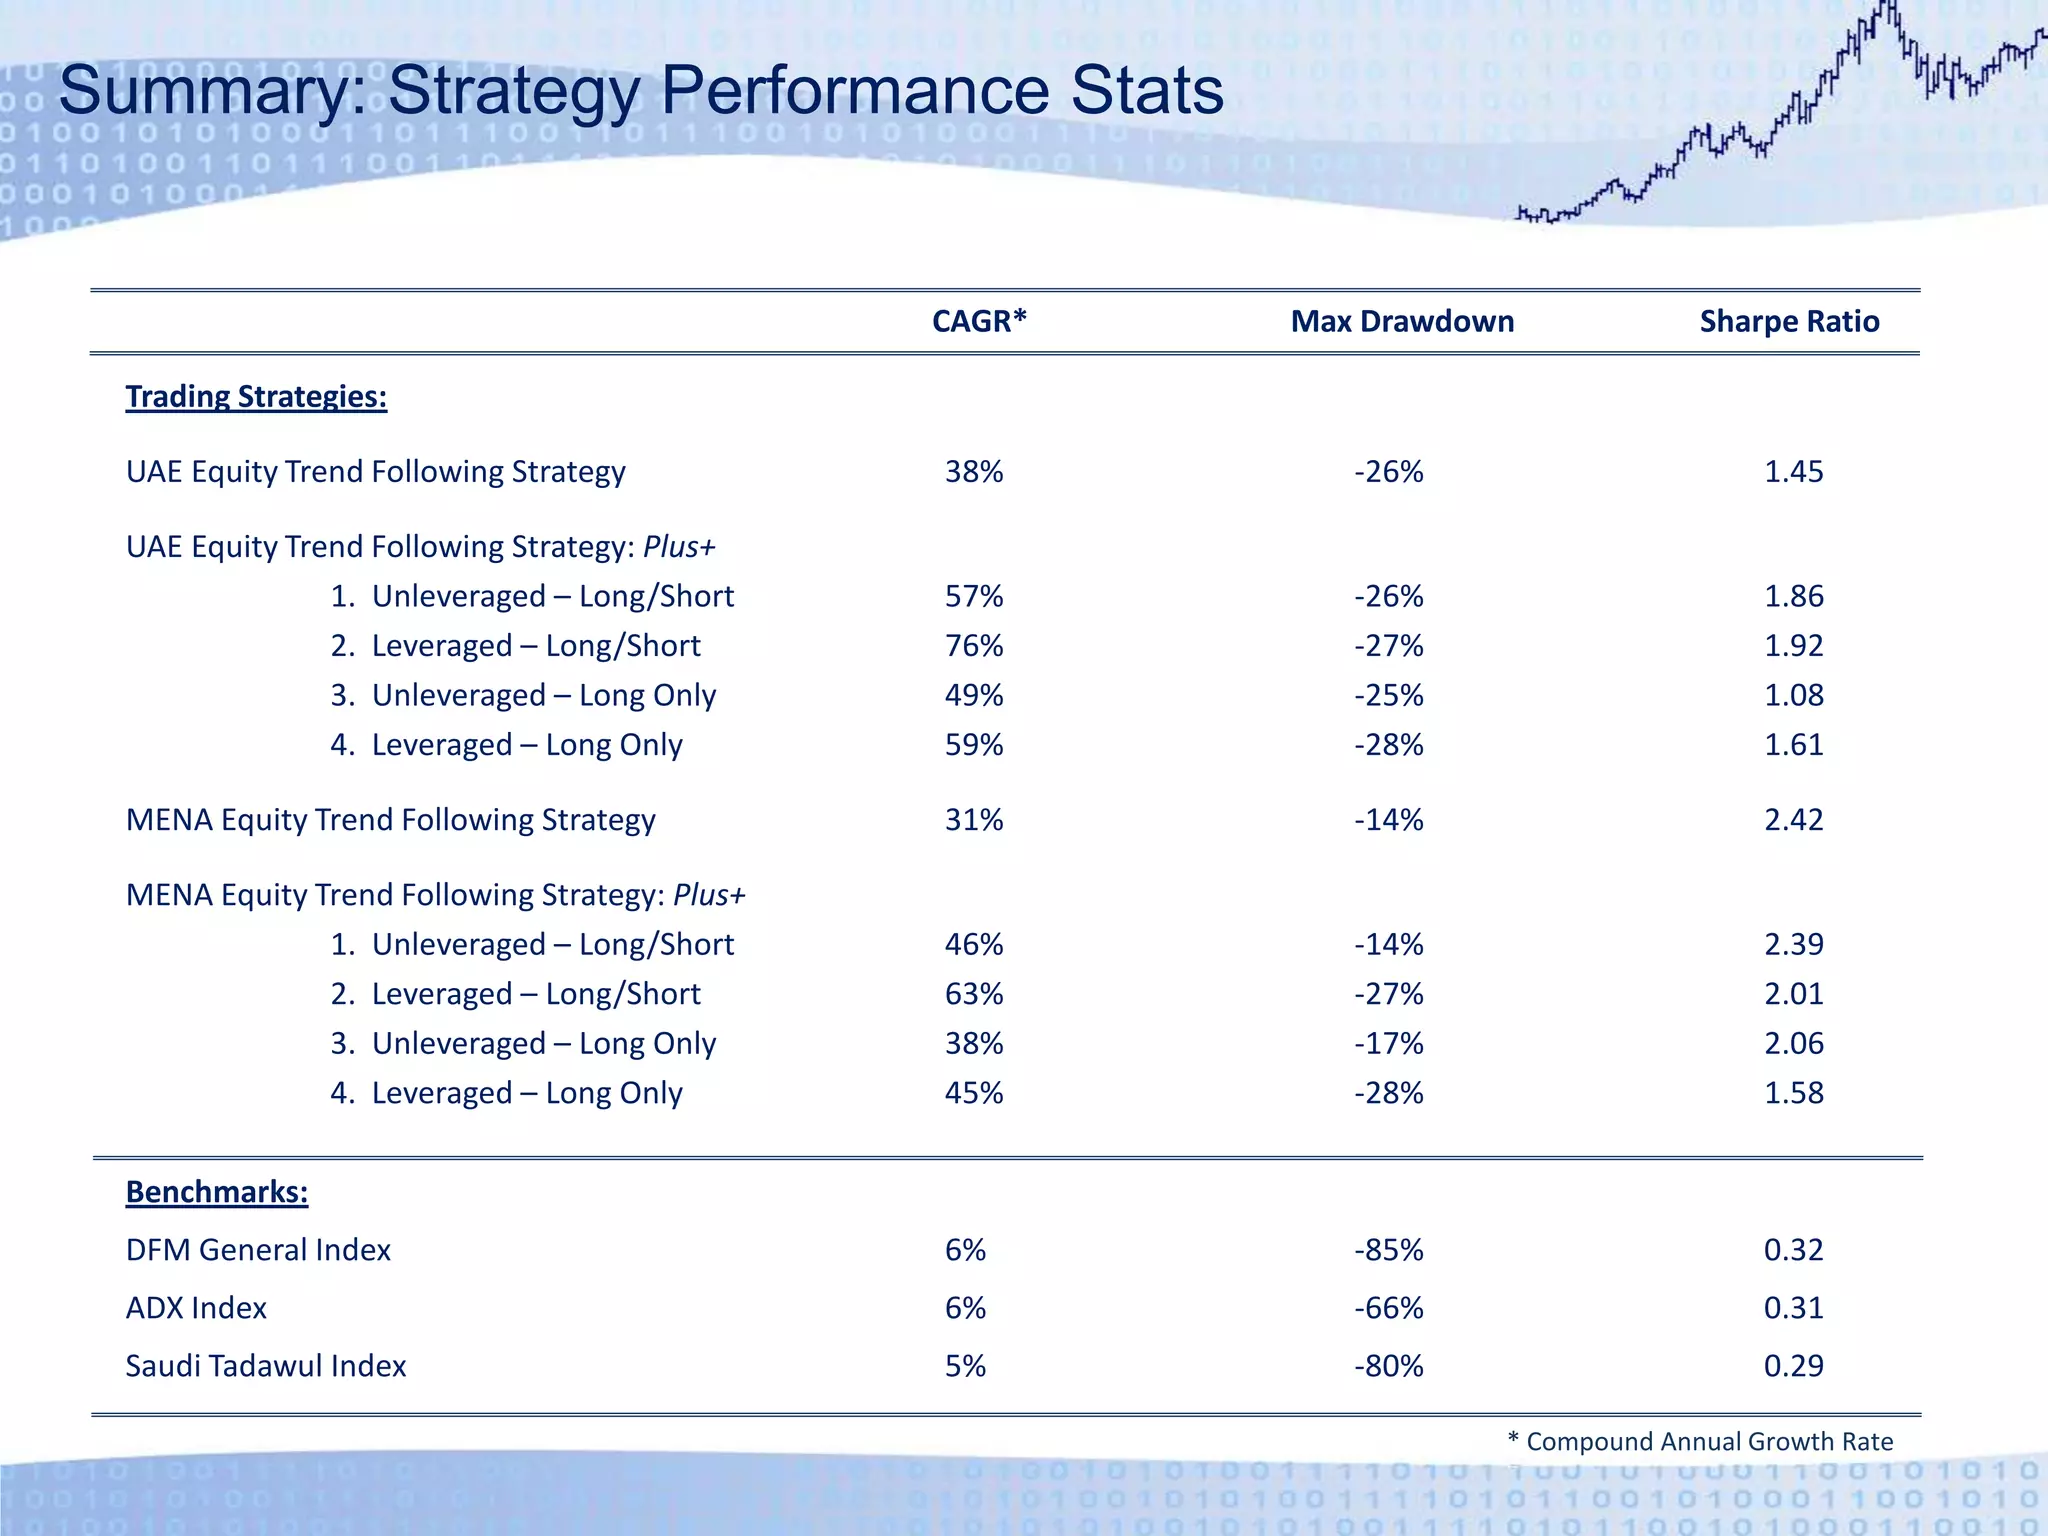
    Summary: Strategy PerformanceStatsCAGR* Max Drawdown Sharpe RatioTrading Strategies:UAE Equity Trend Following Strategy 38% -26% 1.45 UAE Equity Trend Following Strategy: Plus+ 1. Unleveraged – Long/Short 57% -26% 1.86 2. Leveraged – Long/Short 76% -27% 1.92 3. Unleveraged – Long Only 49% -25% 1.08 4. Leveraged – Long Only 59% -28% 1.61 MENA Equity Trend Following Strategy 31% -14% 2.42MENA Equity Trend Following Strategy: Plus+ 1. Unleveraged – Long/Short 46% -14% 2.39 2. Leveraged – Long/Short 63% -27% 2.01 3. Unleveraged – Long Only 38% -17% 2.06 4. Leveraged – Long Only 45% -28% 1.58Benchmarks:DFM General Index 6% -85% 0.32ADX Index 6% -66% 0.31Saudi Tadawul Index 5% -80% 0.29 * Compound Annual Growth Rate

Editor's Notes

  • #4 Testing: just not done, amazinglyEmpirical: focused on what has worked and not what should work
  • #14 Testing: just not done, amazinglyEmpirical: focused on what has worked and not what should work