Downloaded 113 times


This document discusses multivariate analysis and the relationship between smoking and lung cancer. It provides several key studies that established this relationship: - A 1950 case-control study that associated lung cancer with smoking. - A 1898 study finding elevated lung tumors in tobacco workers exposed to tobacco dust. - Later studies in the 1930s-1950s further strengthened the relationship by showing higher rates of lung cancer in heavy smokers.
Overview of Multivariate Analysis as a statistical technique. Presented by Prof. Dr. Jamalludin Ab Rahman.
Studies linking smoking to lung cancer, including case-control studies and risk factors associated with heavy smoking.
Focus on analyzing the relationships between two or more variables.
Explanation of multivariate analysis, involving multiple independent and dependent variables.
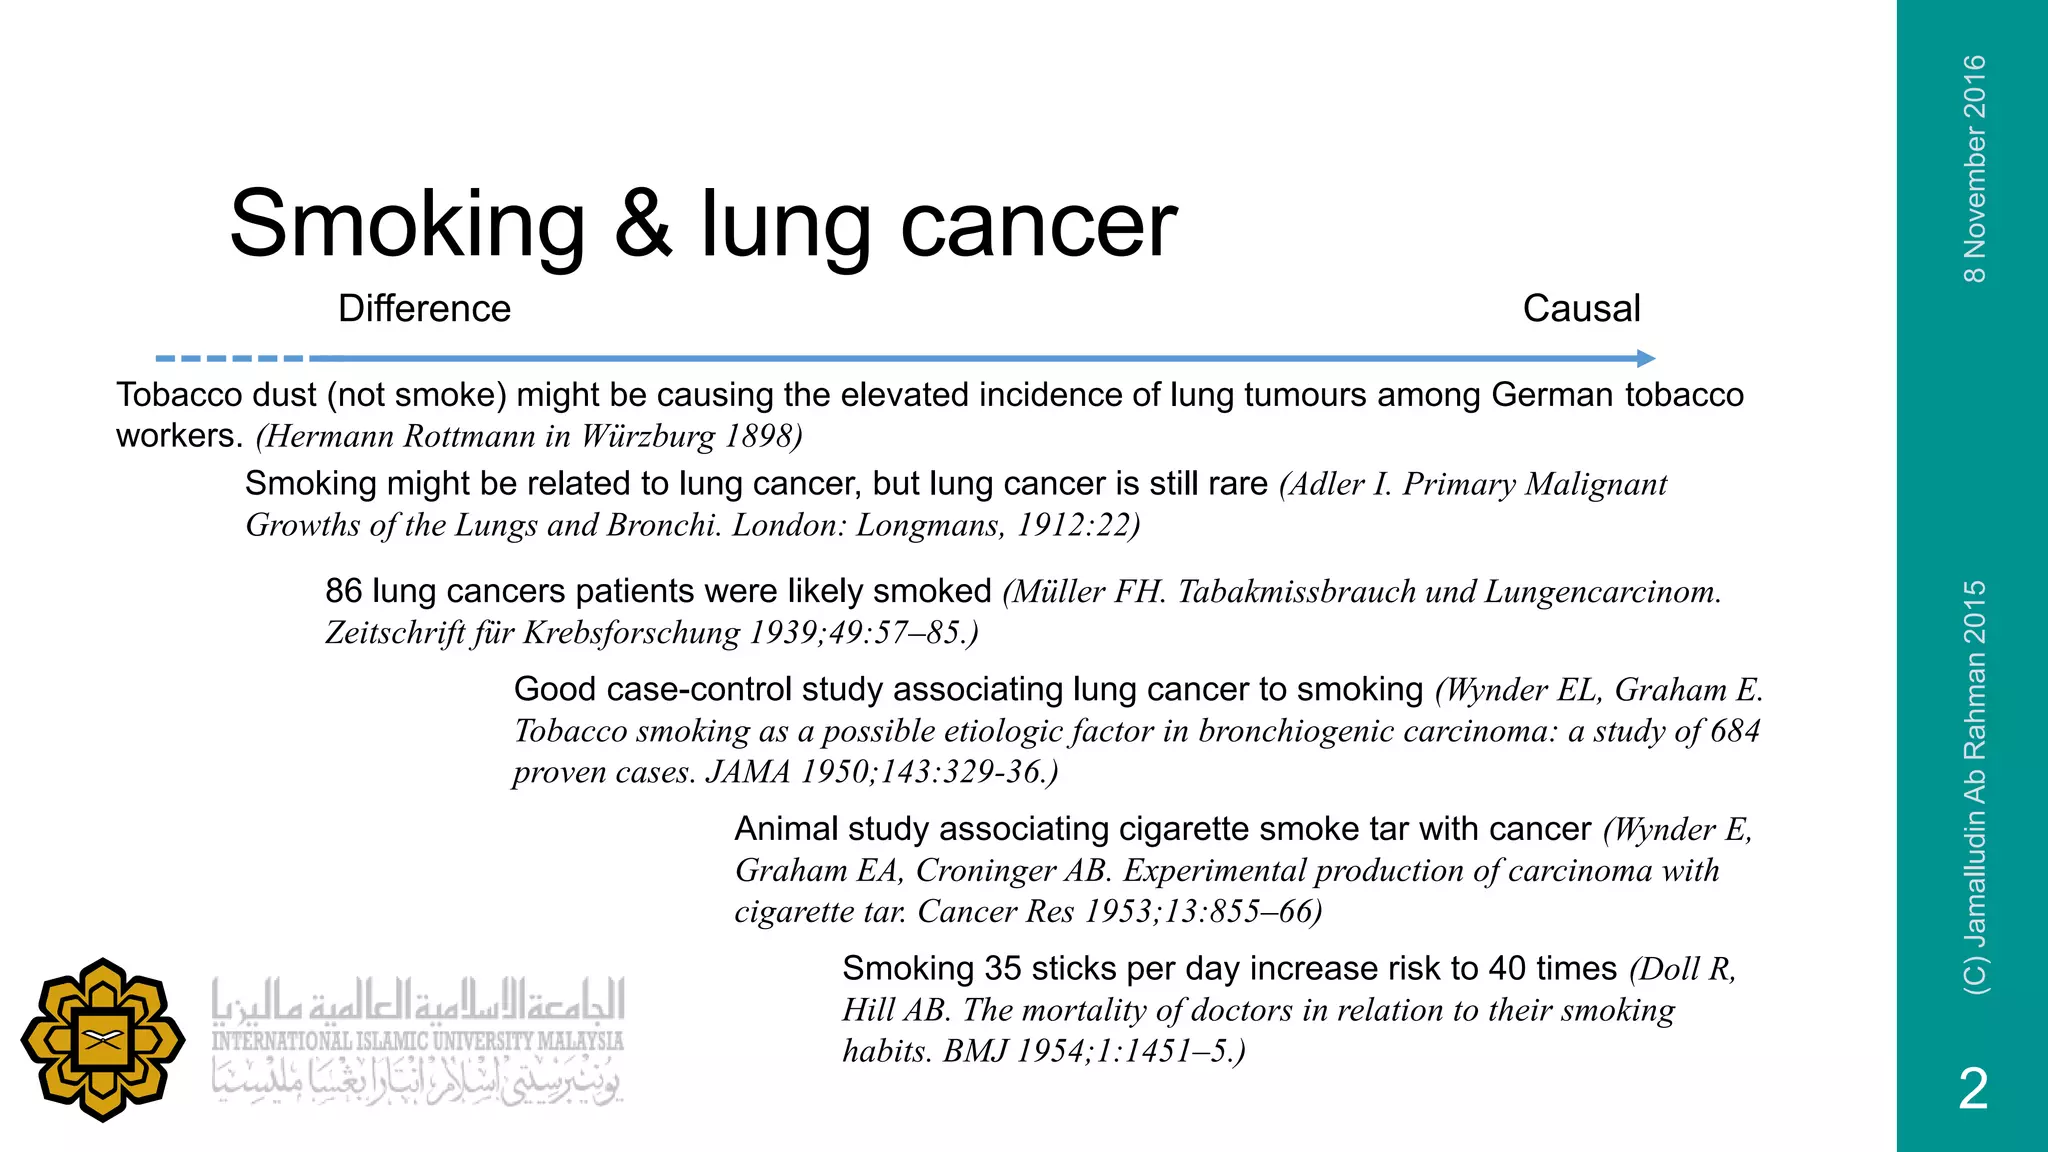
Introduction to primary variables in analysis including outcome, exposure, effect modifiers, confounders, and mediators.
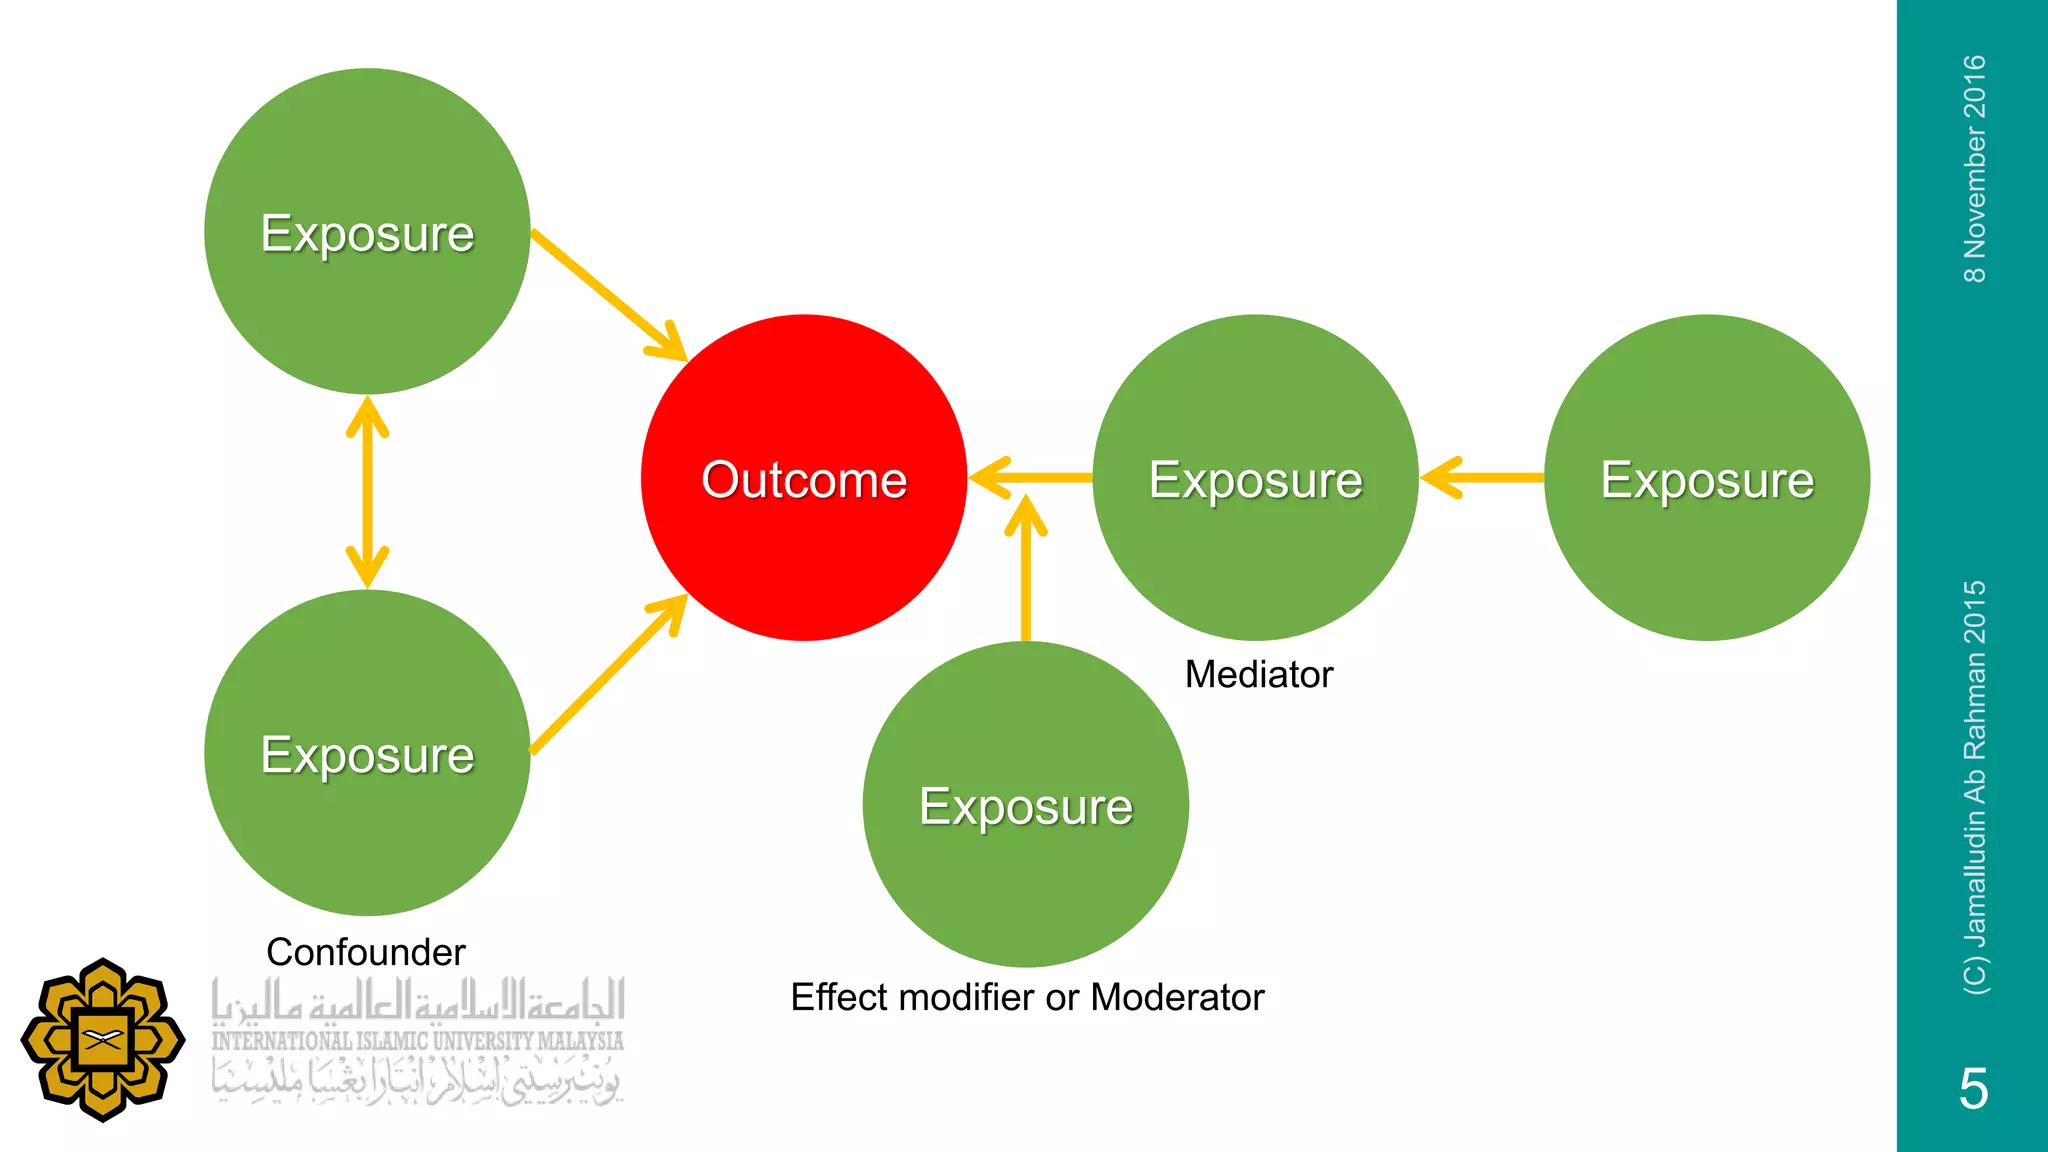
Discussion on the relationship between exercise intensity and fitness level, questioning differences between intensities.
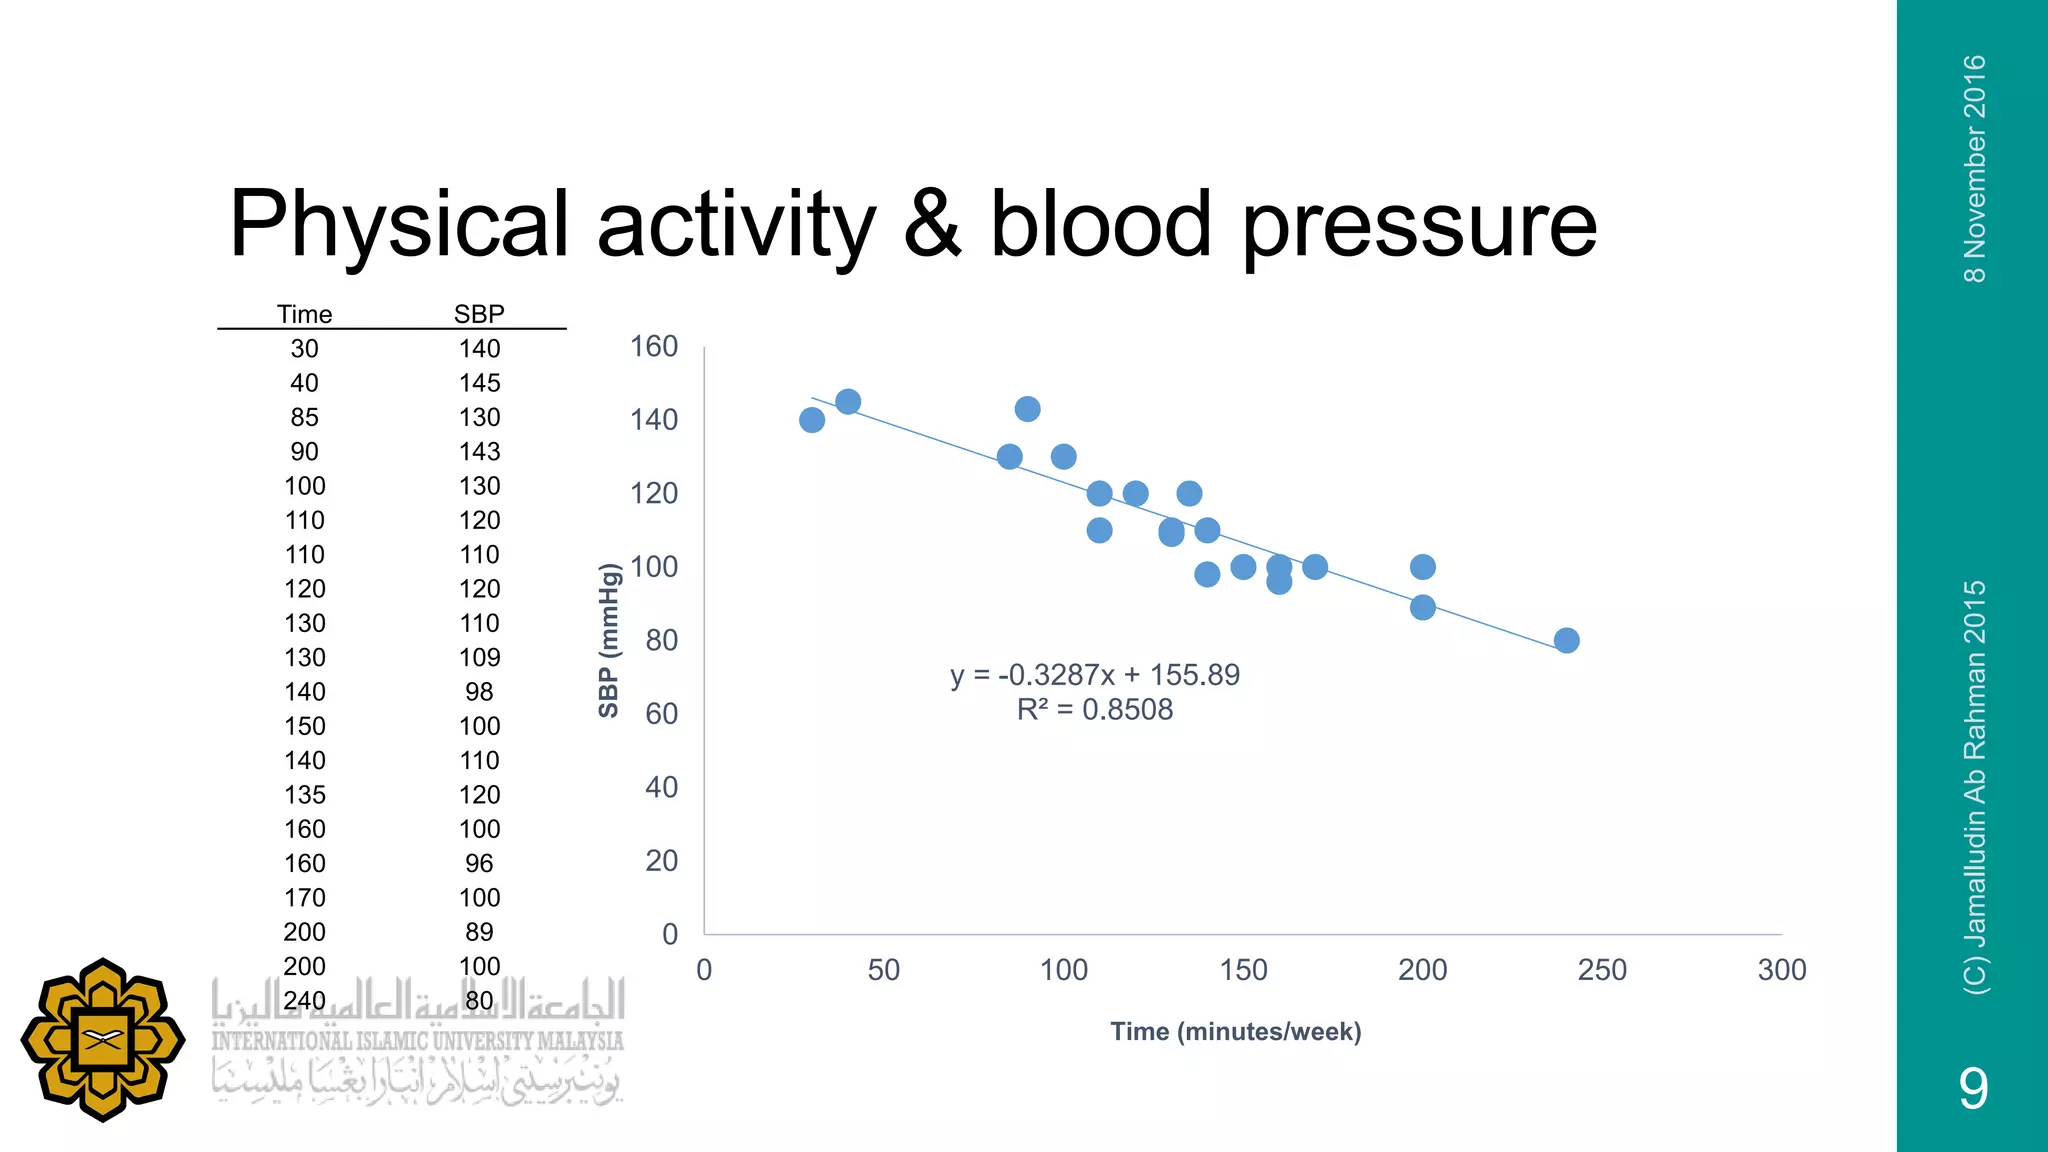
Presentation of data showing the relationship between physical activity time and systolic blood pressure (SBP) with a regression line.
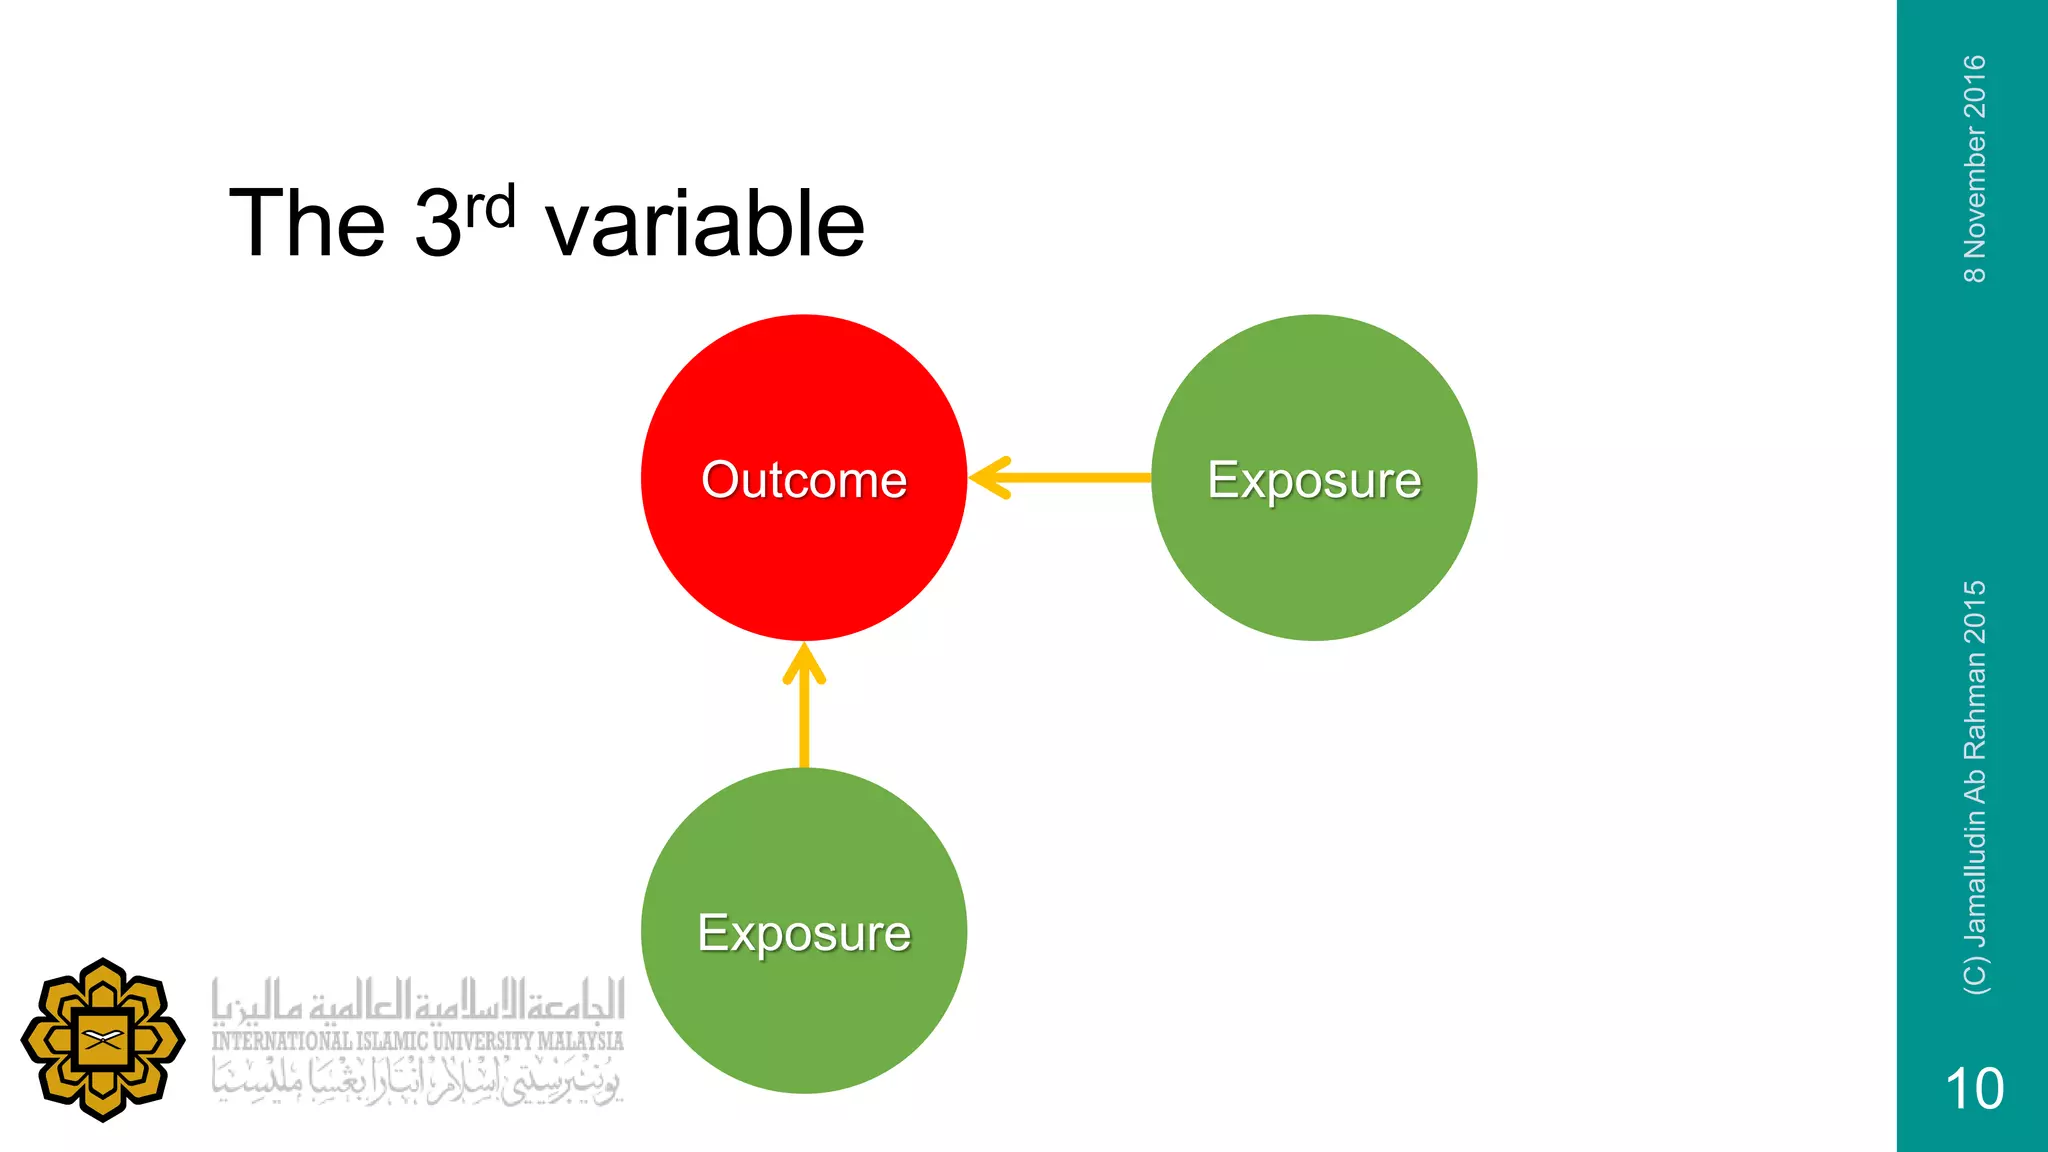
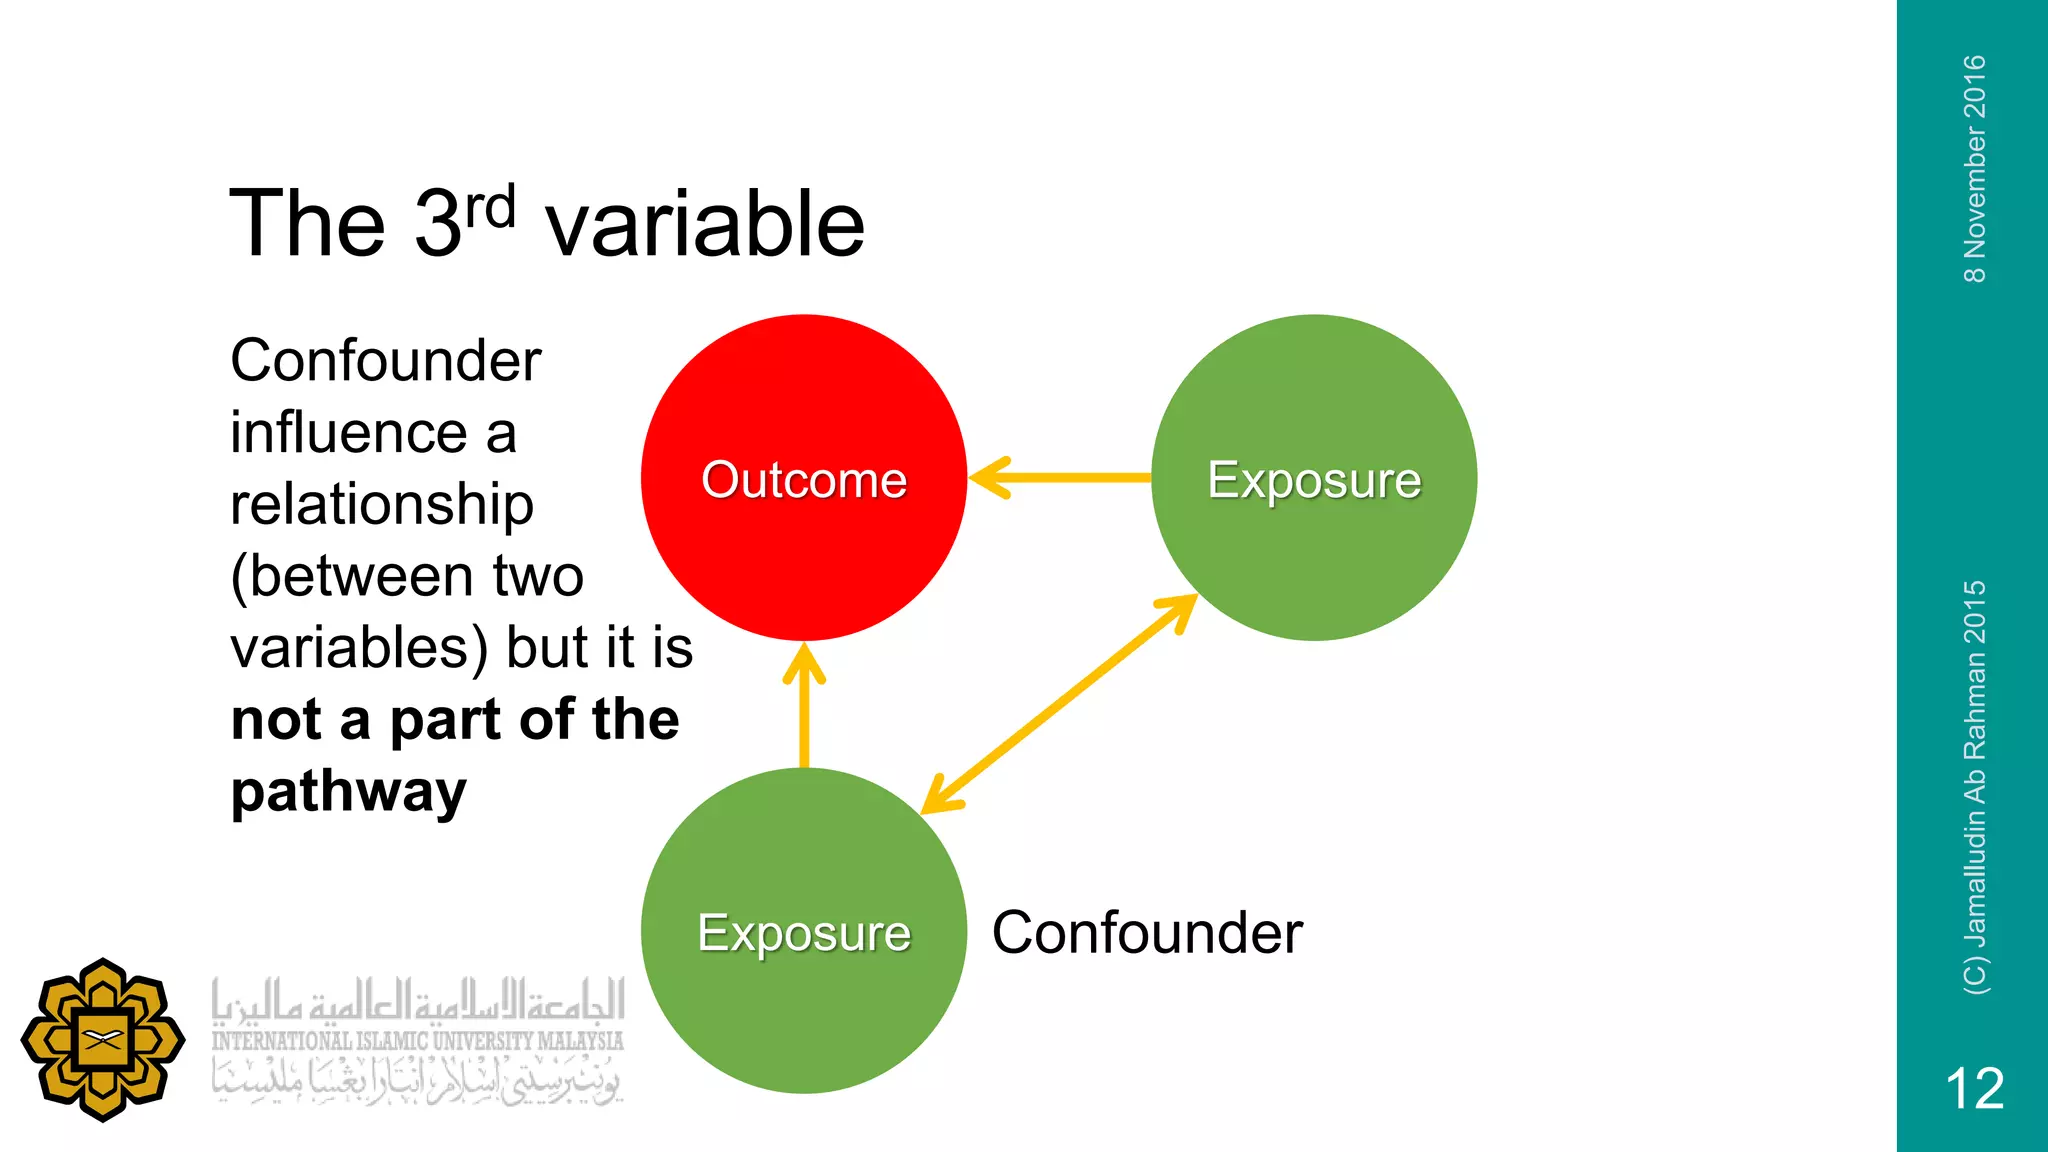
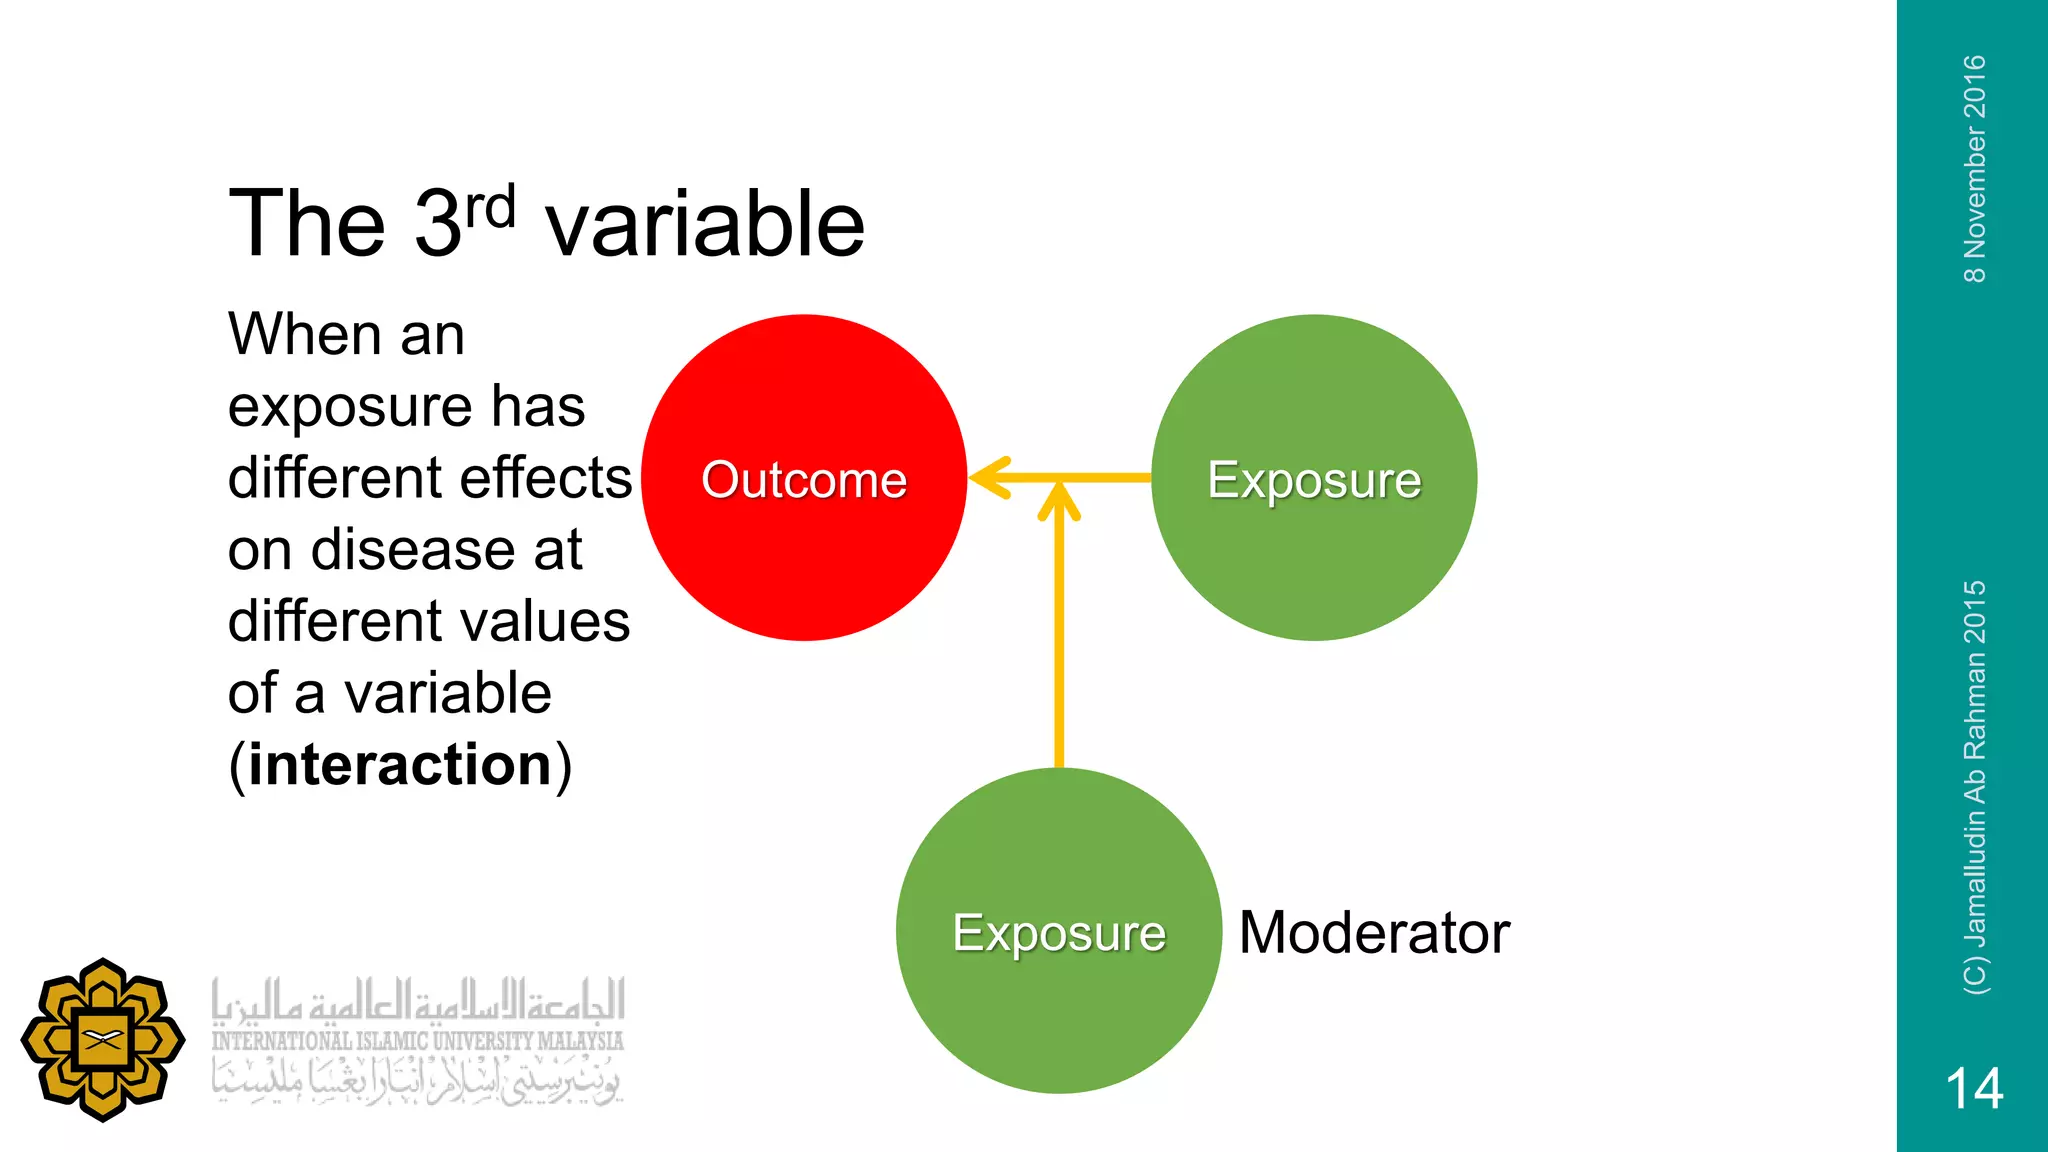
Discussion of how third variables can affect the relationship between two variables.
Identification of third variable types: confounder, mediator, and moderator.
Definition of a moderator variable that affects the strength of a relationship between two variables.
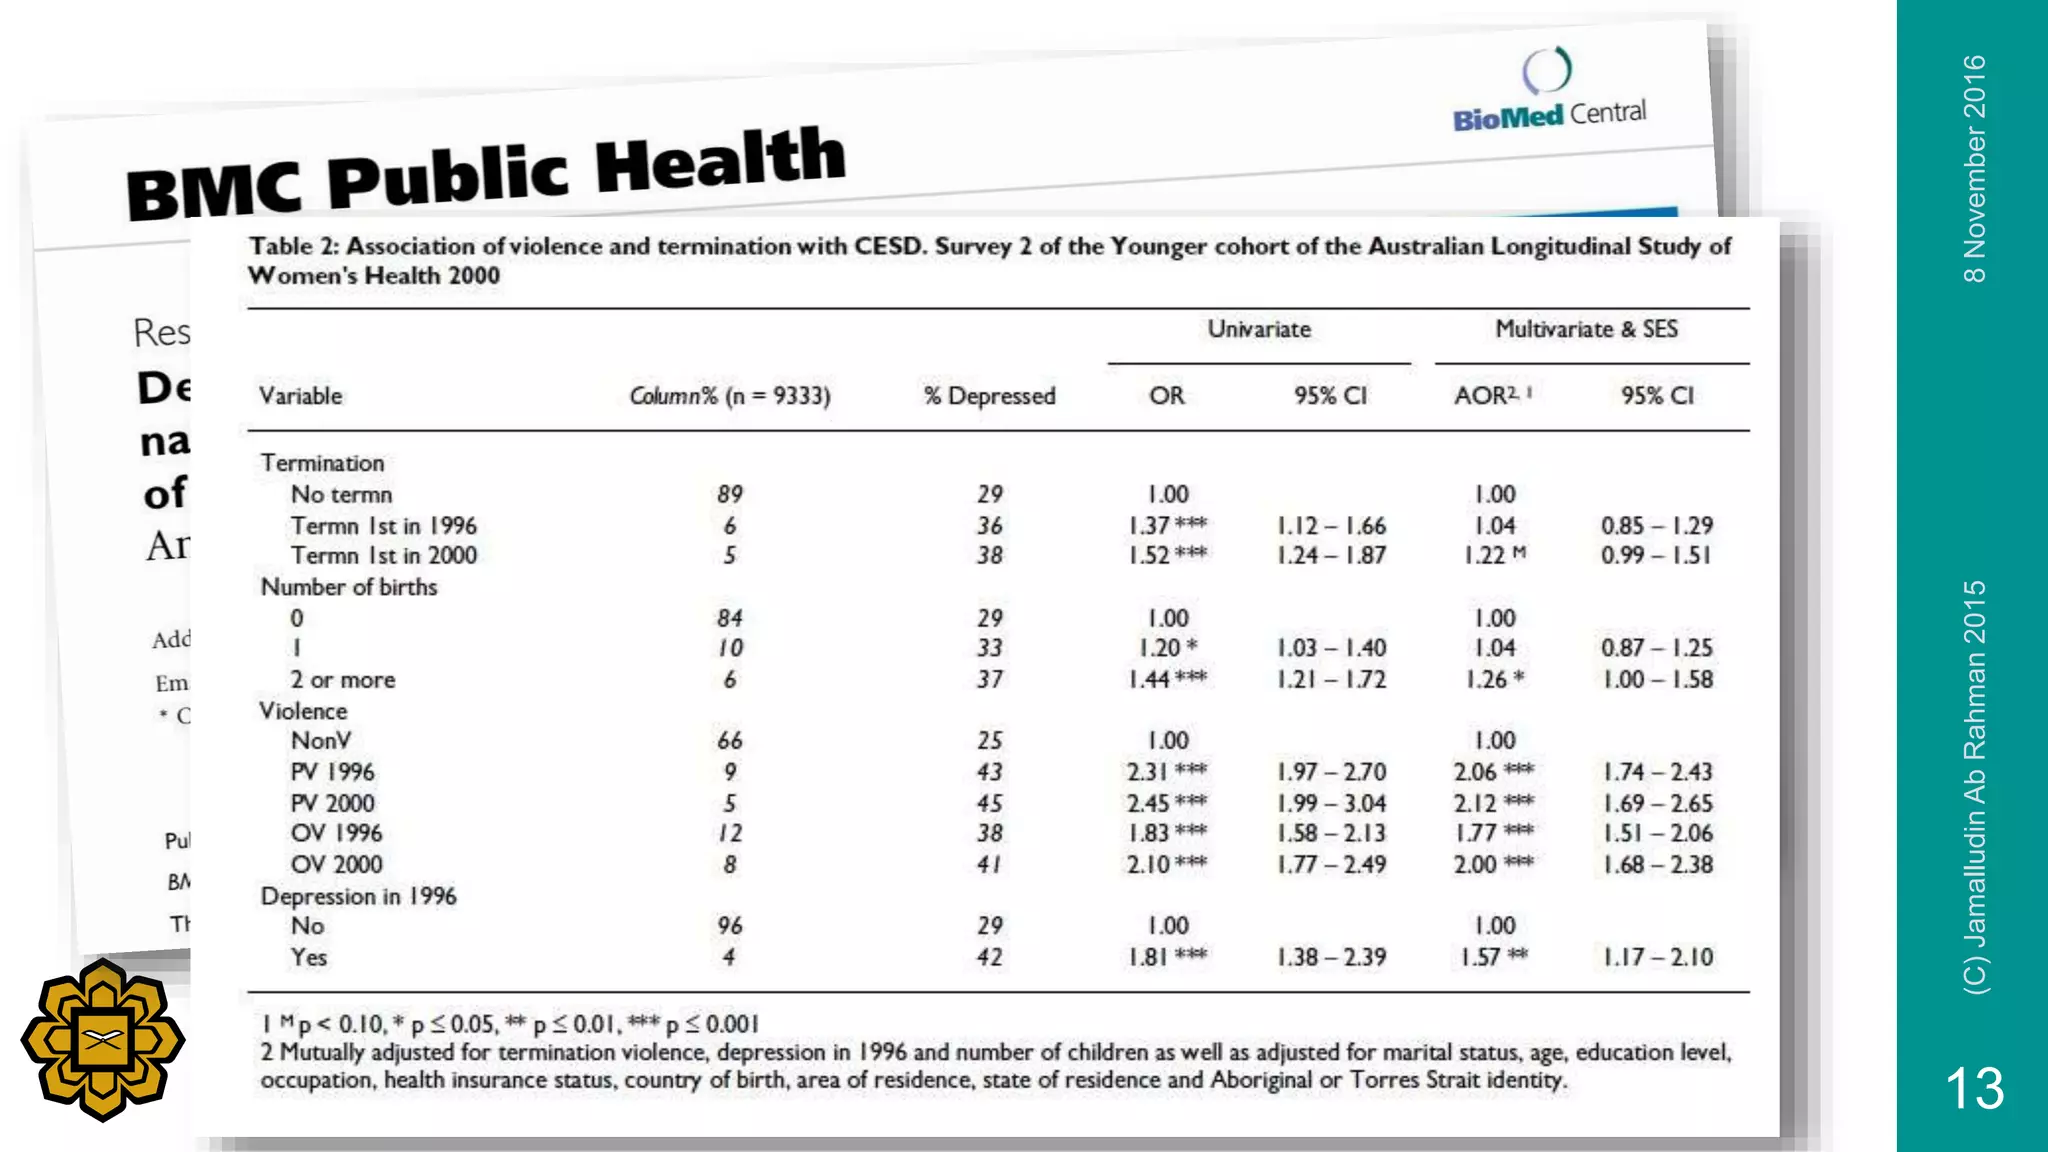
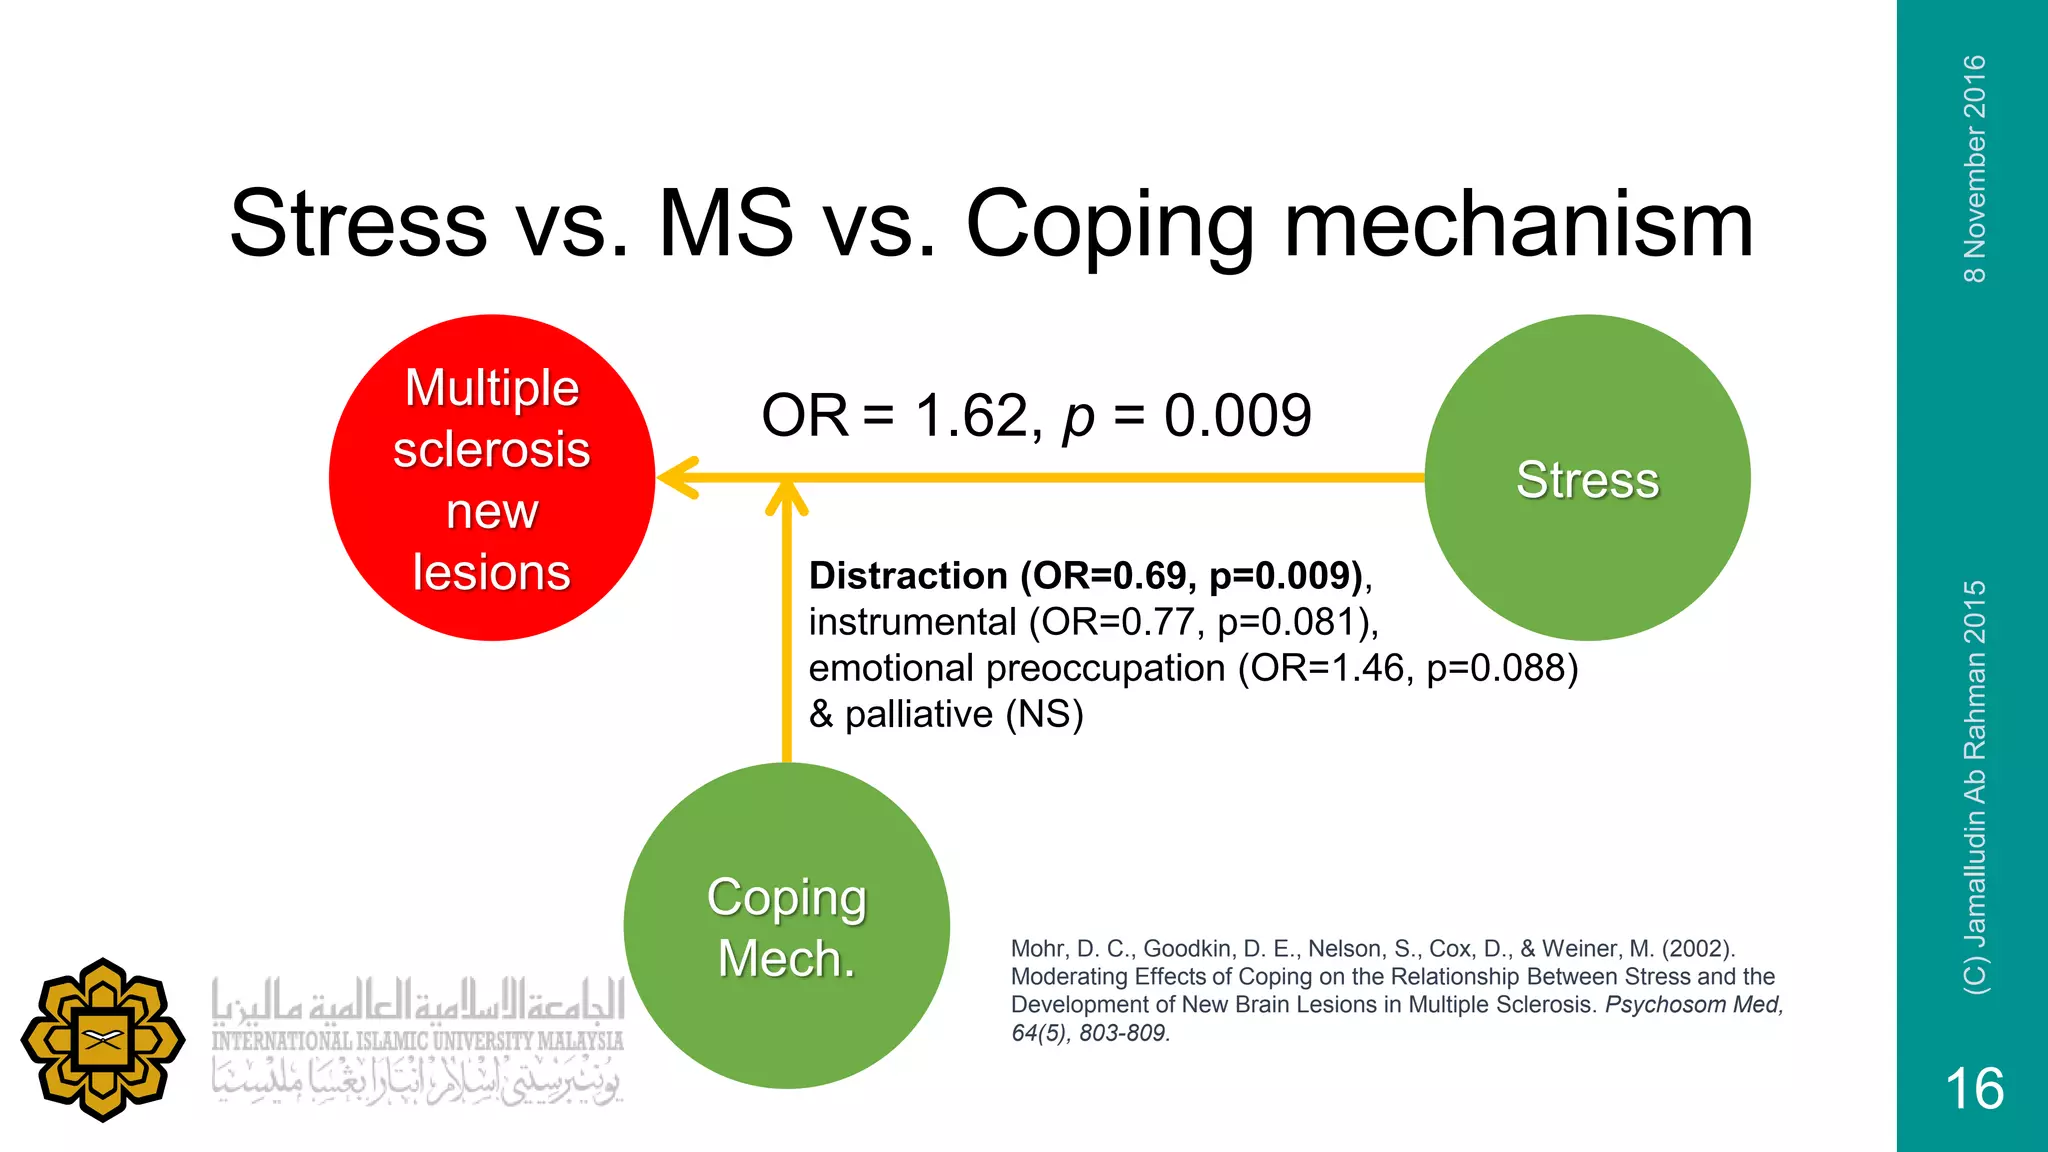
Study on the interaction of stress, coping mechanisms, and MS, presenting a statistical outcome.
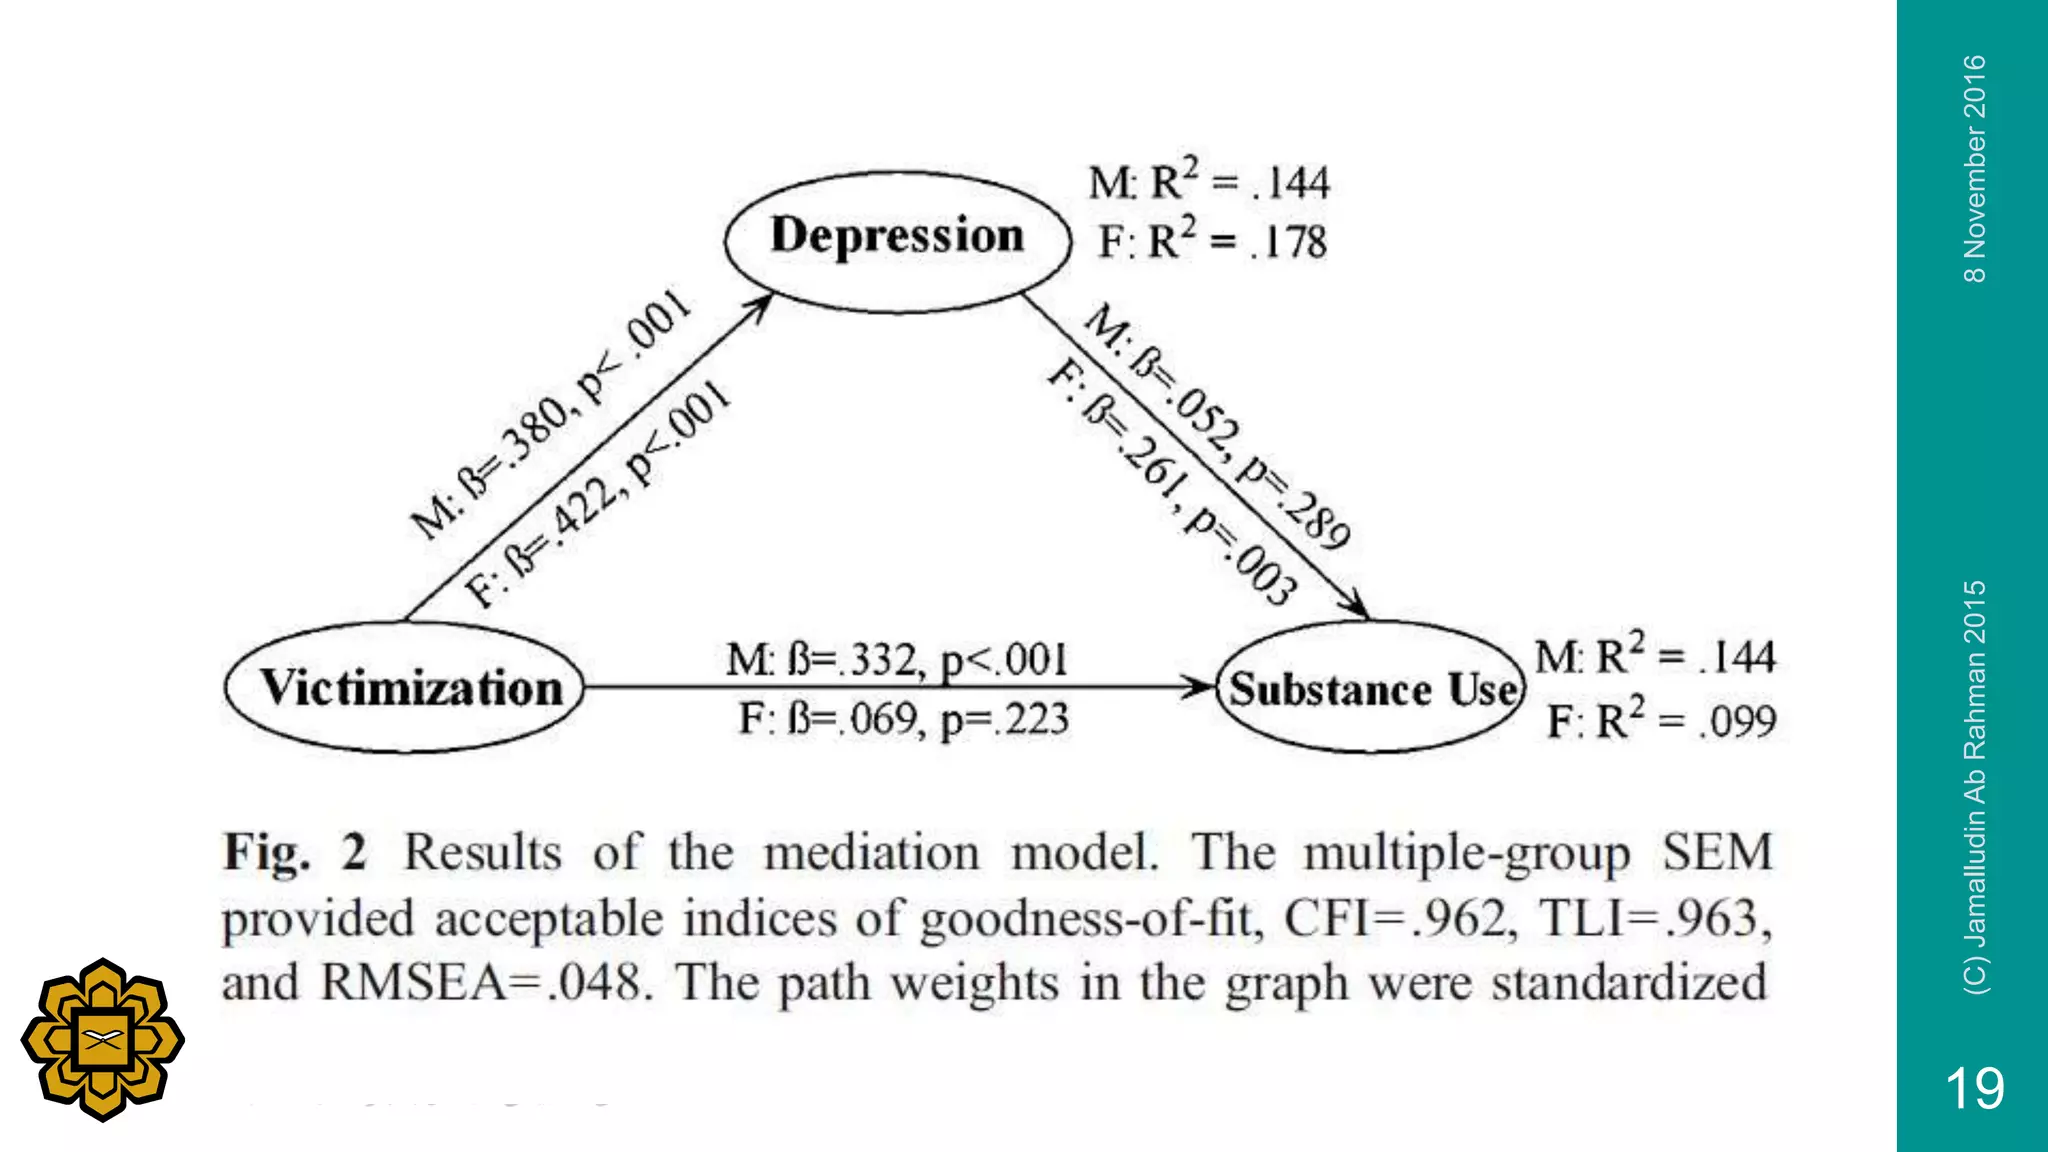
Explanation of a mediator variable which plays a role within the pathway of the relationship.
Reasons for utilizing multivariate analysis, focusing on multiple factors and exploring associations.
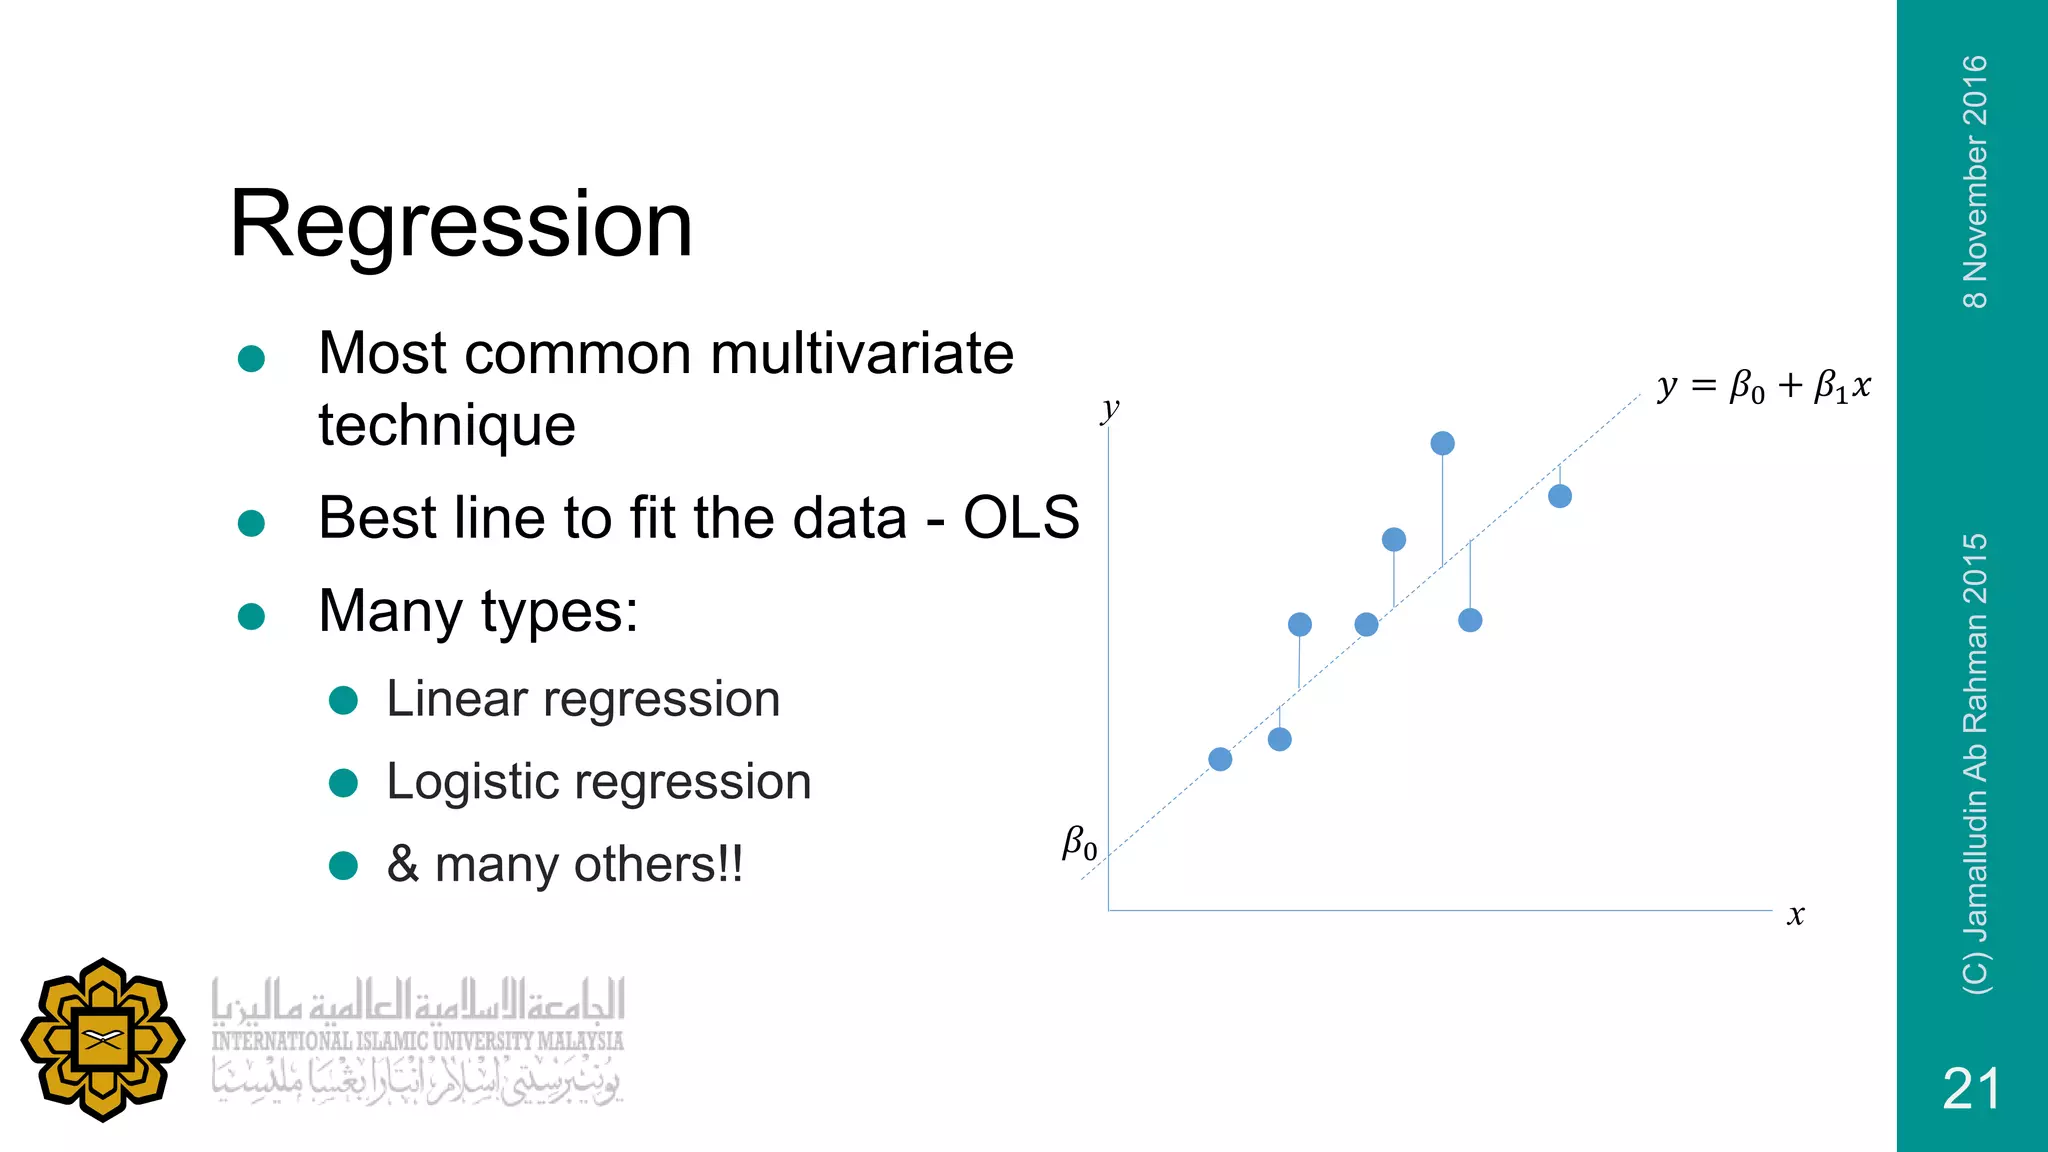
Overview of regression as a common multivariate technique including types like linear and logistic regression.
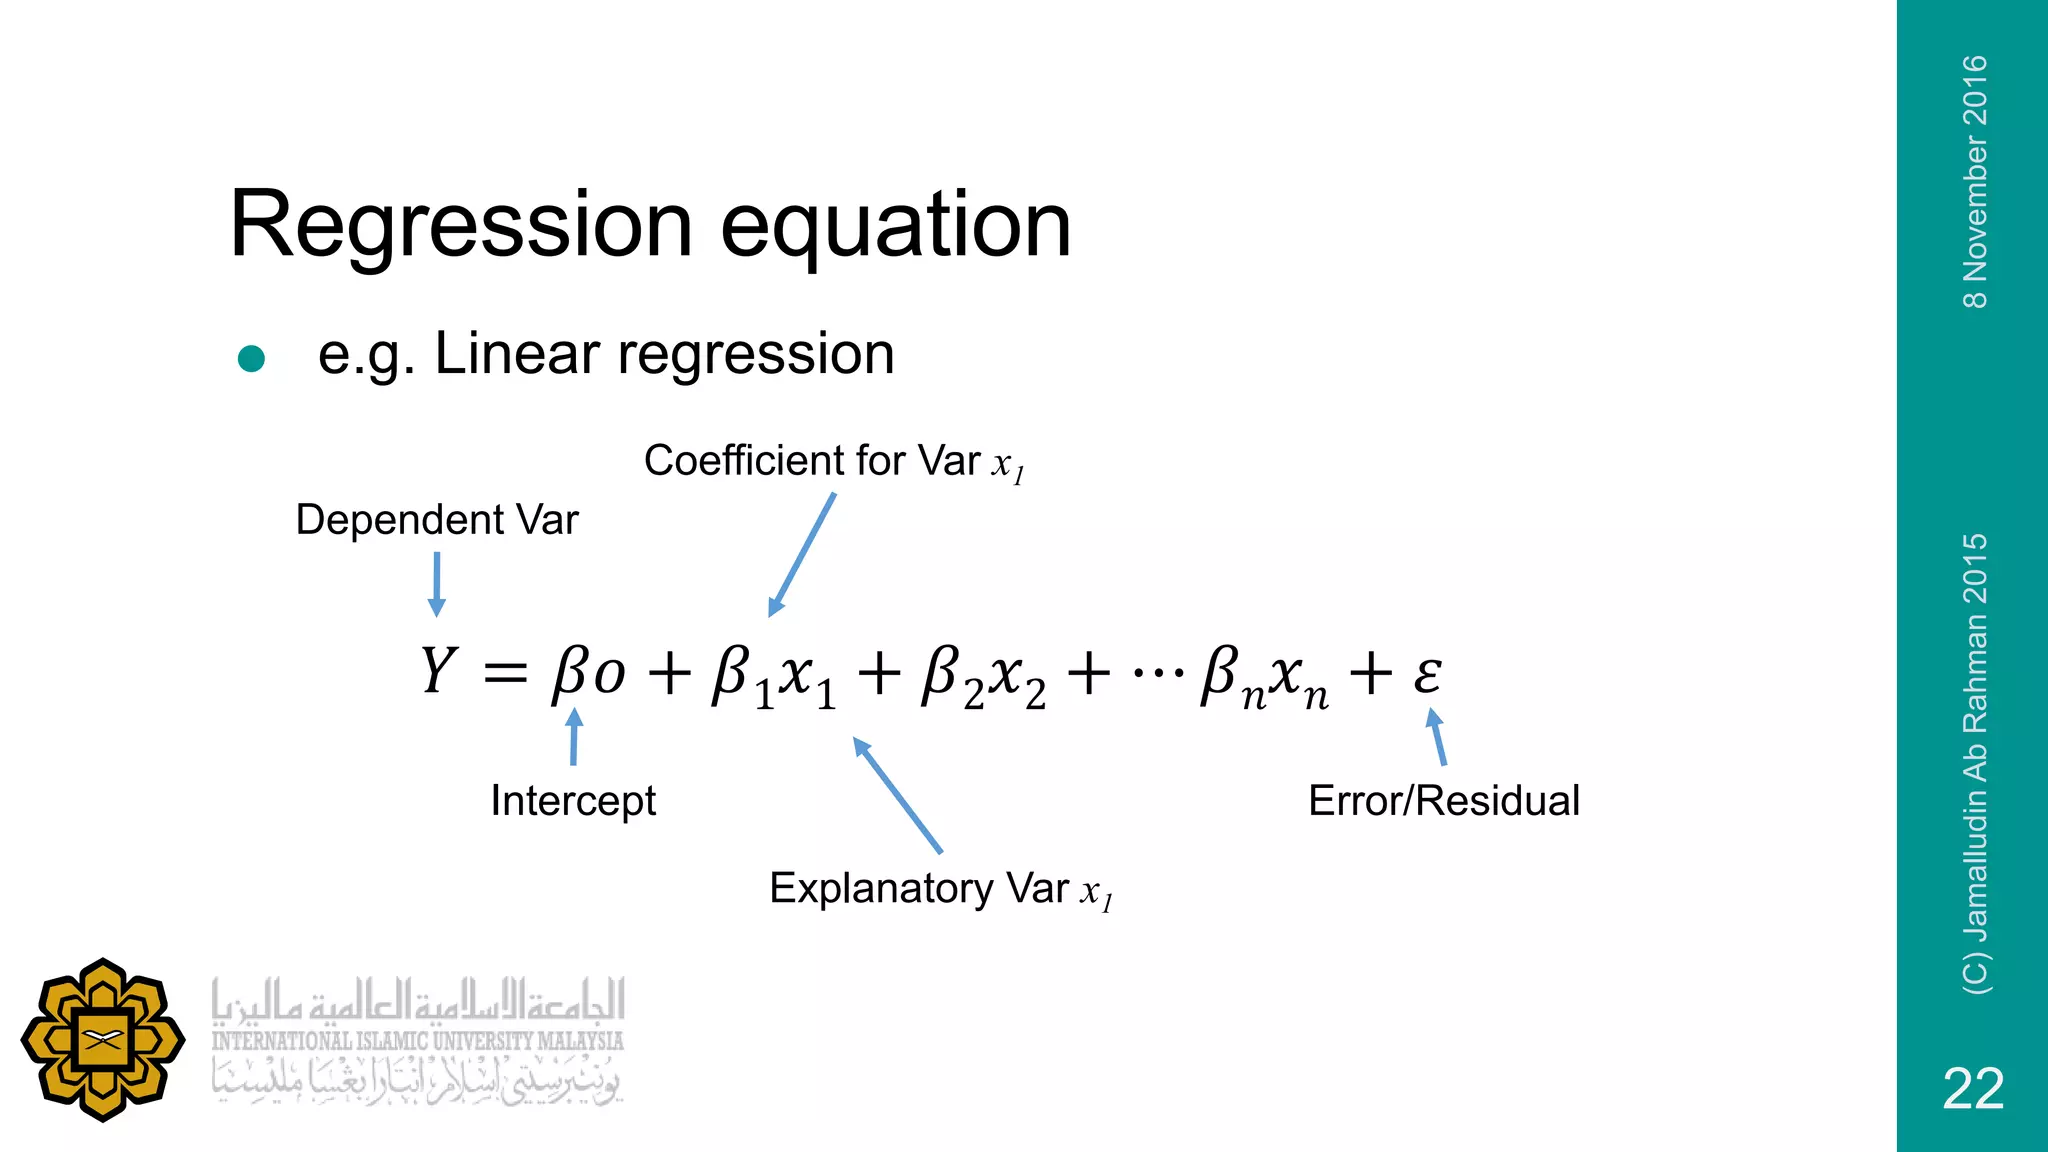
Introduction to the structure of regression equations including dependent and independent variables.
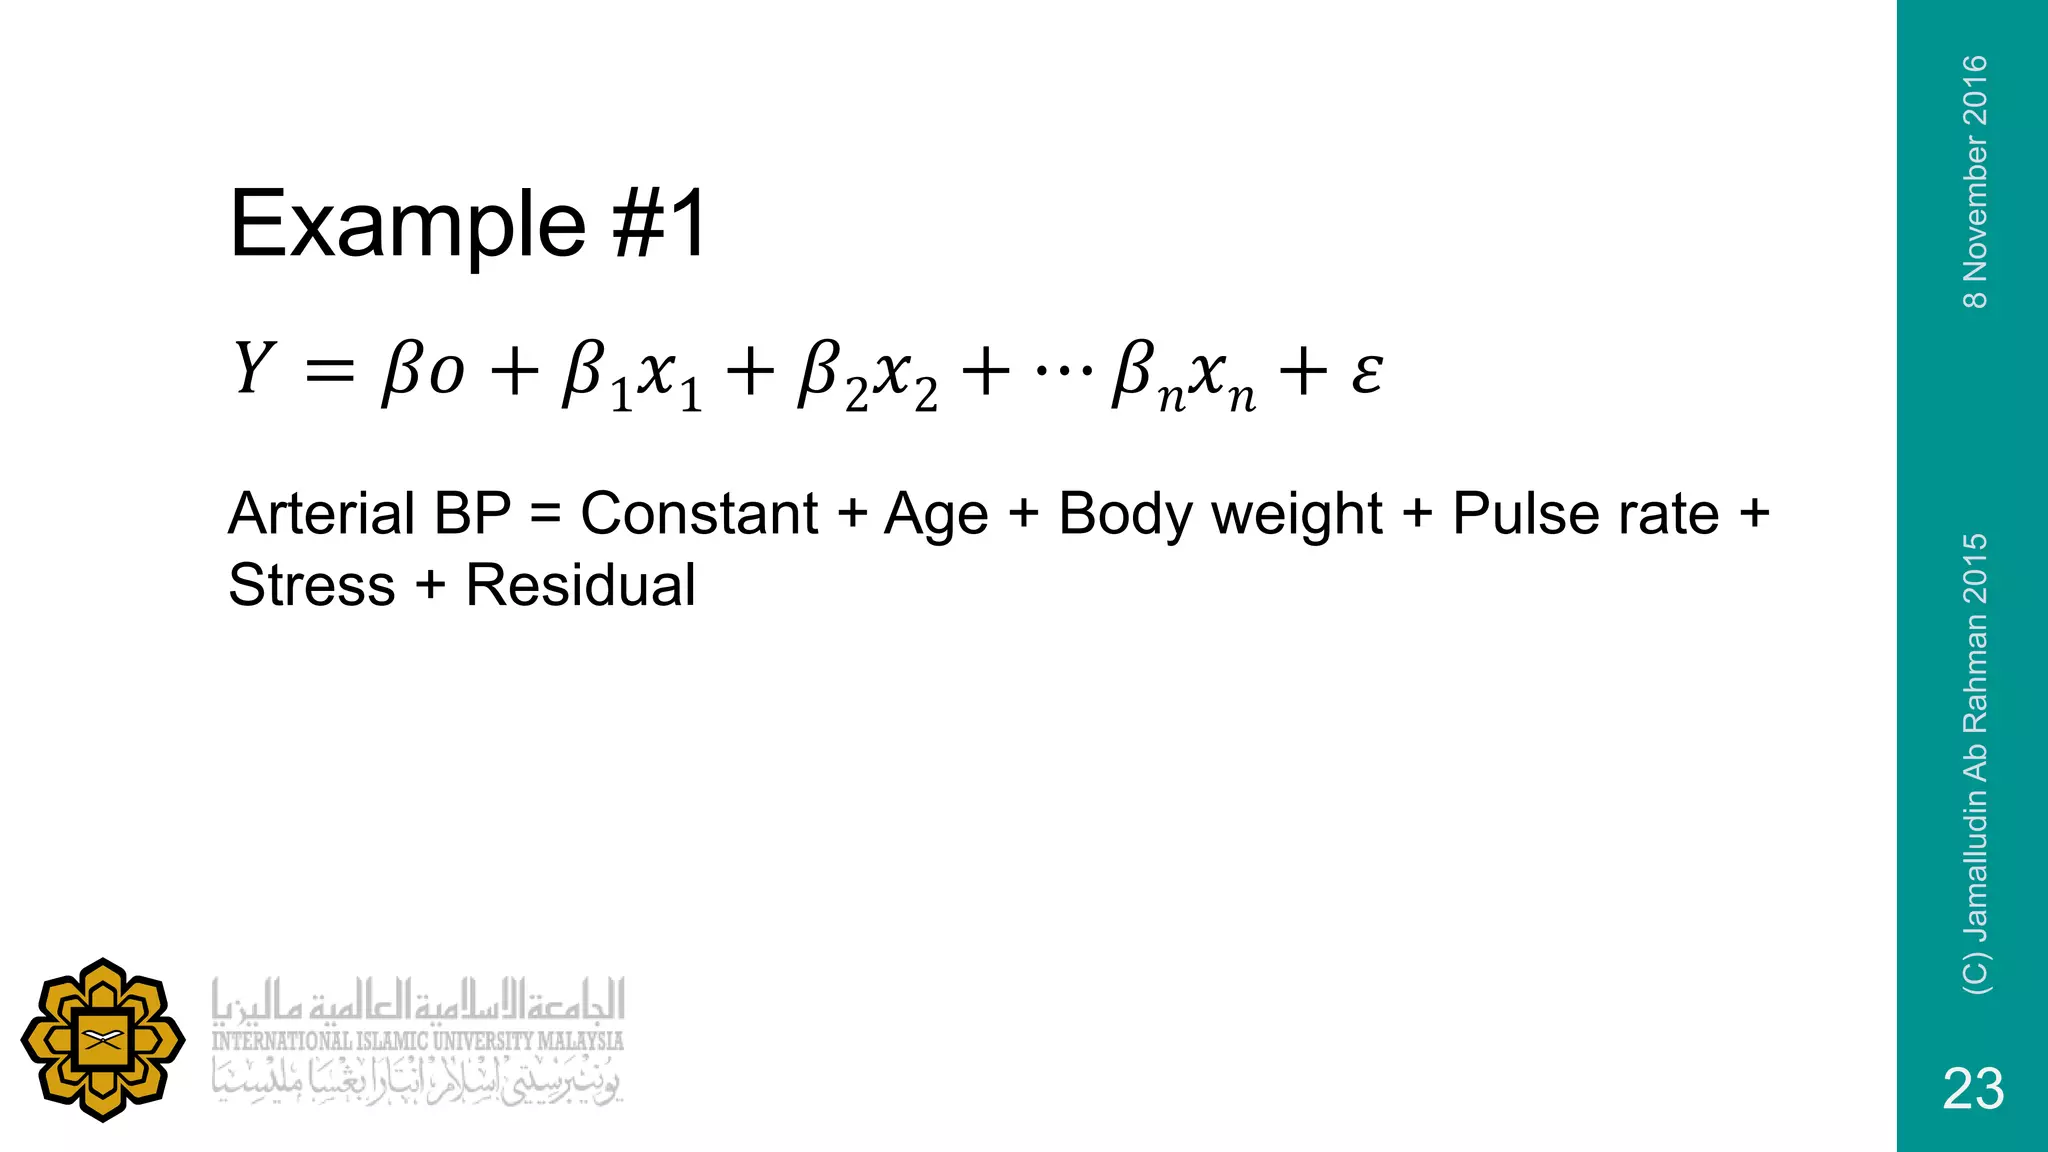
Example illustrating how arterial blood pressure can be modeled using multiple variables.
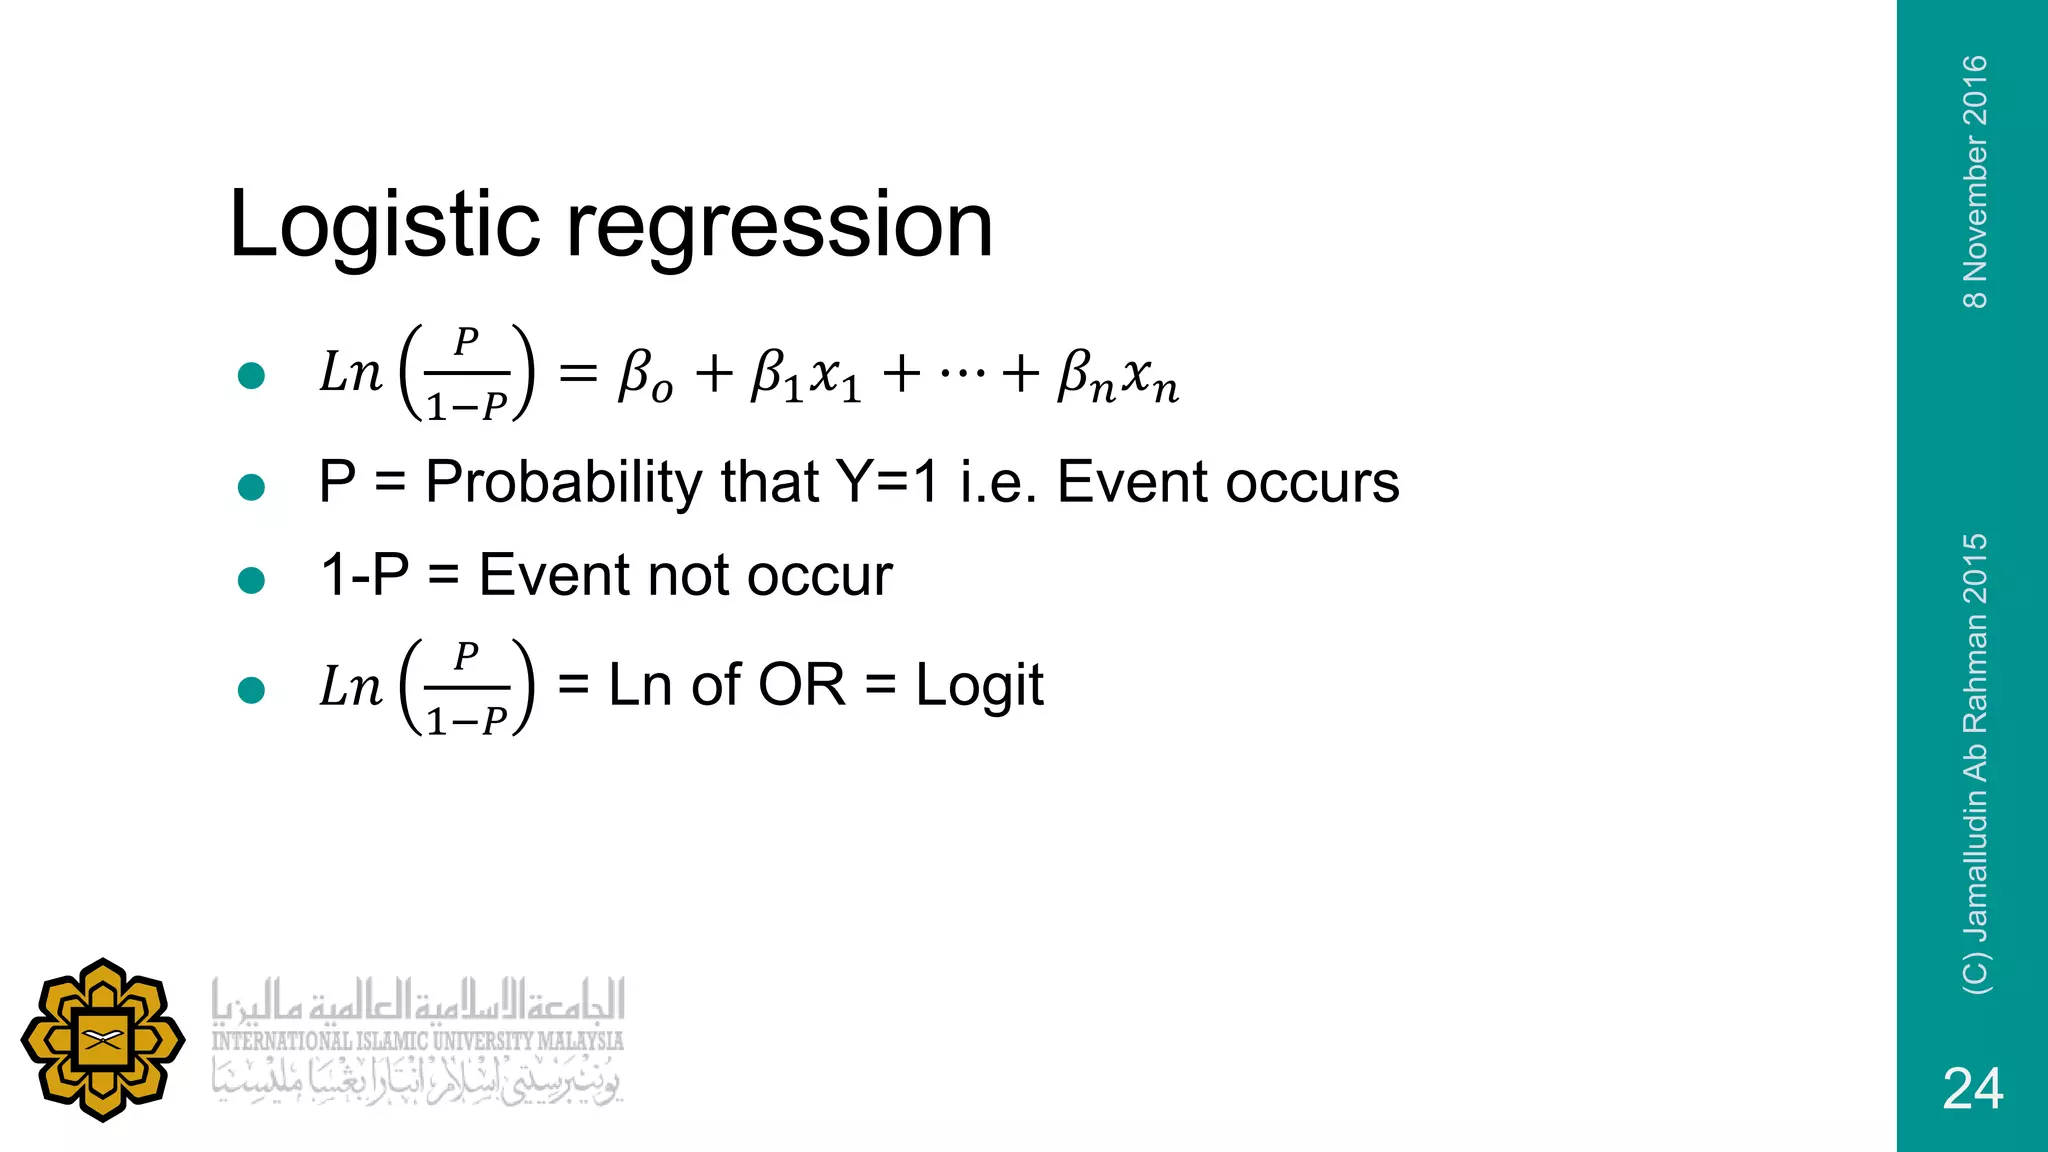
Introduction to logistic regression, its equation, and its application in predicting events.
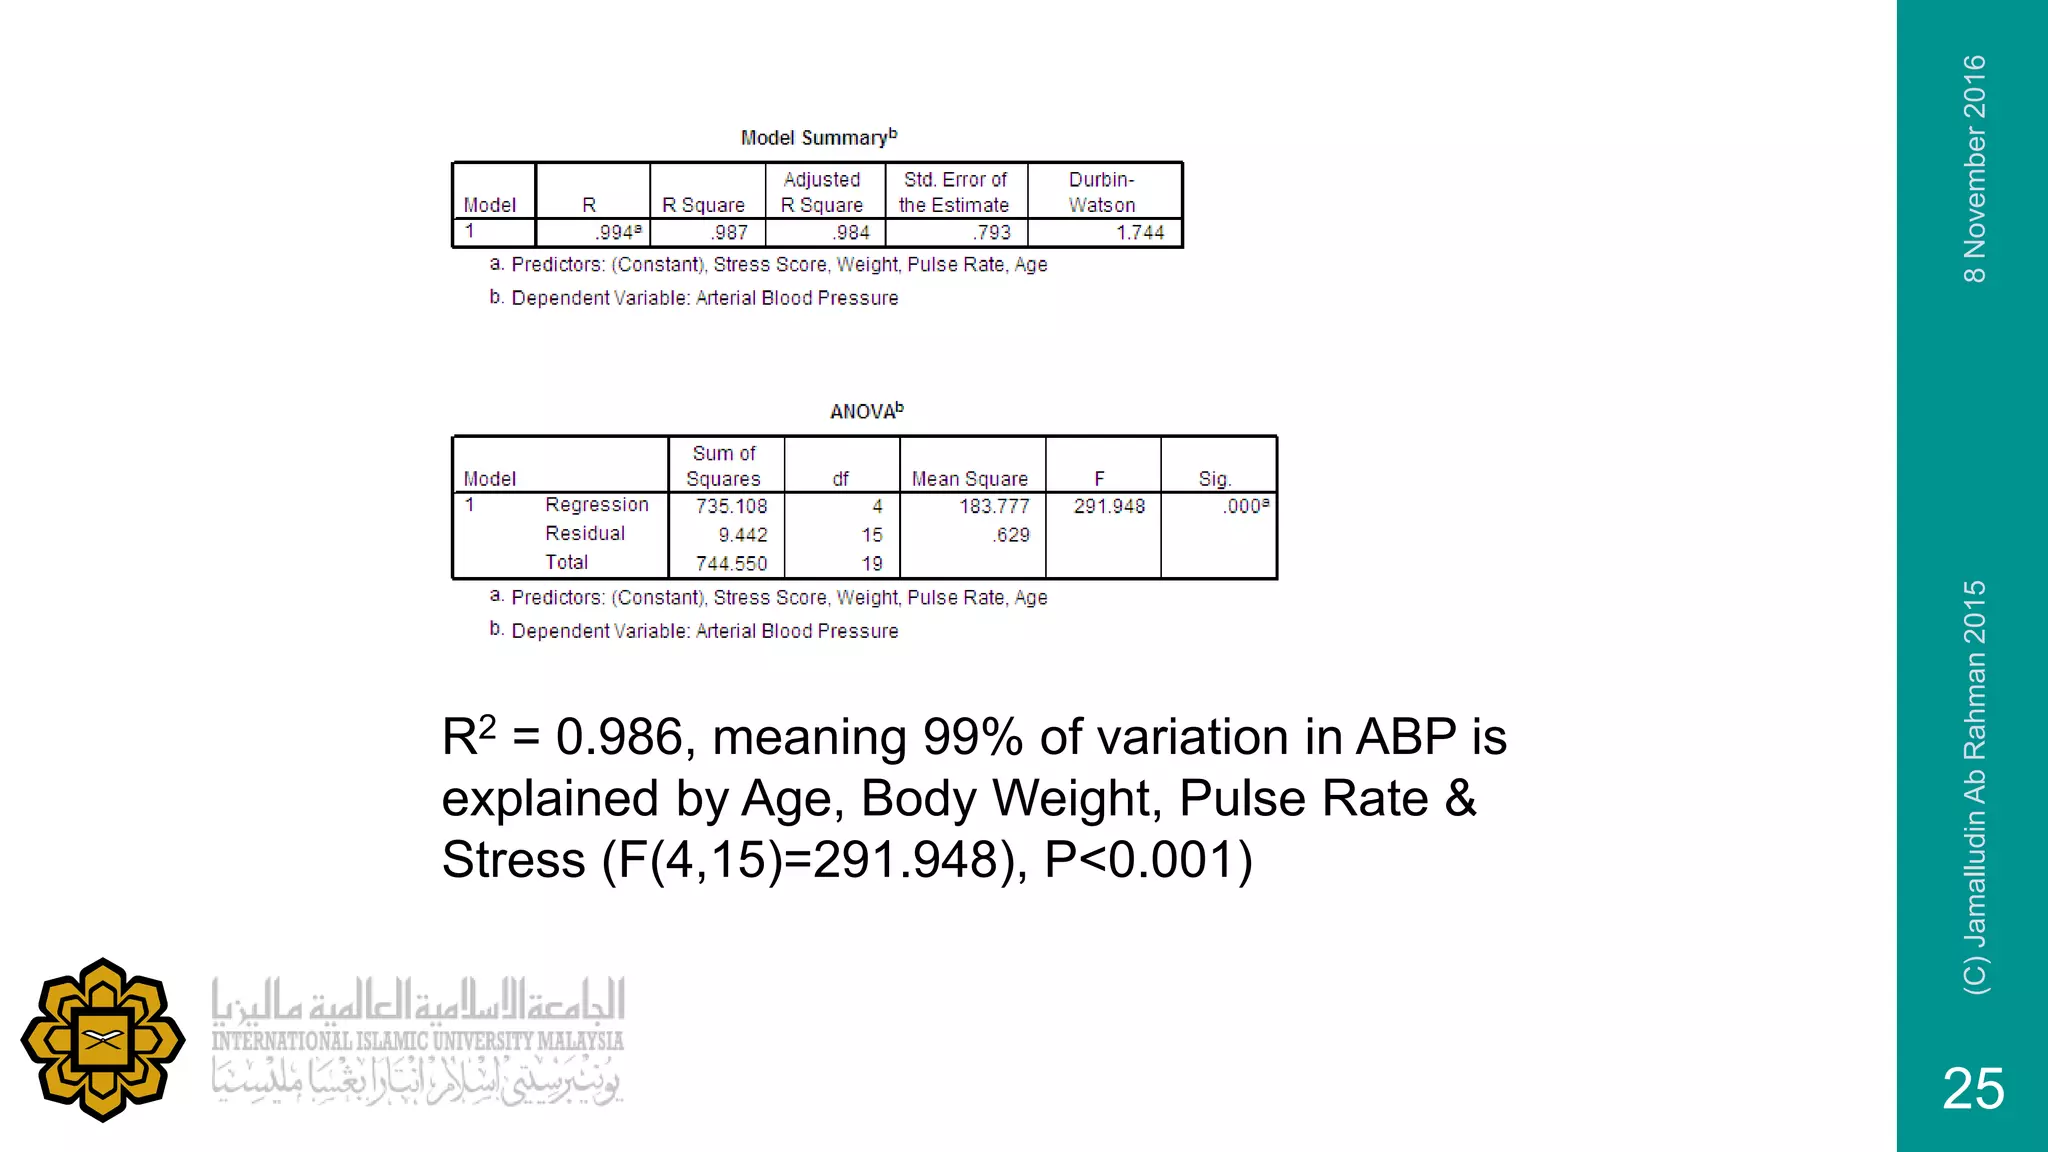
Interpretation of R-squared in relation to arterial blood pressure and its influencing factors.
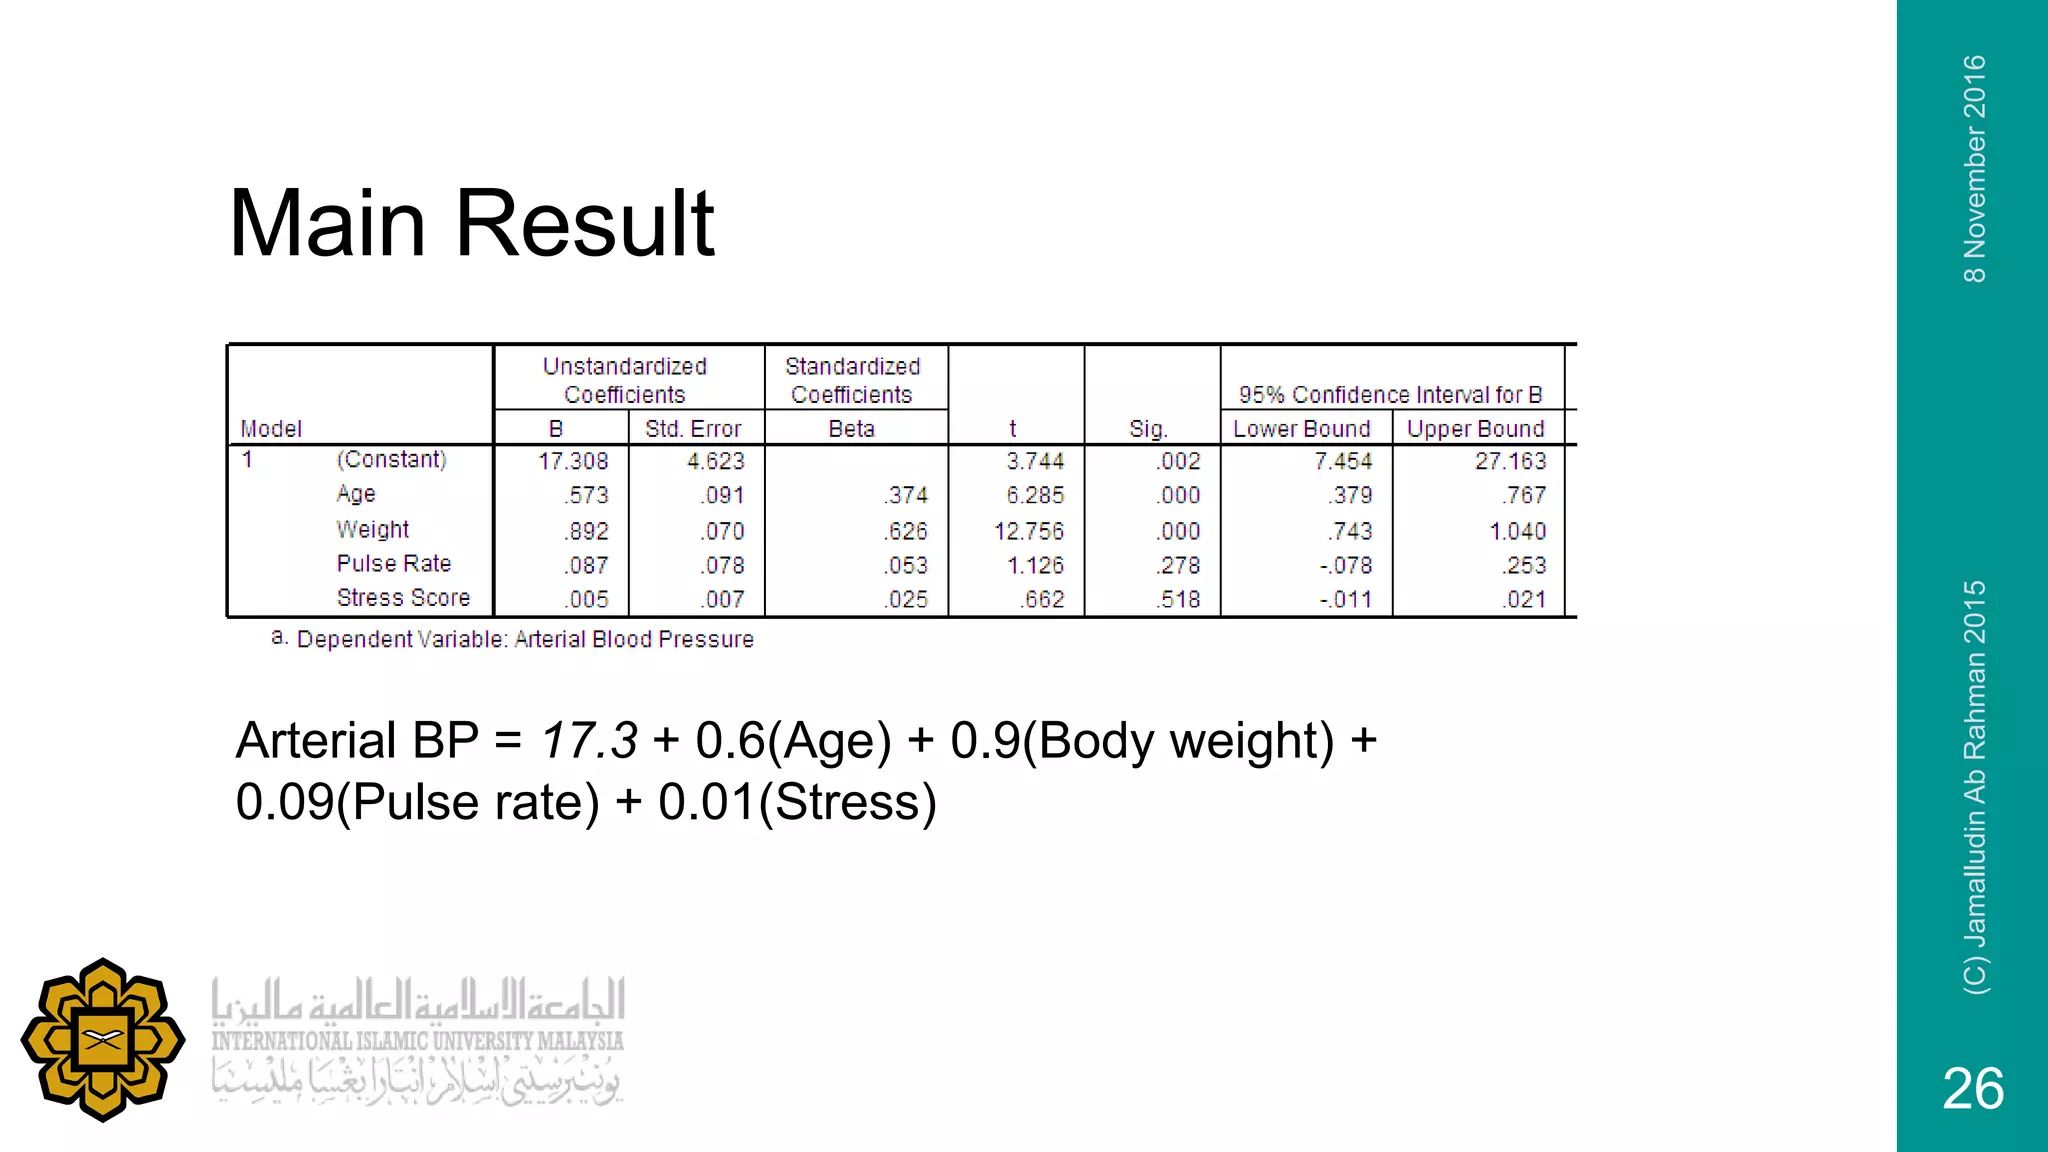
Presentation of the main regression equation explaining arterial blood pressure.
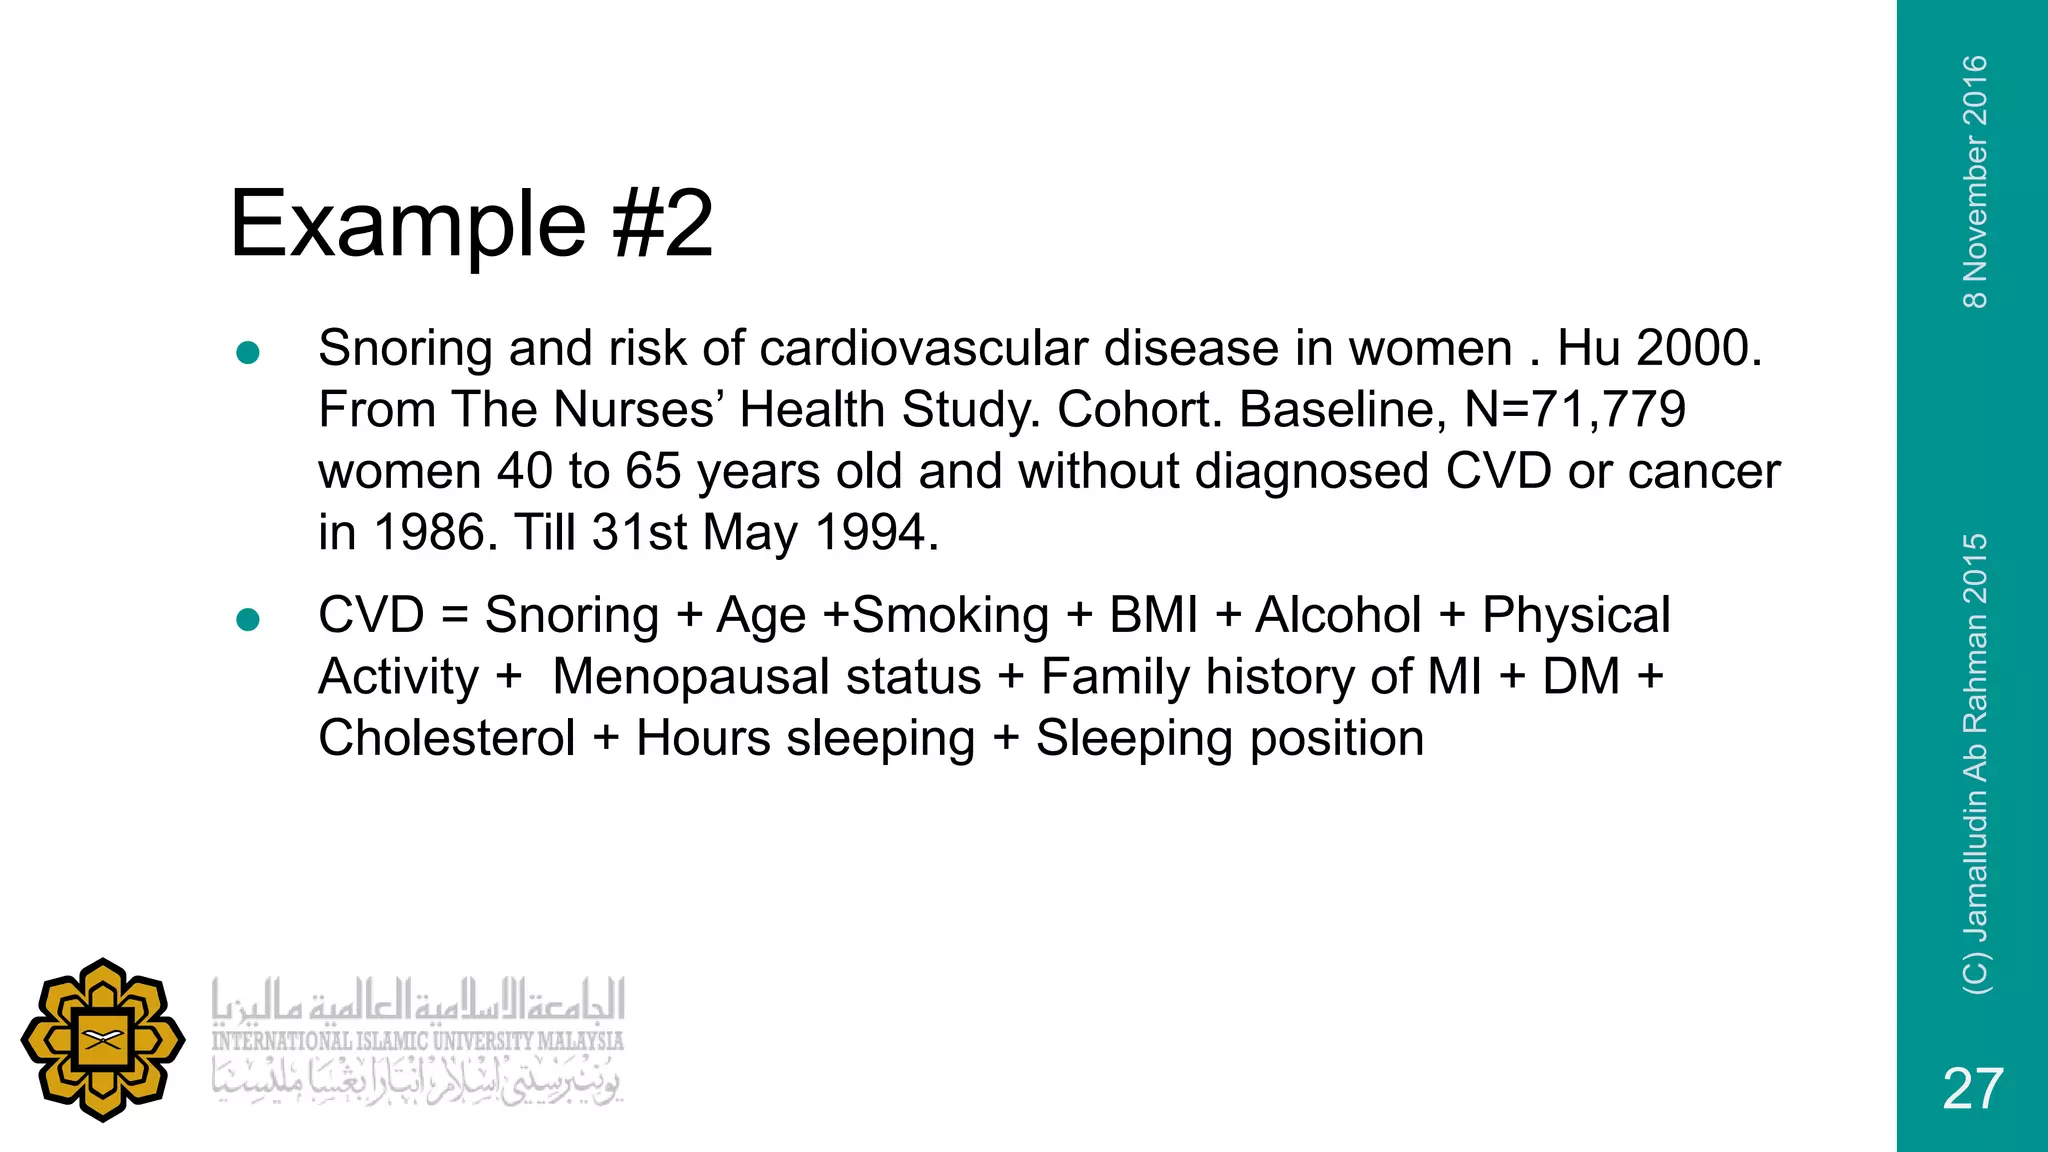
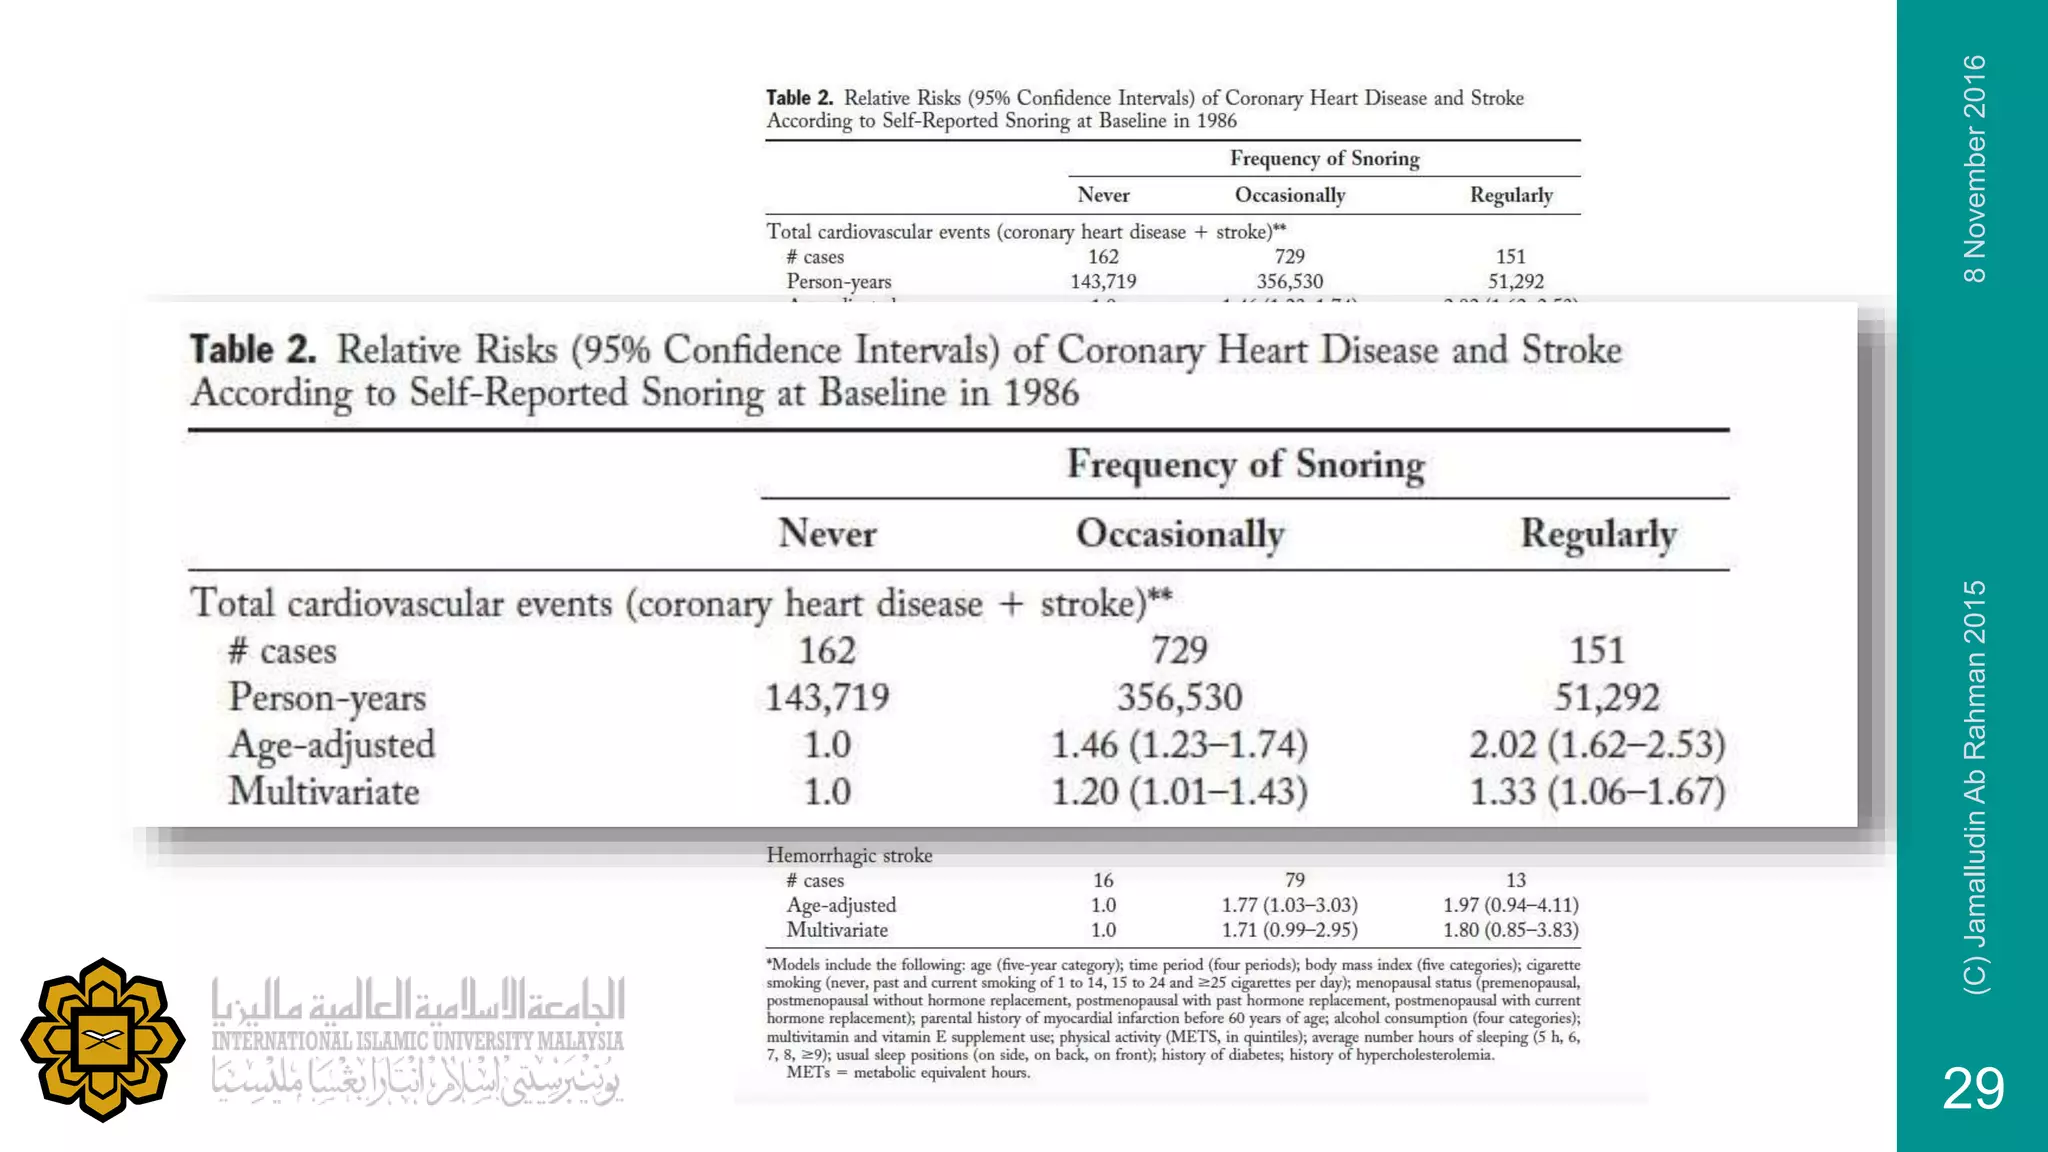
Study example linking snoring to cardiovascular disease in women with multiple variables influencing risk.
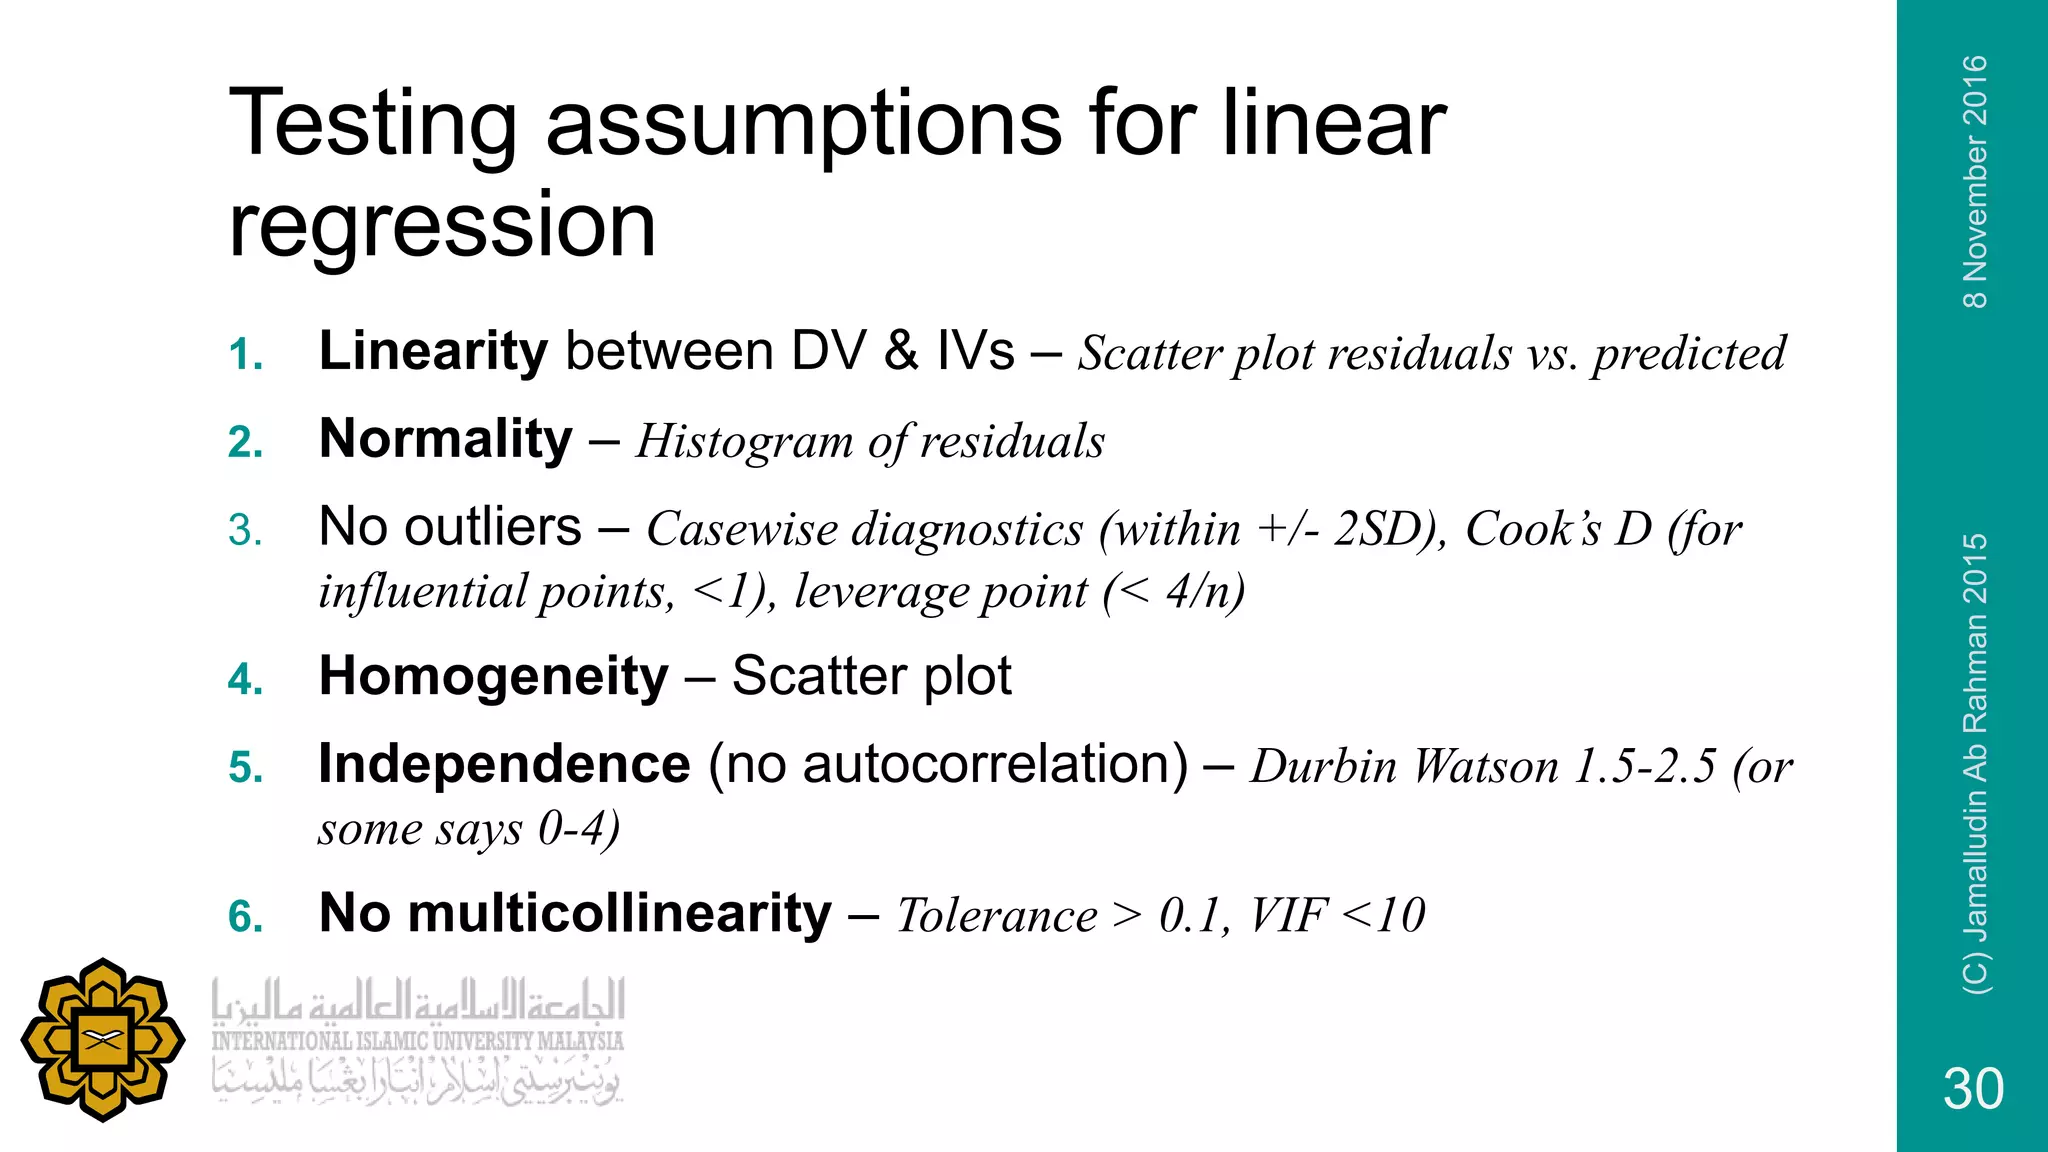
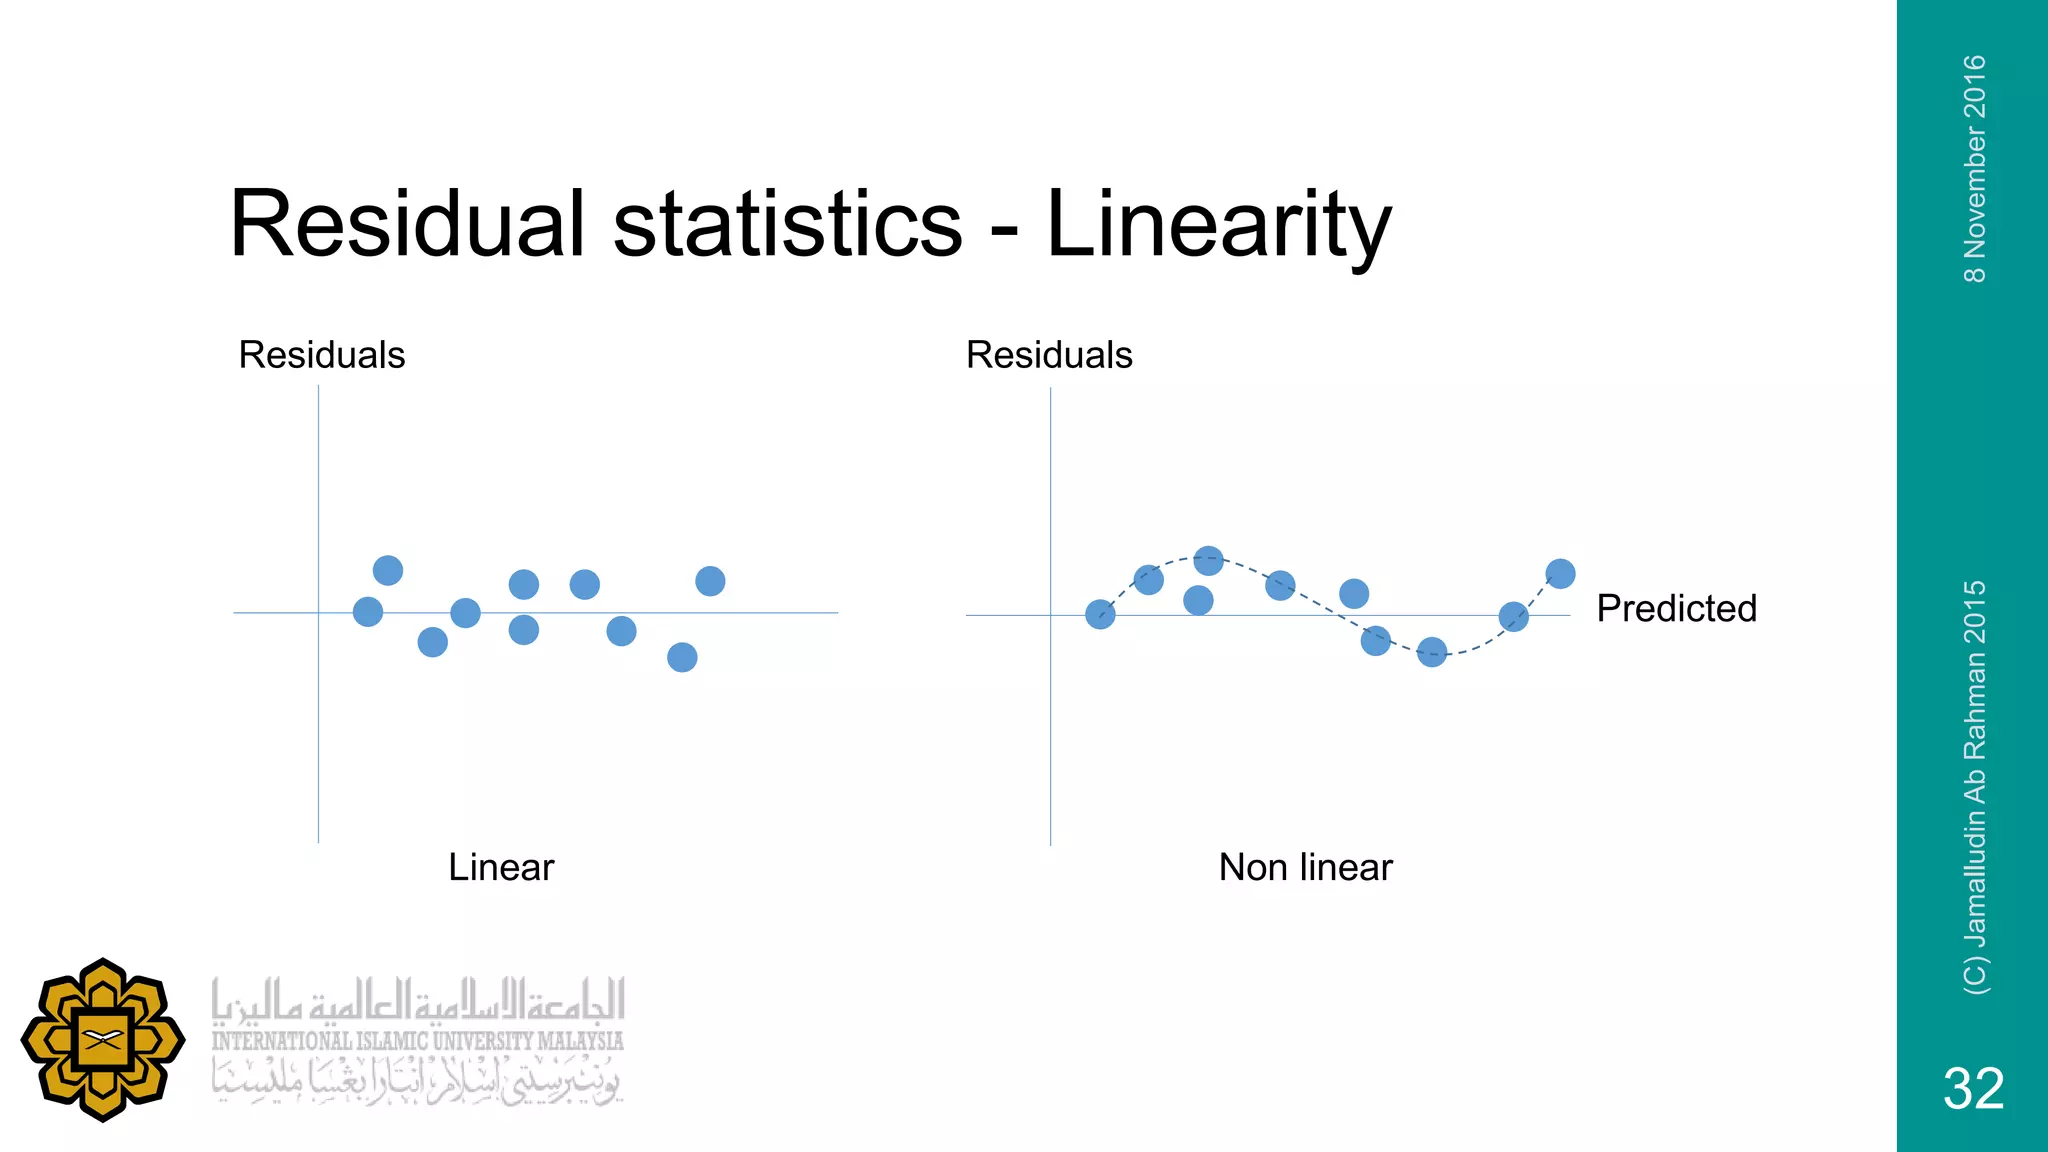
Overview of assumptions necessary for validating linear regression including linearity and normality.
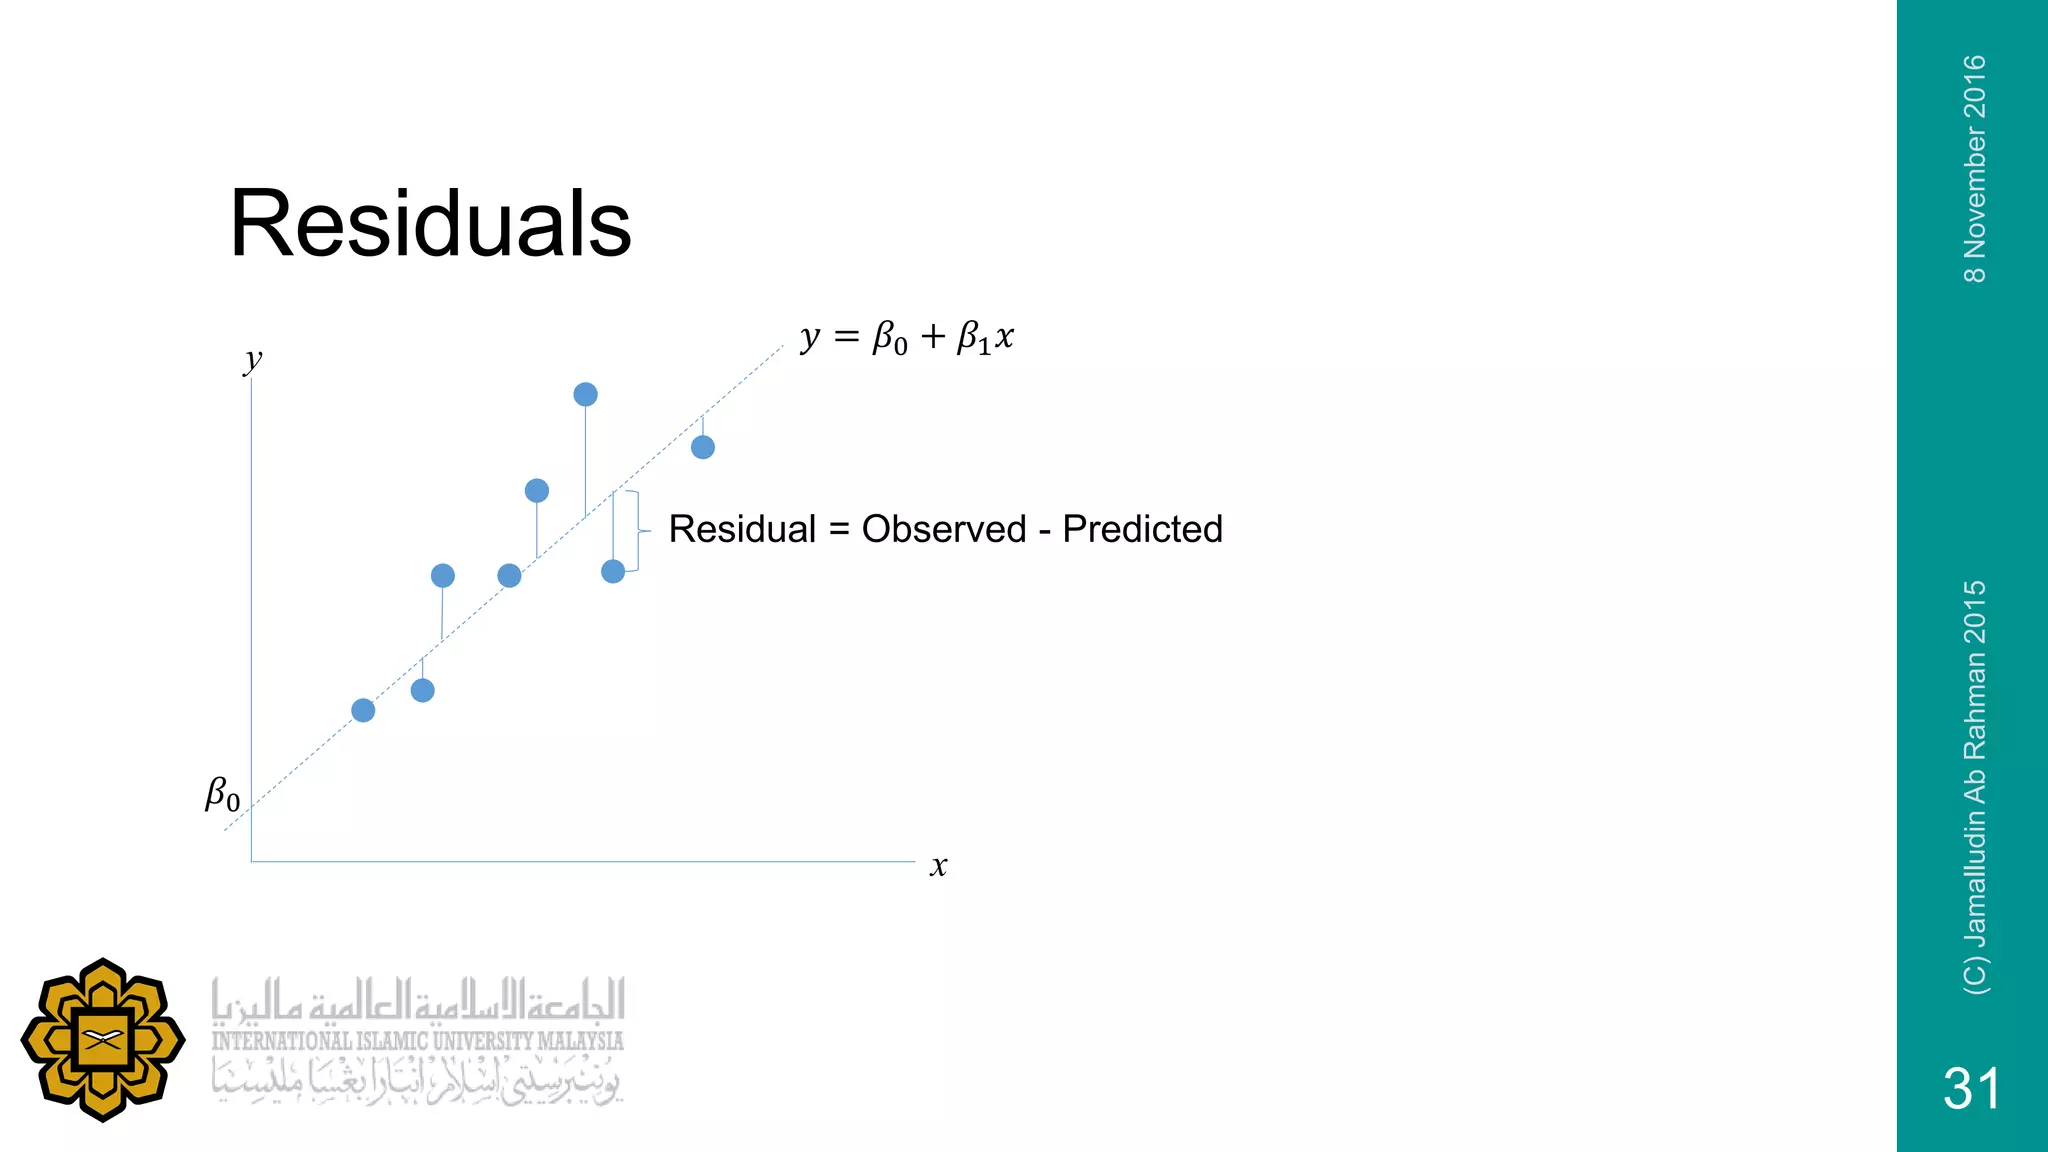
Definition and calculation of residuals in regression analysis.
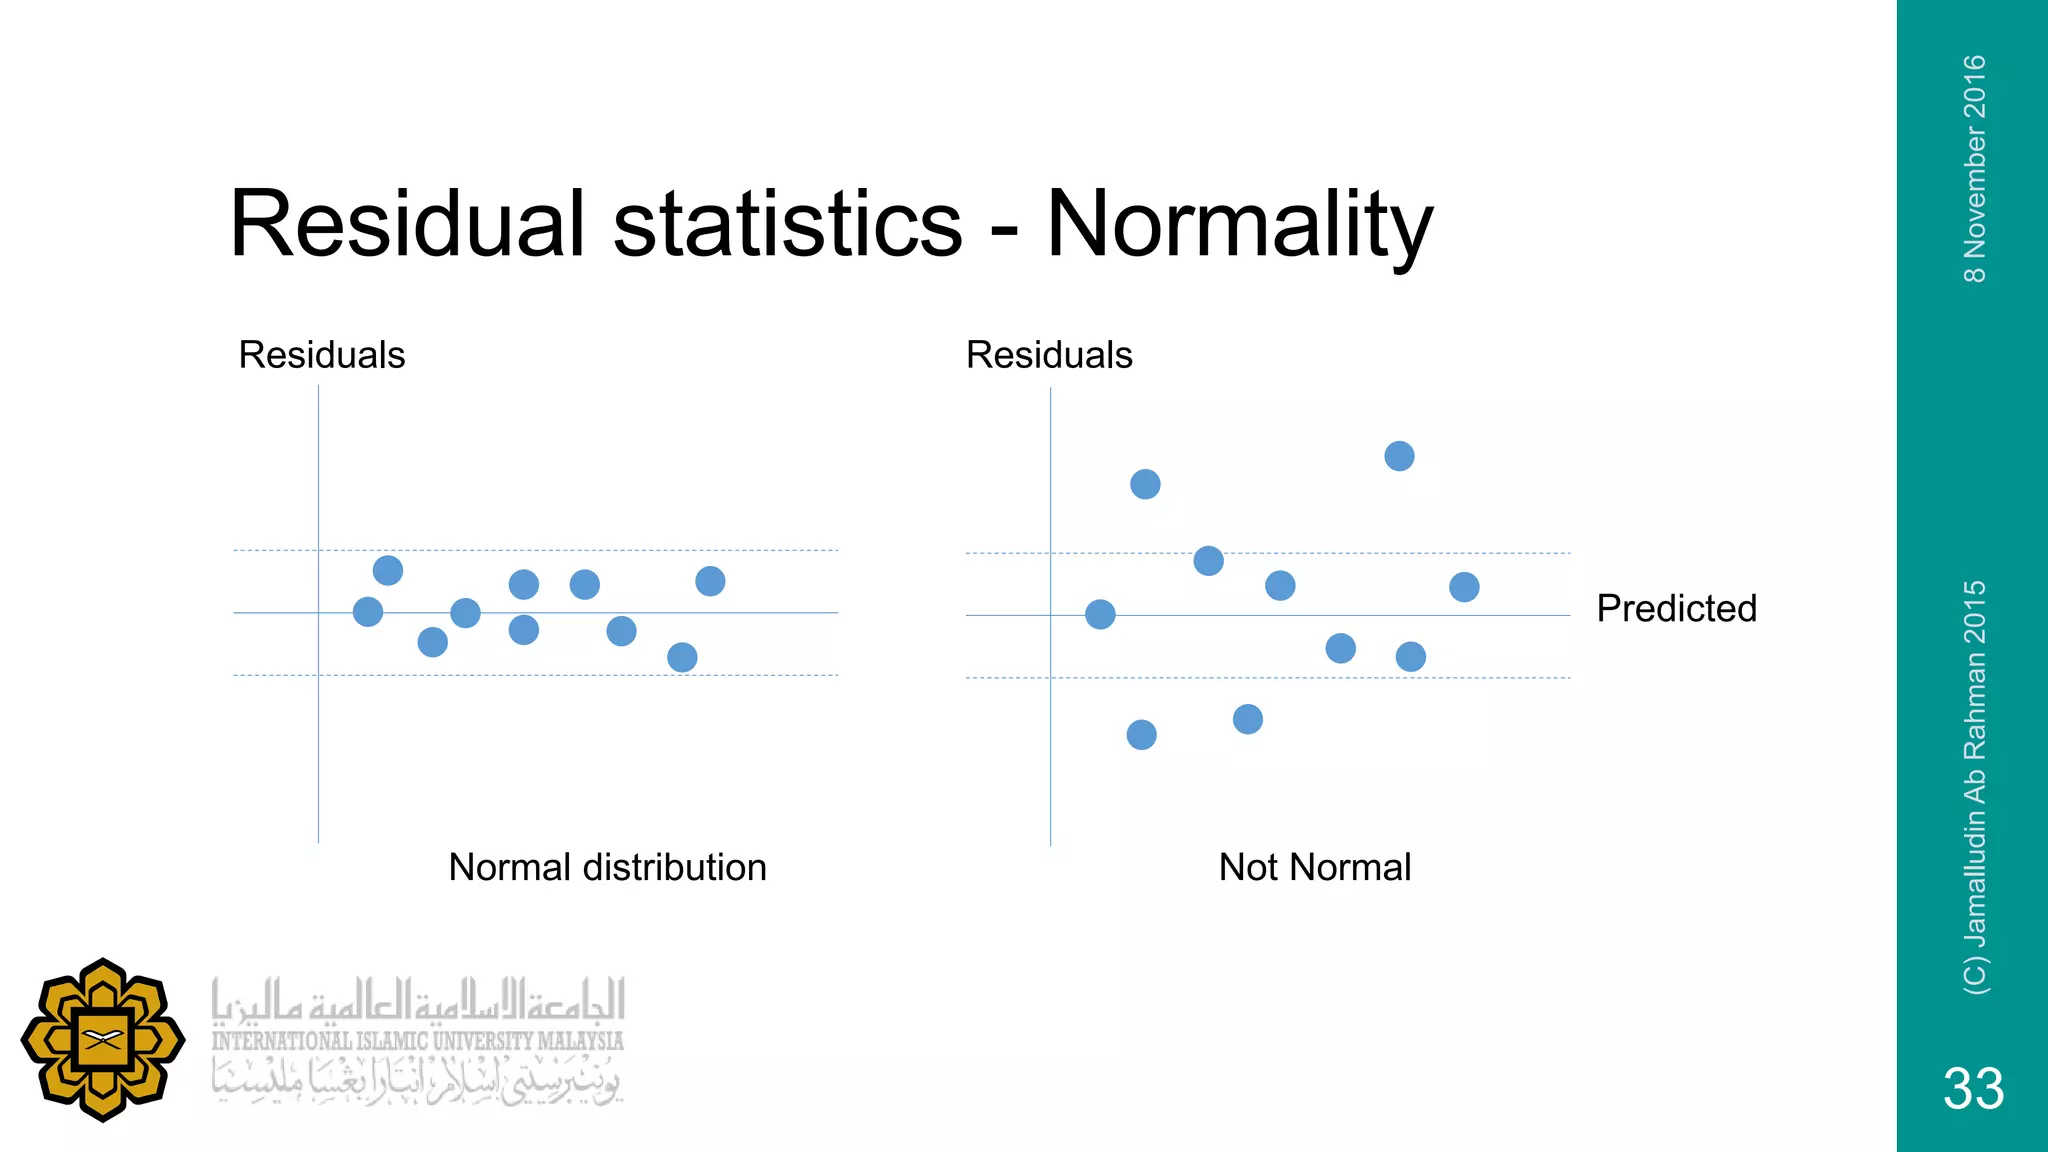
Assessment of residuals to determine whether they follow a normal distribution.
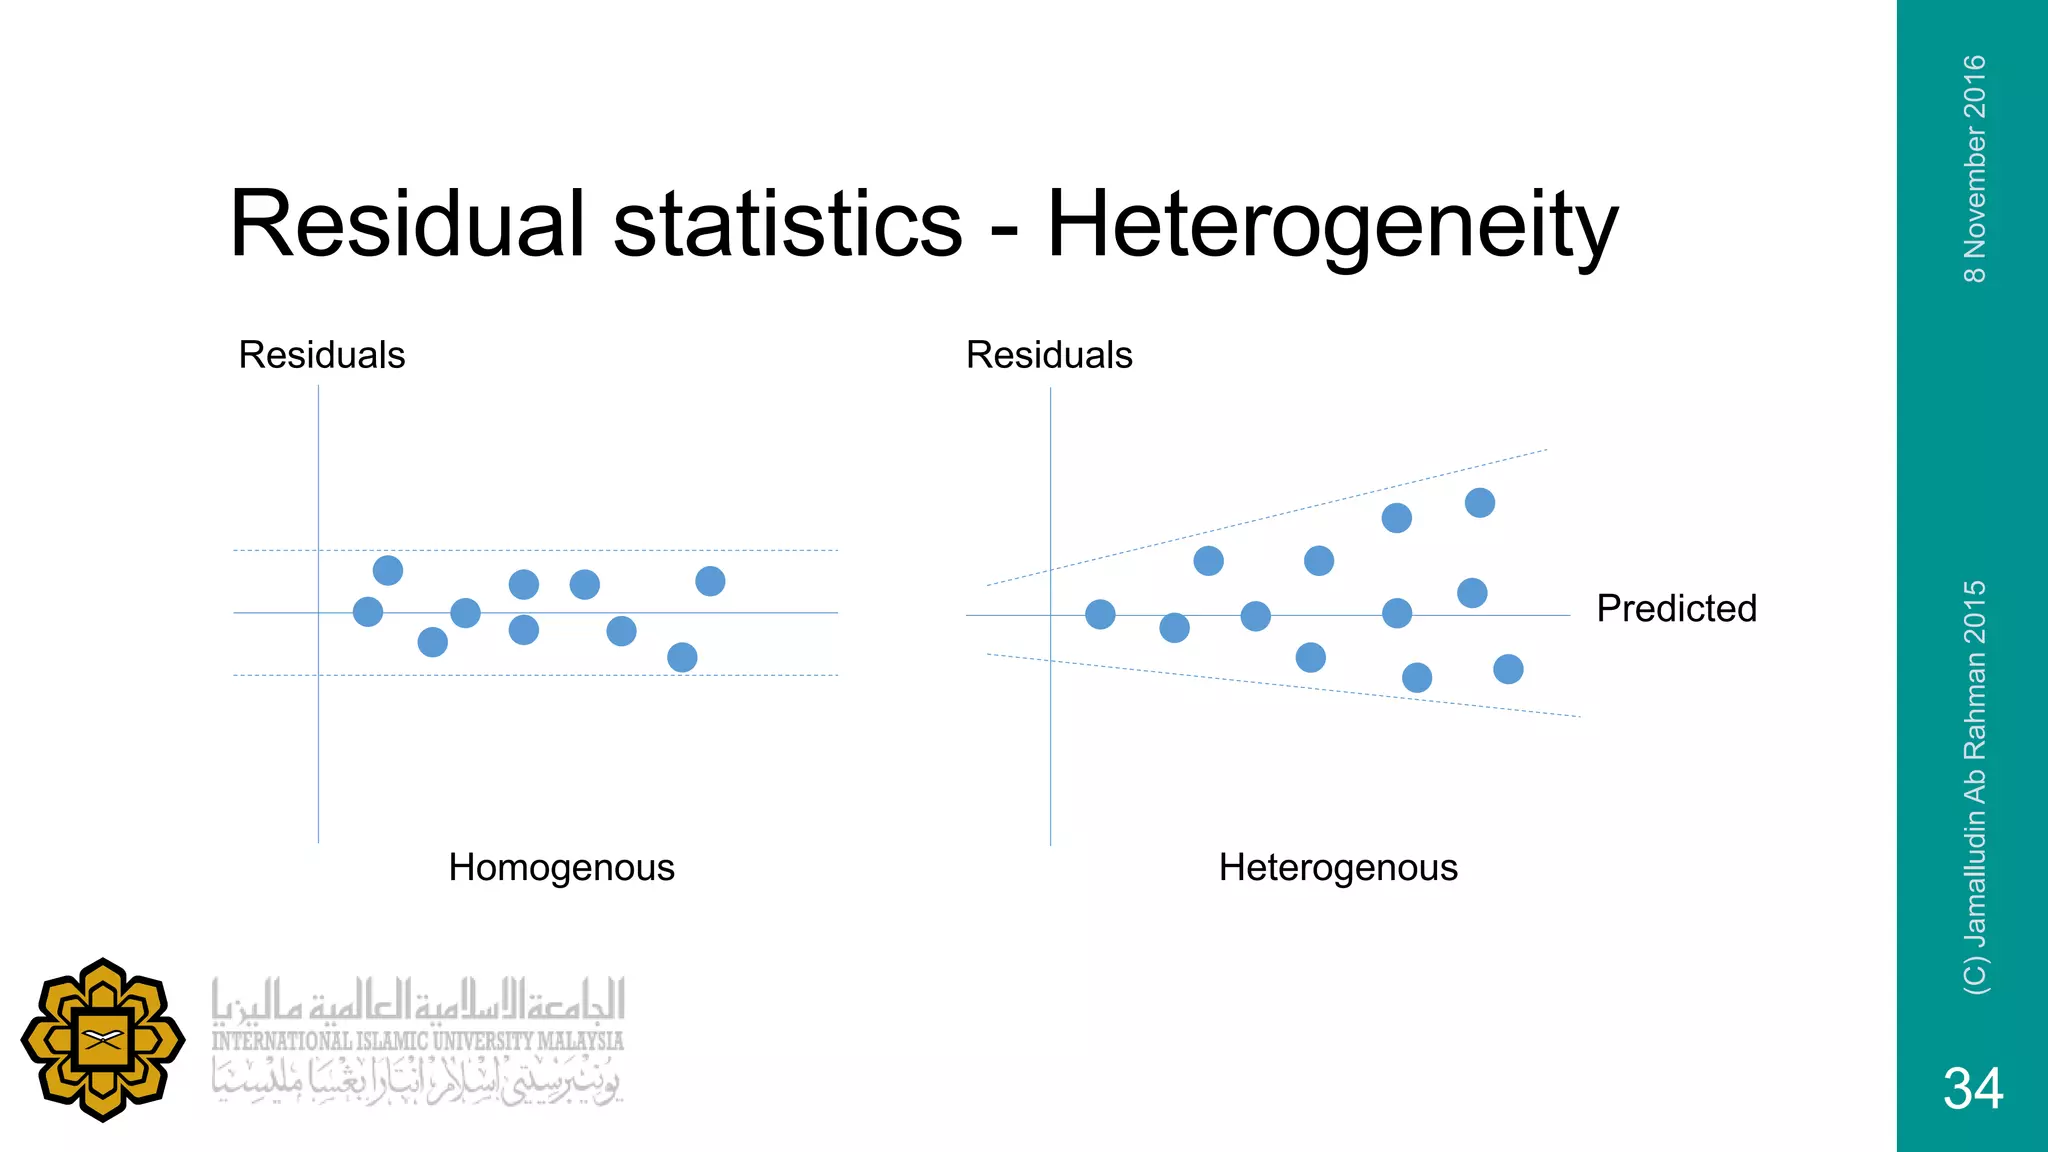
Evaluation of residuals for heterogeneity or homogeneity in the regression model.
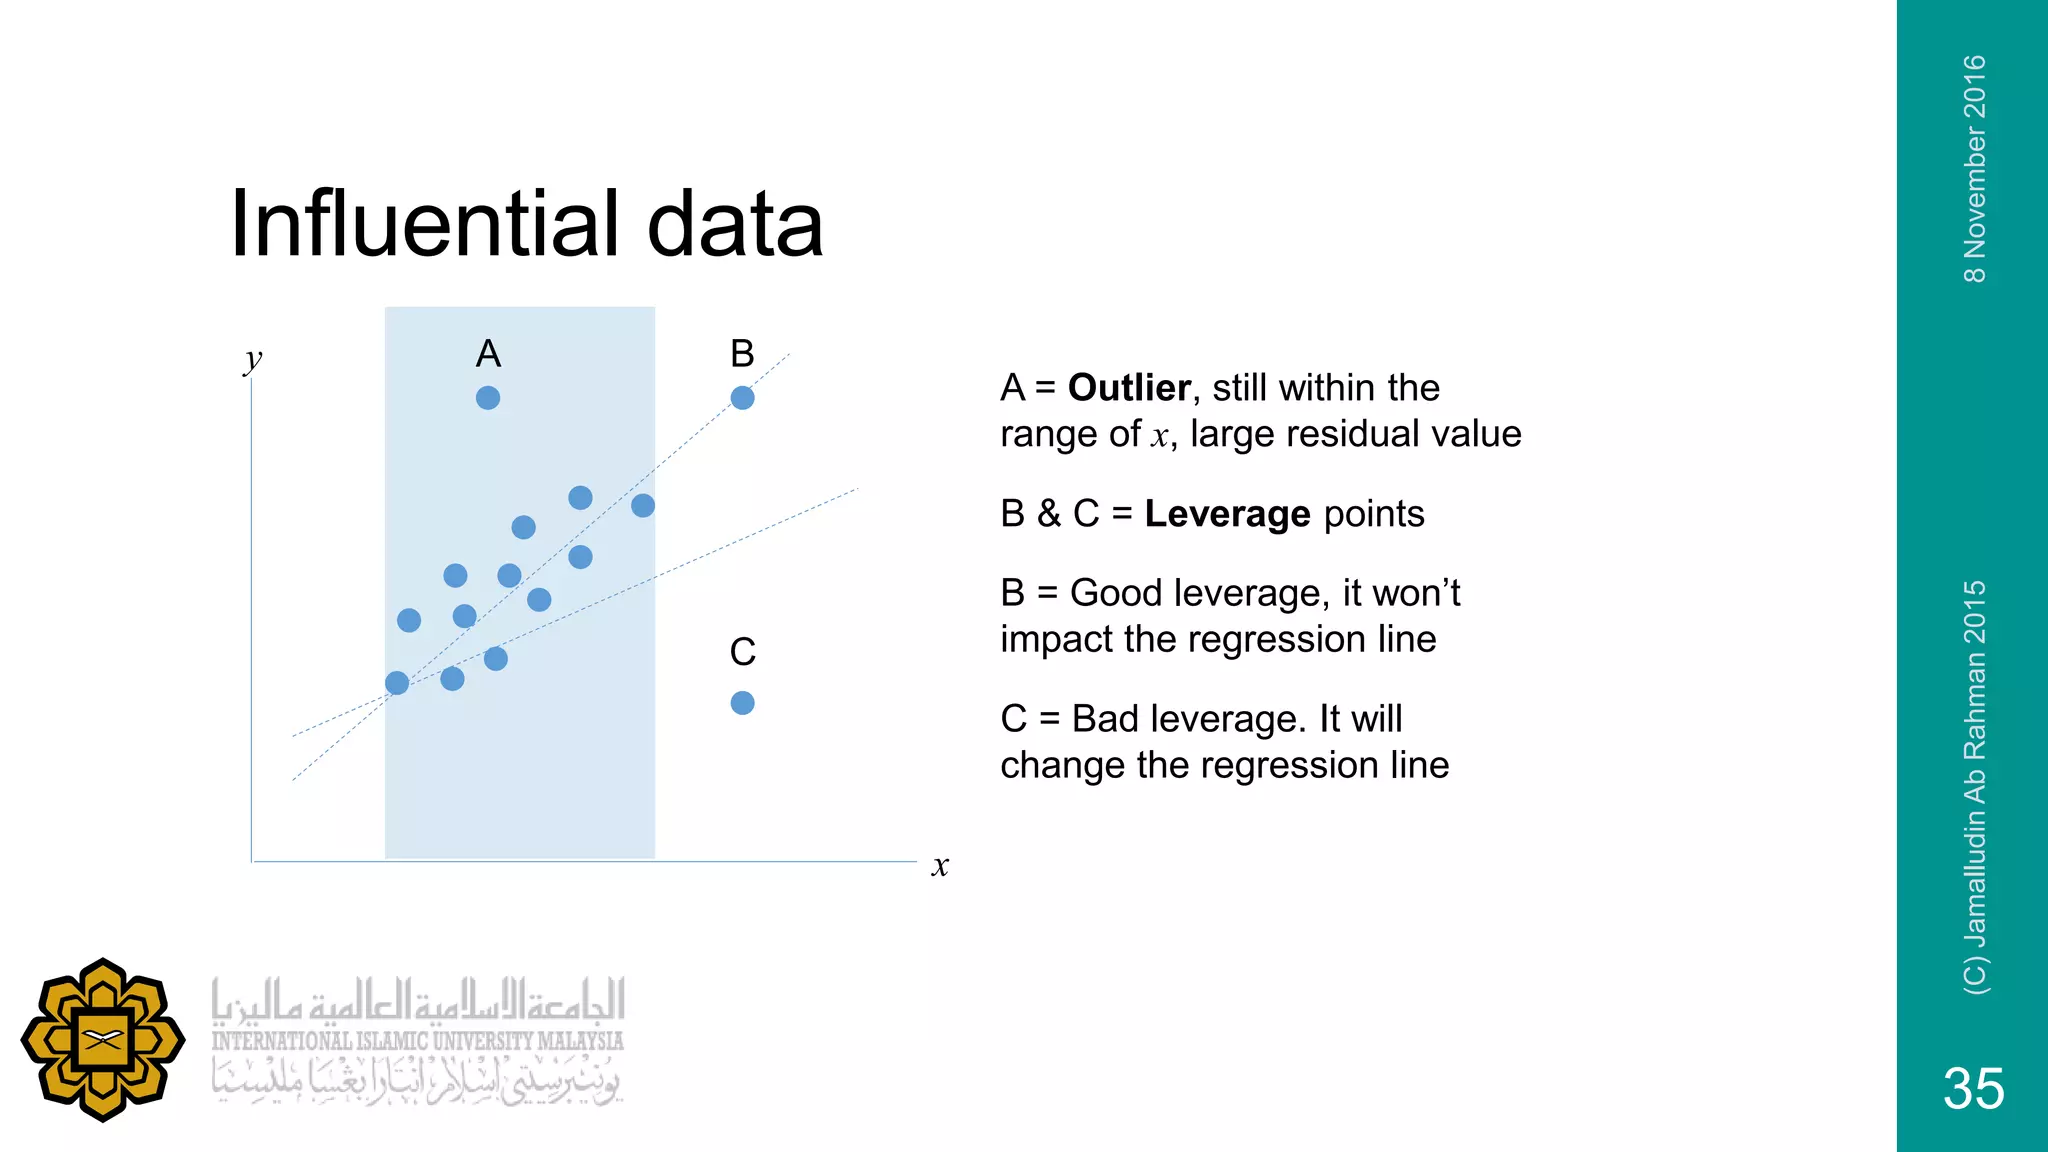
Explanation of influential data points and their potential effects on regression analysis.
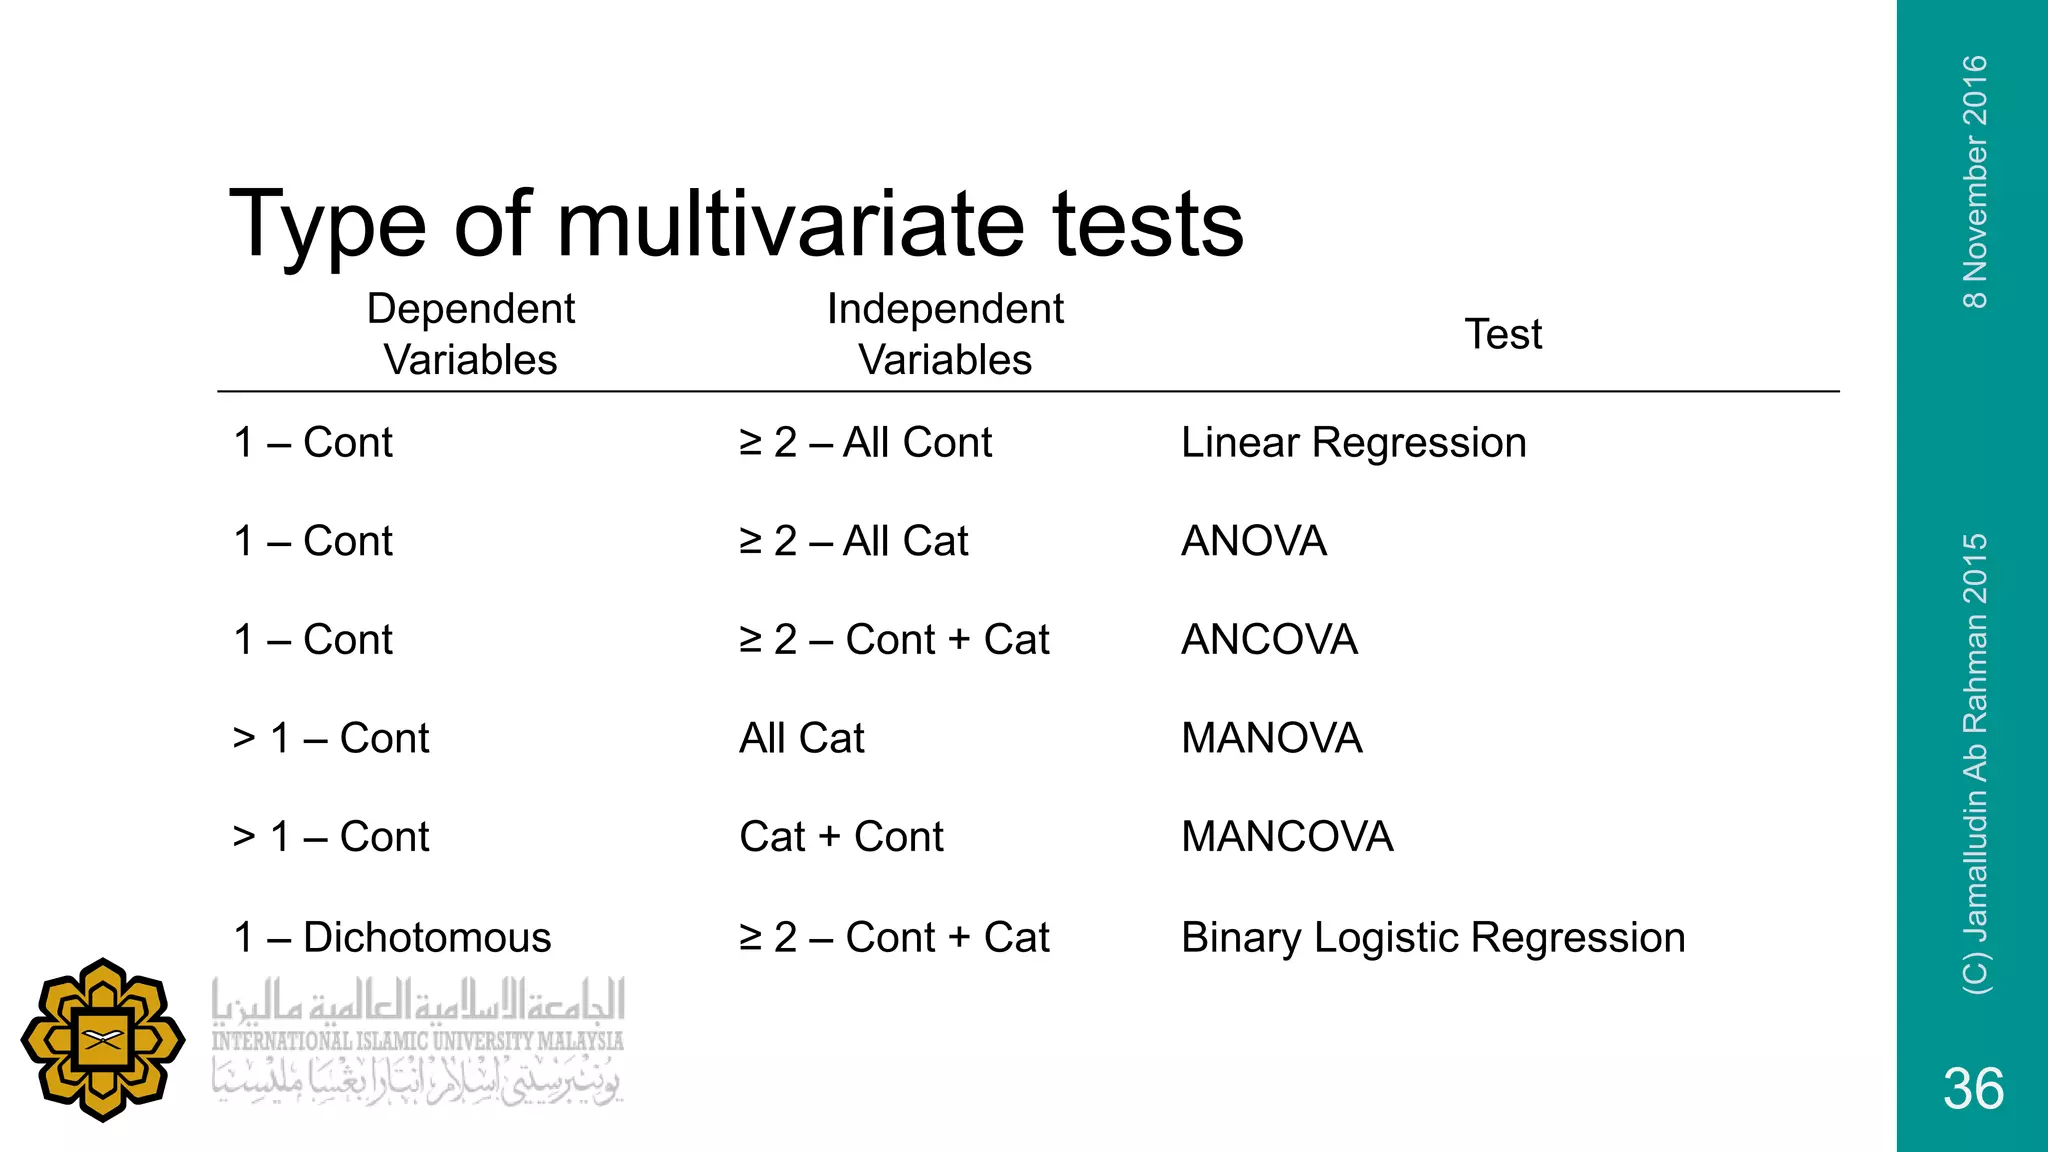
Categorization of multivariate tests based on dependent and independent variables.