This document provides an overview of international investing opportunities. It discusses how major institutional investors have allocated a percentage of assets internationally to increase diversification and improve returns. Studies show investing internationally can provide higher returns than investing solely in the US. Examples are given of large institutional investors like Harvard Management Company and CalPERS, which have achieved strong returns through international diversification. The document also outlines the geographic, instrument, and sector diversification opportunities available through international markets and how direct and indirect investment vehicles can provide access to these opportunities.


![10 International Investing: An Independent Advisor’s Guide
Diversification Opportunities
Geographic Diversification
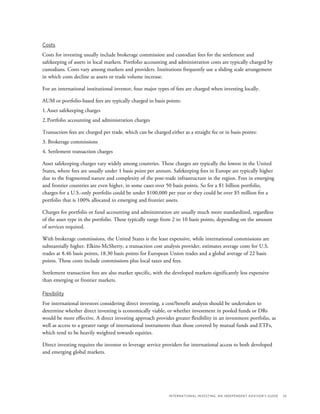
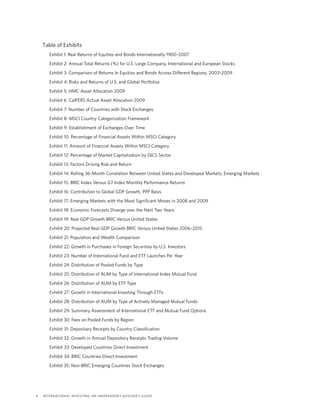
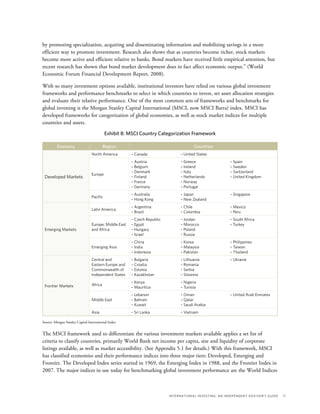
Political changes in the past twenty years have dramatically increased the number of countries available for
investment. Up until the fall of the Berlin Wall in 1989, the number of stock exchanges globally had remained
constant for decades. After the Wall fell, that number grew dramatically, more than doubling in two decades.
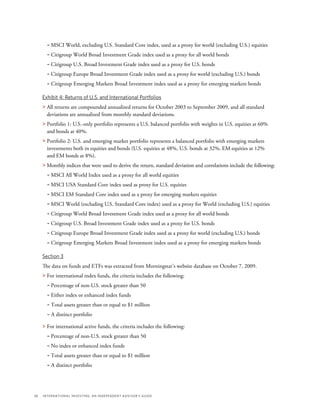
A 2007 Capco study presented a top-down analysis of the growth in exchanges at the country level.1
The
study used the International Standards Organization (ISO) list of 244 countries, of which the World Bank
had population and economic statistics for 2009. The findings from the study showed that in 1988, stock
exchanges existed in 63, or 26%, of the 244 countries. These countries comprised 58% of global population
and 81% of global gross domestic product (GDP, measured on the purchasing power parity [PPP] basis).
By 2005, there were national or regional stock exchanges present in 145, or 59%, of ISO-listed countries, which
together comprised 92% of the world’s population and 99% of global GDP (on a PPP basis). Another four
countries were planning to add exchanges at the time of the study: Libya, Cambodia, Sierra Leone and Gibraltar.
Exhibit 7: Number of Countries With Stock Exchanges
Source: Capco Analysis 2007
NumberNew
160
140
120
100
80
60
40
20
0
158517921808185018611869187518811890189419121929195319601969197519811986199019931996199920022005
Cumulative
Year
12
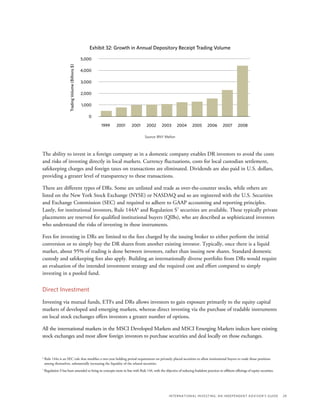
10
8
6
4
2
0
The remaining 95 ISO countries constitute only 1% of global GDP. There were 65 countries with
population counts that ranged from approximately 20,000 in Palau to 73 million in Ethiopia. The bulk of
these, approximately 50 countries, had populations under 10 million. The remaining 30 countries were small
islands with limited or no population. In summary, the study concluded that institutional and legal
frameworks and infrastructure for stock trading had been established in virtually all of the world’s significant
economies at that point.
This is significant in terms of assessing these countries from an investment perspective as long-term potential
growth opportunities. As the World Economic Forum states, “Stock market liquidity is statistically significant
in terms of its positive impact on capital accumulation, productivity growth and current and future rates of
economic growth. More generally, economic theory suggests that stock markets encourage long-run growth
1
See page 37 for Methodology.](https://image.slidesharecdn.com/73f49de3-8dfa-47b1-ab57-77d42c300dcc-160416094254/85/International-Investing-PAS-10-320.jpg)
![16 International Investing: An Independent Advisor’s Guide
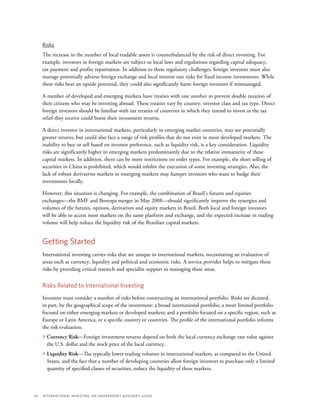
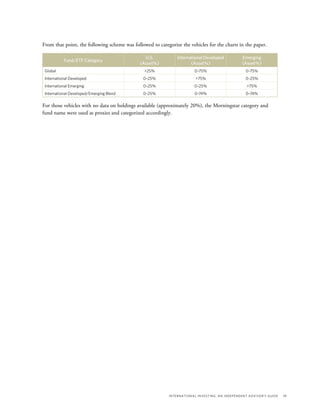
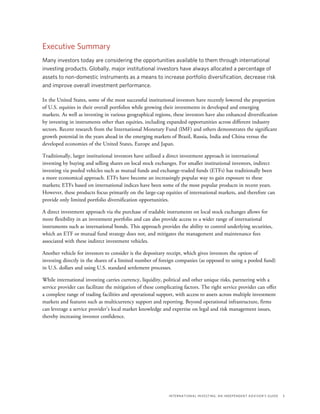
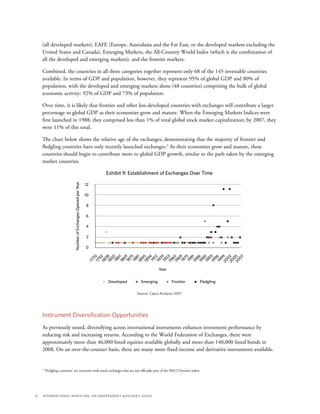
Exhibit 14: Rolling 36-Month Correlation Between
United States and Developed Markets, Emerging Markets
Source: The World Is Not Enough?, MSCI Barra Research, July 2008
DM-EMUSA-EAFE USA-EM
100%
80%
60%
40%
20%
0%
Dec90Dec91
Dec07
Dec93Dec94Dec95Dec96Dec97Dec98Dec99Dec00
Dec02Dec03Dec04Dec05Dec06
Dec01However, as Exhibit 14 above shows, correlation between markets has not always been a straight-line
phenomenon, but instead is cyclical and marked by ups and downs. Taking the USA–Emerging Market (USA-
EM) series as an example (orange line in Exhibit 14 above), the correlation between the two peaked in 1993 at
approximately 65%; two years later, correlation had been approximately halved to 30%. Similarly, in 2004,
correlation for the series was approximately 80%; three years later it had dropped to approximately 60%.
As expected, the overall trend for the past decade has been up on an absolute basis; however, on a relative basis,
there are still periods of decreasing correlation, which have benefited investors with internationally diversified
portfolios. As long as there is a relative difference in the performance of U.S. and non-U.S. markets, (correlation
remaining below 100%), the benefits of diversification will still exist.
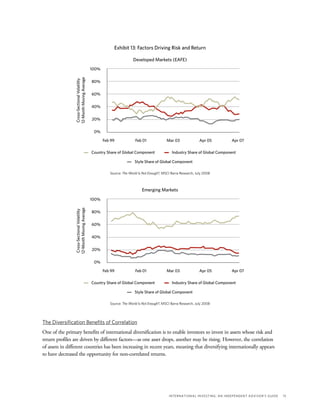
Developed and Emerging Markets—Trends and Opportunities
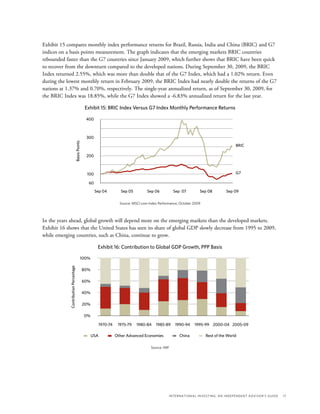
From 2003 to 2007, the global economy boomed for a sustained period. Global GDP rose at an average of
approximately 5% a year, its highest sustained rate since the early 1970s. About three quarters of this growth
was attributable to a broad-based surge in the emerging and developed economies.4
Events since the summer
of 2007 and through 2009 have significantly altered the global economic and investing landscape.
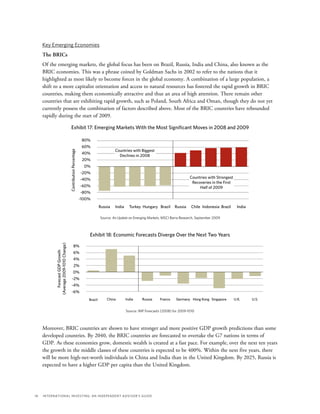
The economic crisis has had a significant impact on the global economy, especially in the emerging markets
that suffered a sharp reduction or redemption in capital flows because of the desire for capital protection.
Despite a 39% fall in the MSCI Emerging Markets Index, the emerging markets have grown by 93%
(Compound Annual Growth Rate [CAGR]) starting from 2003, as compared to the S&P 500®, which has
grown by only 6.5%. Thus, although the credit crisis and the subsequent events of 2008 have caused short-
term volatility and declines in emerging markets, long-term attractiveness remains.
4
World Economic Outlook, International Monetary Fund, October 2008.](https://image.slidesharecdn.com/73f49de3-8dfa-47b1-ab57-77d42c300dcc-160416094254/85/International-Investing-PAS-16-320.jpg)