Download to read offline

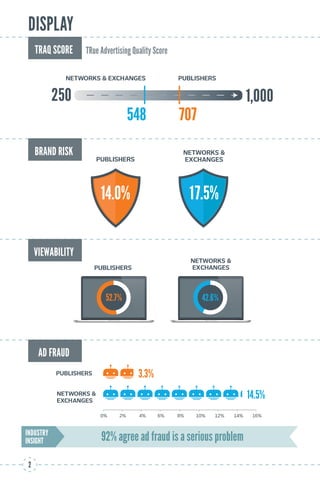


Integral Ad Science's Q4 2014 media quality report found that: - Viewability rates for publisher inventory remained steady at 52.7% while improving for networks/exchanges to 42.6% - Video ad viewability increased 9 points to 39% - Violence and adult content remained the top categories for brand risk


