Insurer Participation in the 2017 Individual Marketplace - Updated November 17, 2017
•
1 like•14,847 views

Insurer Participation in the 2017 Individual Marketplace - Updated November 17, 2017

Recommended
Recommended
More Related Content
What's hot
What's hot (20)
Similar to Insurer Participation in the 2017 Individual Marketplace - Updated November 17, 2017
Similar to Insurer Participation in the 2017 Individual Marketplace - Updated November 17, 2017 (20)
More from KFF
More from KFF (20)
Recently uploaded
Recently uploaded (20)
Insurer Participation in the 2017 Individual Marketplace - Updated November 17, 2017
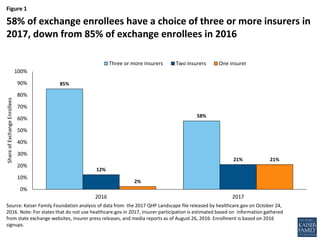
- 1. Figure 1 58% of exchange enrollees have a choice of three or more insurers in 2017, down from 85% of exchange enrollees in 2016 85% 58% 12% 21% 2% 21% 0% 10% 20% 30% 40% 50% 60% 70% 80% 90% 100% 2016 2017 ShareofExchangeEnrollees Three or more insurers Two insurers One insurer Source: Kaiser Family Foundation analysis of data from the 2017 QHP Landscape file released by healthcare.gov on October 24, 2016. Note: For states that do not use healthcare.gov in 2017, insurer participation is estimated based on information gathered from state exchange websites, insurer press releases, and media reports as of August 26, 2016. Enrollment is based on 2016 signups.
- 2. Figure 2 1,021 counties have only one exchange insurer in 2017 compared to 225 counties in 2016 2,014 949904 1,158 225 1,036 0 500 1,000 1,500 2,000 2,500 2016 2017 NumberofCounties Three or more insurers Two insurers One insurer Source: Kaiser Family Foundation analysis of data from the 2017 QHP Landscape file released by healthcare.gov on October 24, 2016. Note: For states that do not use healthcare.gov in 2017, insurer participation is estimated based on information gathered from state exchange websites, insurer press releases, and media reports as of August 26, 2016. Enrollment is based on 2016 signups.
- 3. Figure 3 62% 28% 20% 31% 18% 41% 0% 10% 20% 30% 40% 50% 60% 70% Metro Non-Metro ShareofExchangeEnrollees Three or more insurers Two insurers One insurer Source: Kaiser Family Foundation analysis of data from the 2017 QHP Landscape file released by healthcare.gov on October 24, 2016. Note: For states that do not use healthcare.gov in 2017, insurer participation is estimated based on information gathered from state exchange websites, insurer press releases, and media reports as of August 26, 2016. Enrollment is based on 2016 signups. Metro/Non-Metro county classifications are based on definitions from the Federal Office of Rural Health Policy. 62% of exchange enrollees living in metro counties will have a choice of three or more insurers in 2017
- 4. Figure 4 2% 12% 19% 18% 15% 13% 12% 4% 2% 2% 21% 21% 20% 17% 7% 5% 5% 3% 1% 0% 0% 5% 10% 15% 20% 25% 1 2 3 4 5 6 7 8 9 10 ShareofExchangeEnrollees Number of Insurers 2016 2017 Source: Kaiser Family Foundation analysis of data from the 2017 QHP Landscape file released by healthcare.gov on October 24, 2016. Note: For states that do not use healthcare.gov in 2017, insurer participation is estimated based on information gathered from state exchange websites, insurer press releases, and media reports as of August 26, 2016. Enrollment is based on 2016 signups. Distribution of Exchange Enrollees by Number of Insurers in 2016 and 2017
- 5. Figure 5 33% 7% 21% 2% 37% 29% 21% 12% 30% 64% 58% 85% 0% 10% 20% 30% 40% 50% 60% 70% 80% 90% 100% Counties (2017) Counties (2016) Enrollees (2017) Enrollees (2016) One insurer Two insurers Three or more insurers Source: Kaiser Family Foundation analysis of data from the 2017 QHP Landscape file released by healthcare.gov on October 24, 2016. Note: For states that do not use healthcare.gov in 2017, insurer participation is estimated based on information gathered from state exchange websites, insurer press releases, and media reports as of August 26, 2016. Enrollment is based on 2016 signups. 32% of counties will have one exchange insurer in 2017, compared to 7% of counties with one exchange insurer in 2016
- 6. Figure 6 Source: Kaiser Family Foundation analysis of data from the 2017 QHP Landscape file released by healthcare.gov on October 24, 2016. Note: We define the number of insurers in a single county as the number of insurers (grouped by parent company or group affiliation) that offer at least one silver plan in the county. For states that do not use healthcare.gov in 2017, insurer participation is estimated based on information gathered from state exchange websites, insurer press releases, and media reports as of August 26, 2016. States that do not use healthcare.gov in 2017 are: California, Colorado, Connecticut, District of Columbia, Idaho, Maryland, Massachusetts, Minnesota, New York, Rhode Island, Vermont, and Washington. See the interactive map here: https://public.tableau.com/profile/kaiser.family.foundation#!/vizhome/InsurerParticipationinthe2017IndividualMarketplace/2017I nsurerParticipation Insurer Participation by County in 2017