Download to read offline
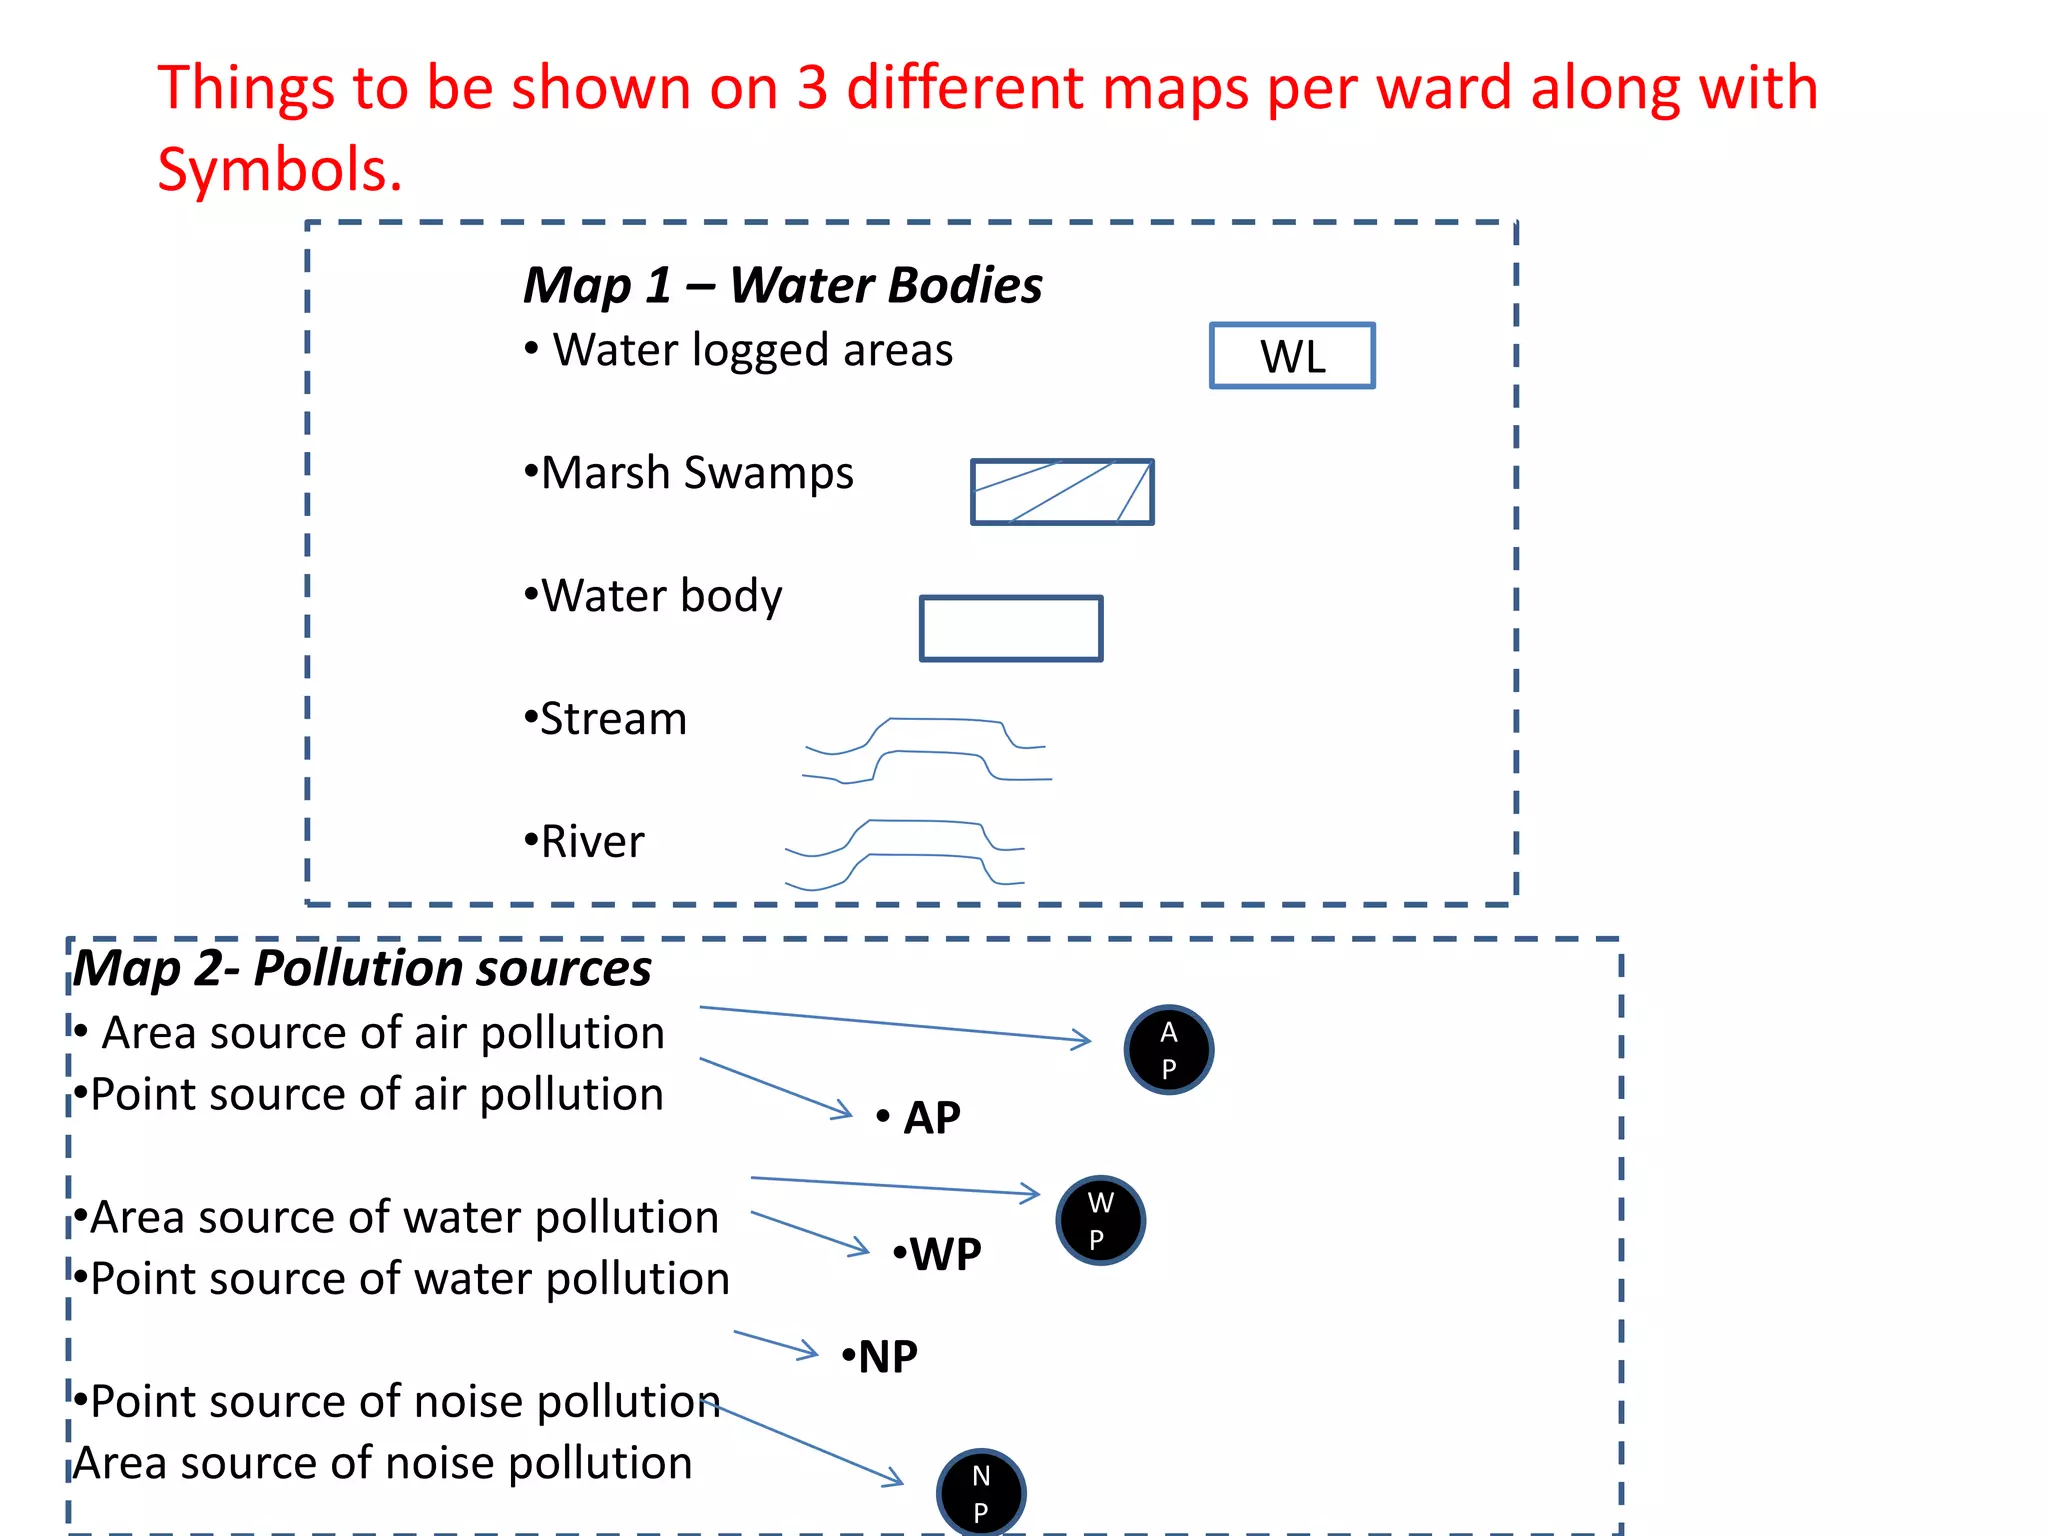
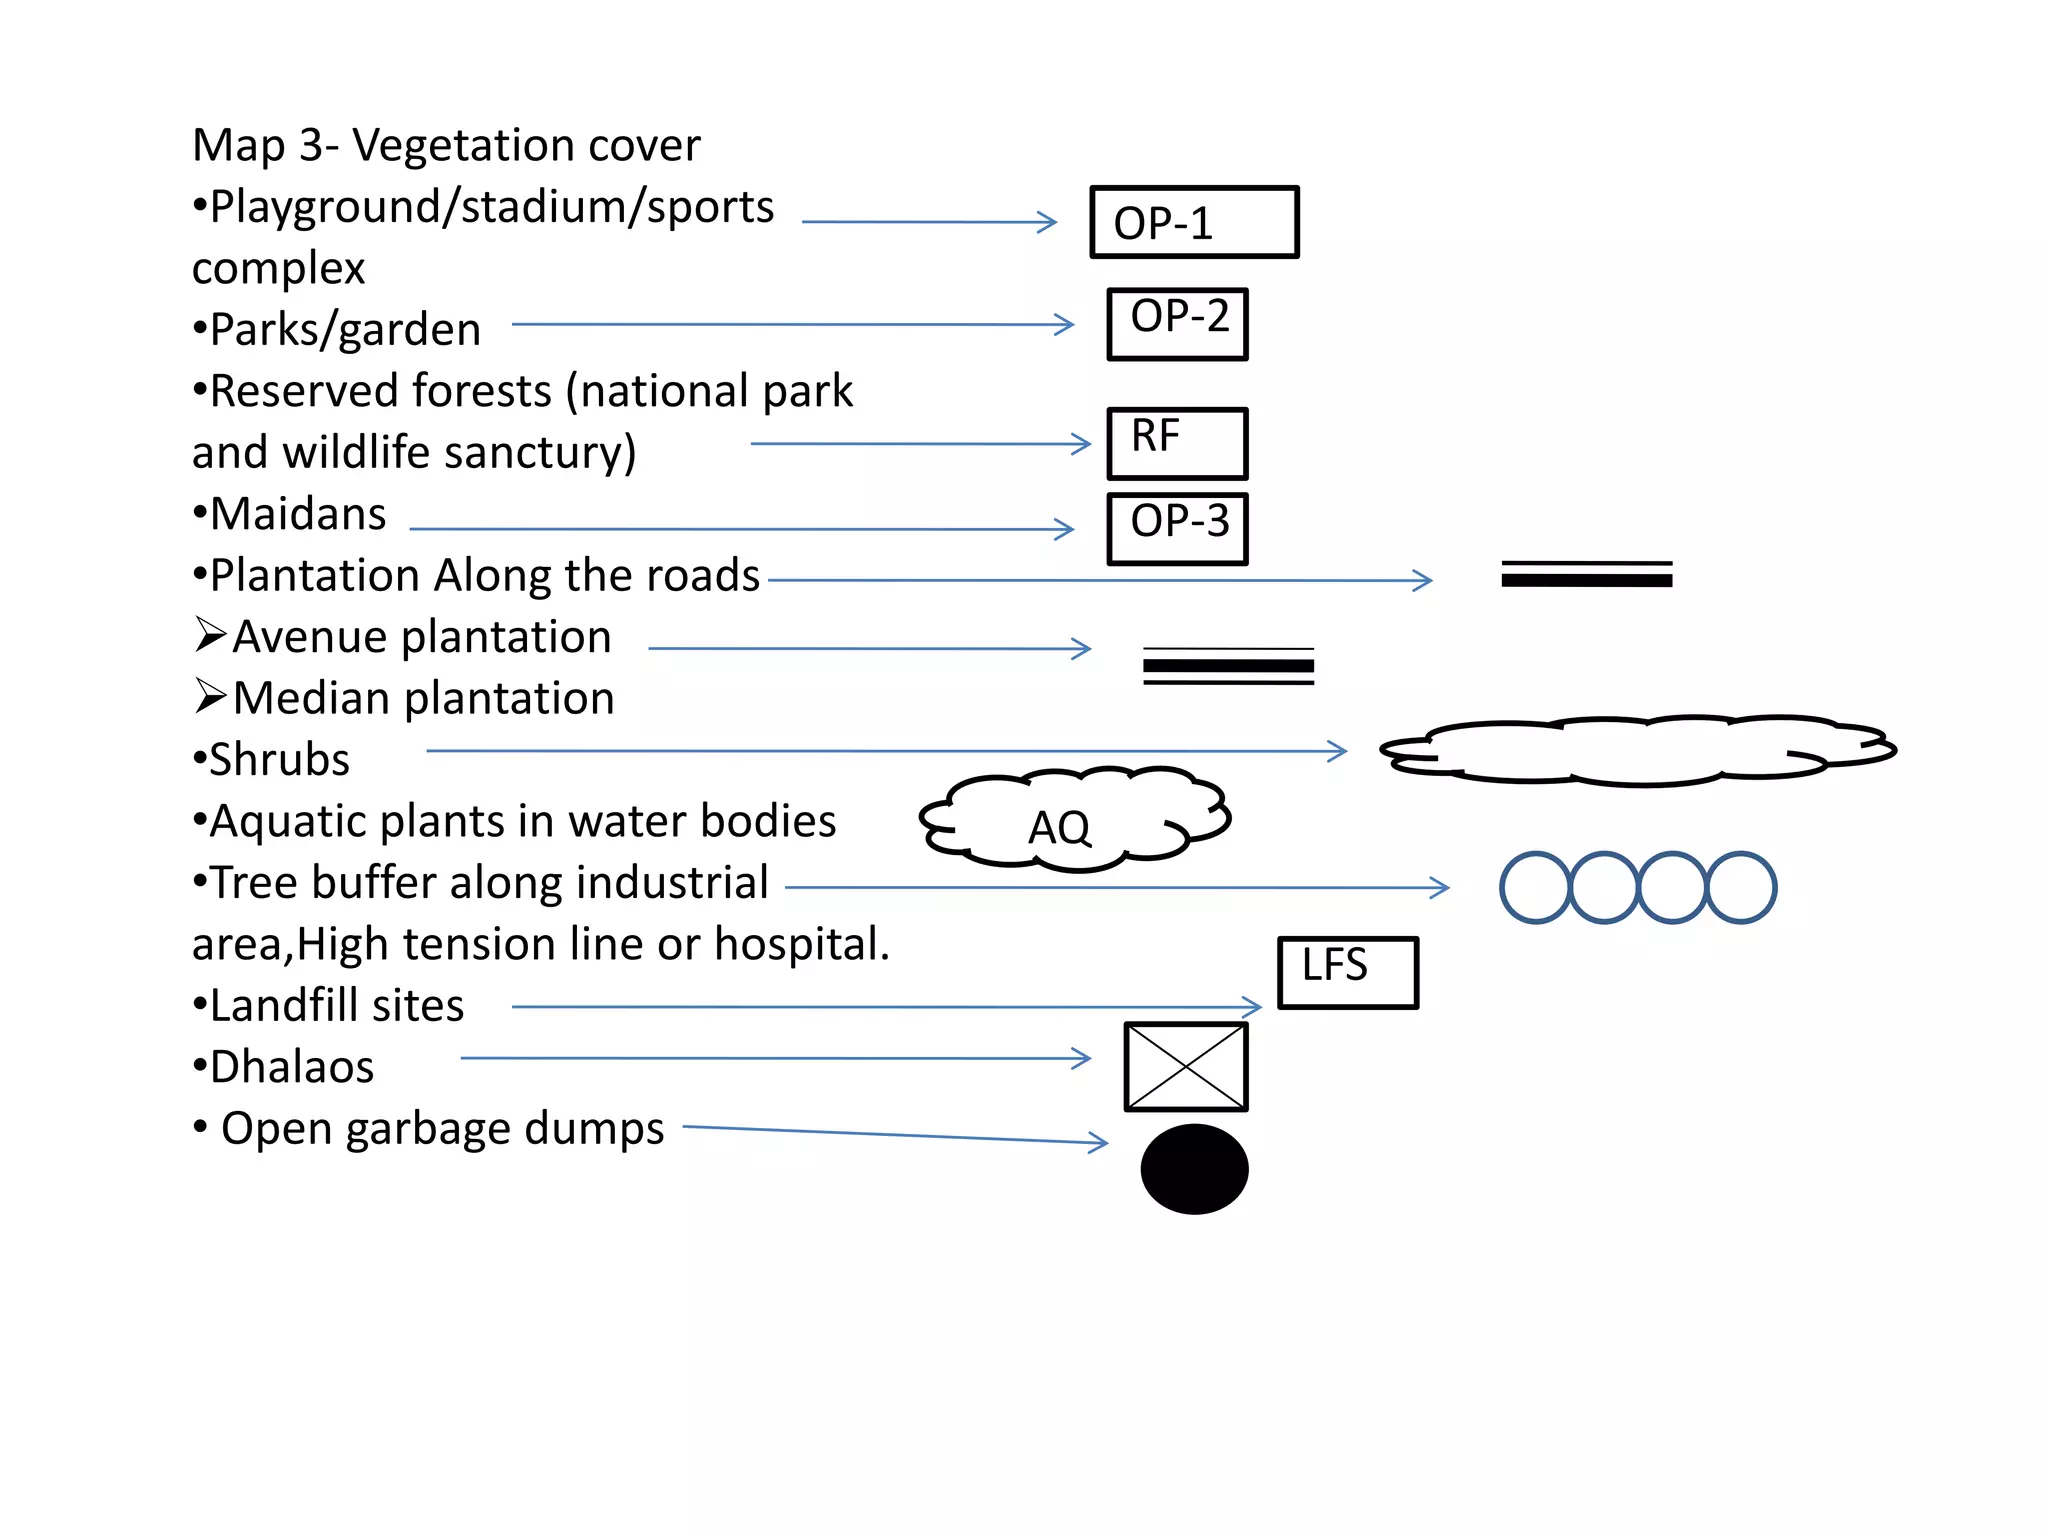
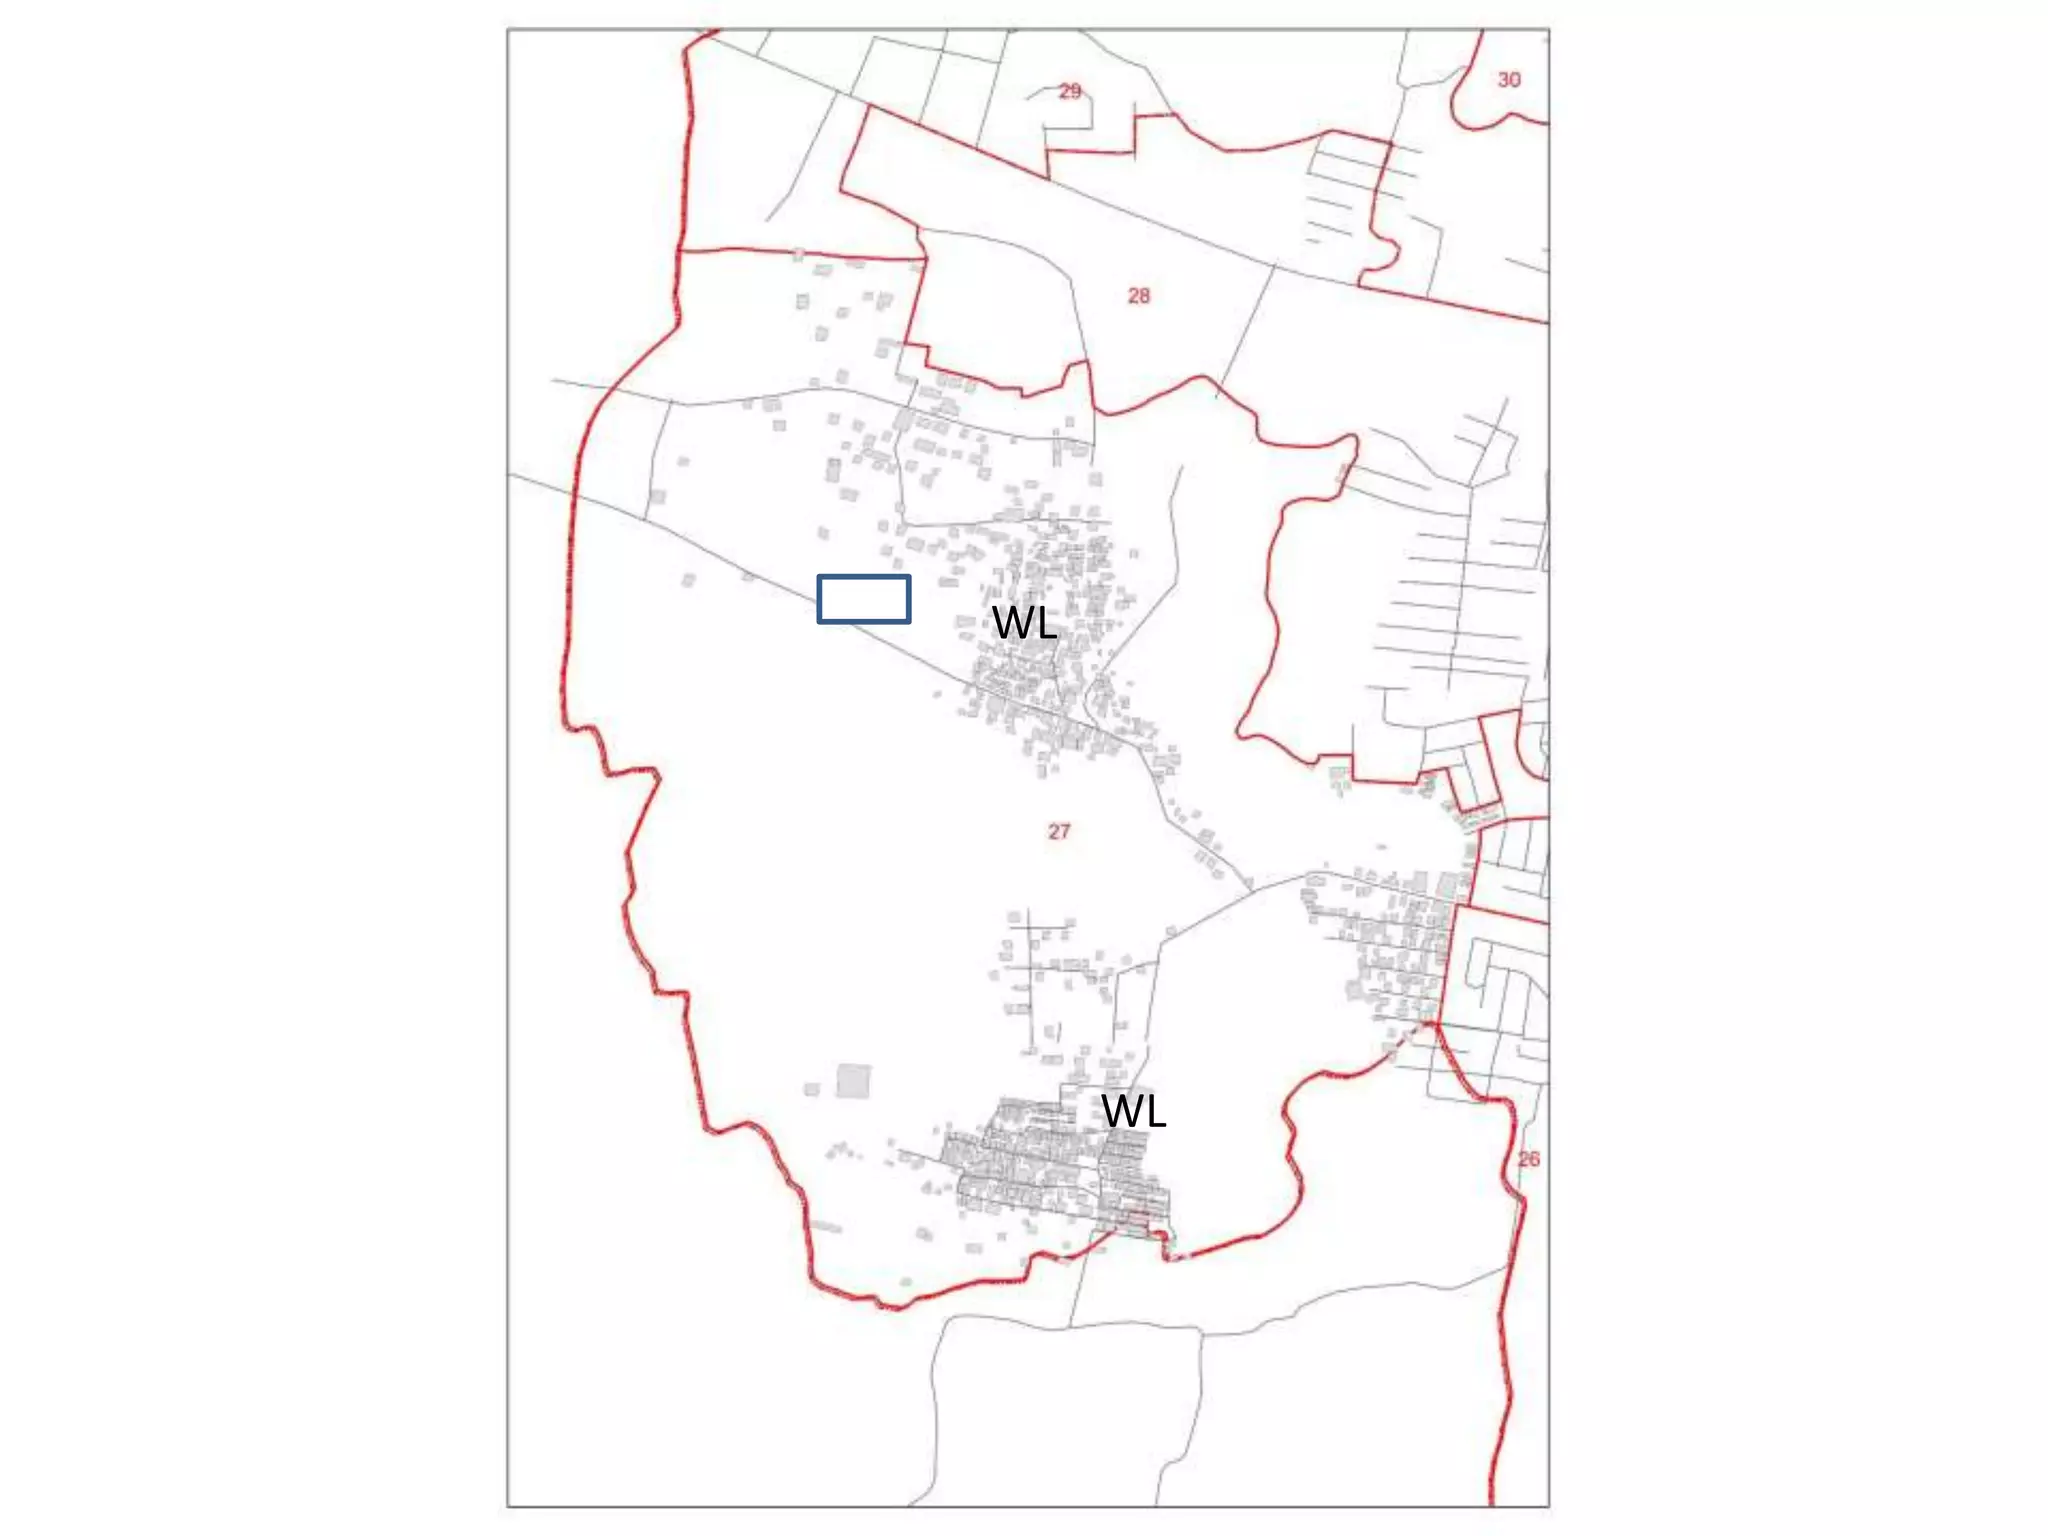
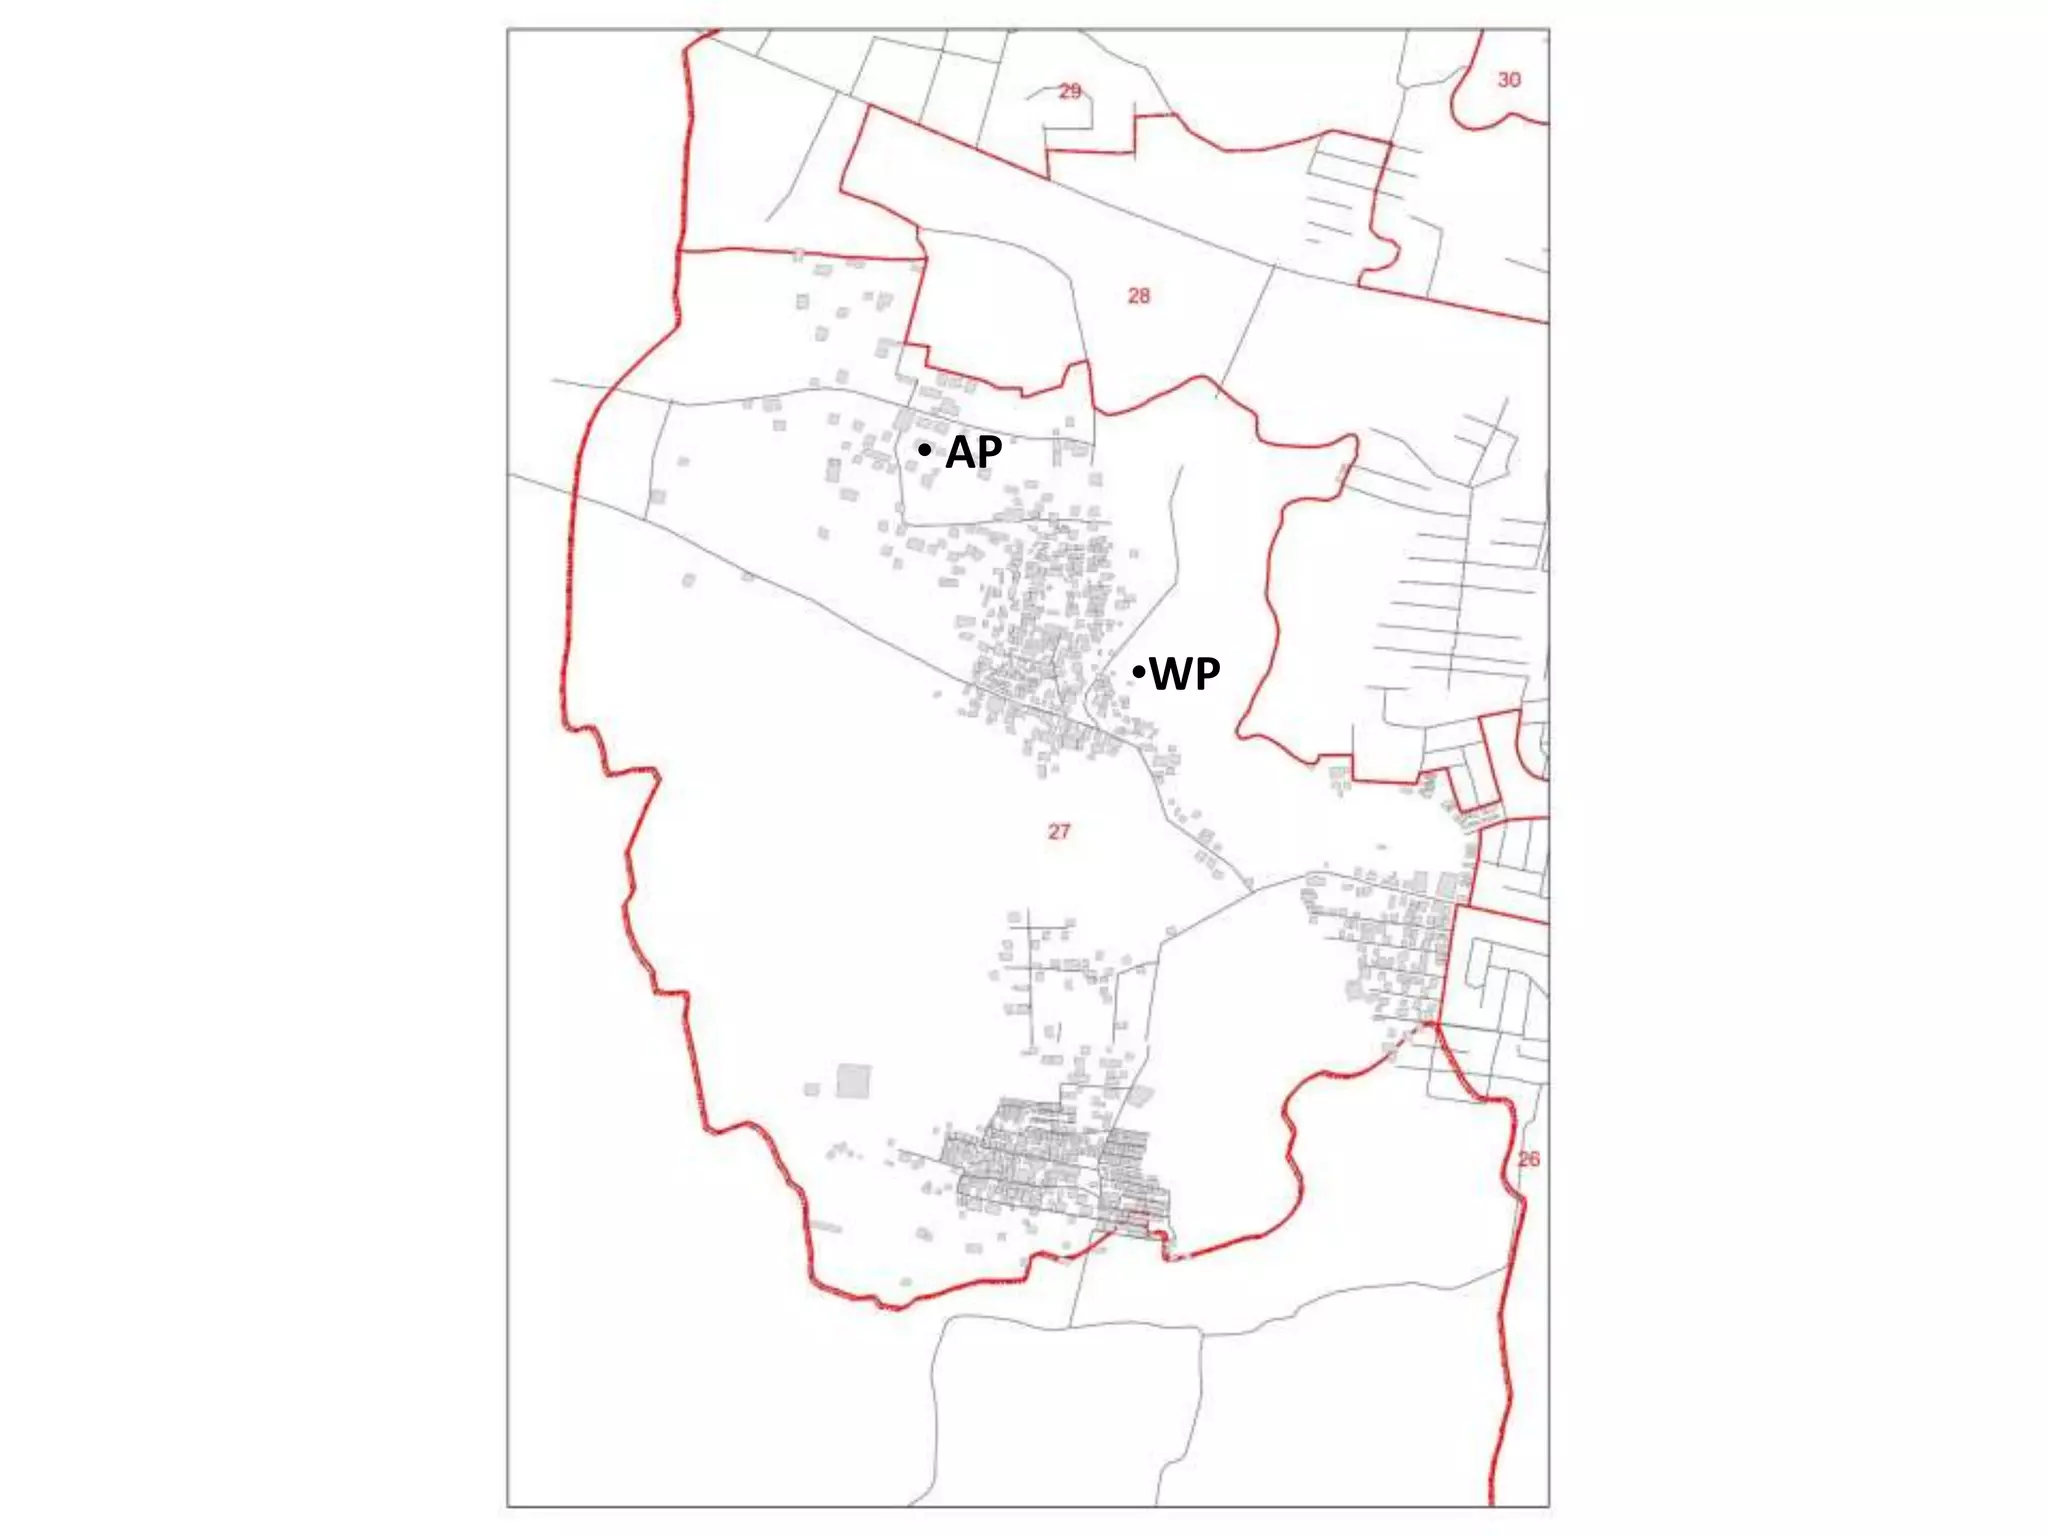
Map 1 shows water bodies like water logged areas, marshes, streams, rivers. Map 2 shows sources of pollution including area and point sources of air, water, and noise pollution. Map 3 displays vegetation cover such as playgrounds, parks, forests, plantations, and trees along roads, industries, and hospitals as well as landfill and garbage sites.


![Pollution.ppt [Autosaved].ppt yogesh kumbhar](https://cdn.slidesharecdn.com/ss_thumbnails/pollution-251205194856-d30cfee8-thumbnail.jpg?width=640&height=640&fit=bounds)


